Figures & data
Figure 1. Dynamics in blood TCRβ repertoires were similar between ICT responders and non-responders. (a) Experimental timeline depicting when tumors were inoculated subcutaneously (s.c.), ICT (anti-CTLA-4 + anti-PD-L1) was treated via intraperitoneal (i.p.) injection and blood samples were acquired. (b) AB1-HA tumor growth curves of PBS and ICT treated animals. PBS (black, n = 5) treated, ICT responding (blue, n = 5) and non-responding (red, n = 5) animals represented. Dotted lines on growth curves represent when ICT was administered. (c, d) Change in TCRβ repertoire diversity in sequential blood samples from individual animals, represented by Shannon’s diversity indices. (e) Circos plots represent the distribution of most abundant clones across 3 timepoints. Each colored trine represents one time point, and connecting bands represent individual TCRβ clones. The width of each band connecting the trines depicts the frequency of that clone at both time points. (f) Number of persistent and abundant TCRβ clones, defined as any TCRβ clones that ranked top 100 in abundance at more than 1 timepoint. All analysis was performed on down-sampled data to ensure that repertoire sizes were similar. One-way ANOVA with Kruskal-Wallis tests were used to compare between groups at each time-point. One-way ANOVA with Friedman tests were used to compare TCRβ repertoires in individual animals over time. *p < 0.05.
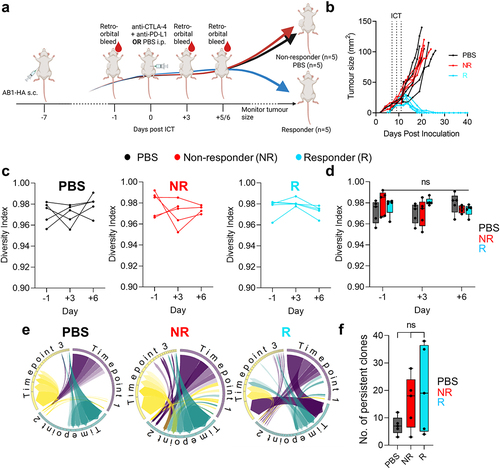
Figure 2. Bilateral tumors have highly similar TCRβ repertoires. (a) Experimental timeline, and (b) Tumor growth of PBS (black) and ICT (anti-CTLA-4 + anti-OX-40, red) treated AB1-HA bearing animals. Dotted lines represent treatment. Animals were euthanized so that tumors were size matched (n = 6/group). (c) Number of total and unique TCRβ clones derived from bulk TCRβ sequencing of sorted CD4+ (filled triangles) and CD8+ (filled circles) TILs from ICT (red) and PBS (black) treated animals (d) Morisita-Horn Overlap index values comparing down-sampled TCRβ repertoires of bilateral tumors within animals (n = 6 pairwise comparisons), or tumors between different animals (n = 60 comparisons). CD4+ and CD8+ TILs, ICT treatment plotted. All dot plots represent mean ± SEM. Mann-Whitney test used to compare different treatment groups. *p < 0.05, ***p < 0.005.
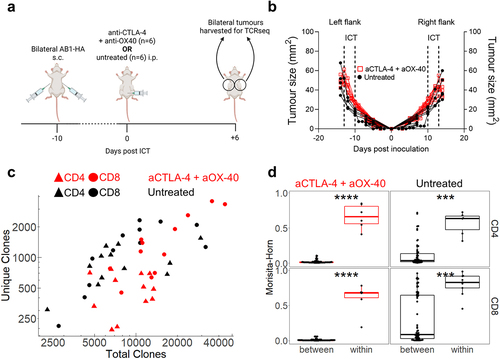
Figure 3. ICT responders display clonal expansion of unique tumor TCRβs earlier than non-responding mice. (a) Mice with bilateral AB1 or RENCA murine tumors were administered anti-CTLA-4 and anti-PD-L1 ICT. Each group had right flank tumors surgically excised before ICT, or every two days after ICT. 8 mice for each response group at each time point in each model, with the exception of day + 6 group in RENCA model (n = 6). (b) Number of total and unique TCRβ clones in tumors from responding (blue) and non-responding (red) mice across 4 timepoints. (c) TCRβ clones were ranked on their abundance within each tumor repertoire, and proportions of ranked TCRβs were plotted in relation to time and response. (d) Tumour TCRβ diversity represented by a normalized Shannon’s index in responding or non-responding mice. Higher indices indicate a more diverse repertoire and lower values correspond to more clonal repertoires. (e) Tumour TCRβ diversity represented by a Gini index in responding or non-responding mice. Gini index is more sensitive to high abundance clones, values close to 1 represent higher diversity and values closer to 0 represent lower diversity. (f) The number of large TCRβ clones (occupying >0.5% of each repertoire) compared between ICT response, and tumor models across time. All graphs from C to F display analyses performed on down-sampled data. All box plots depict mean ± SEM of individual animals, n = 6–8 mice/group. Mann-whitney test used to compare diversity index between responders vs non-responders, with Holm-Bonferroni method used to correct for multiple comparisons. *p < 0.05, ***p < 0.005, ****p < 0.001.
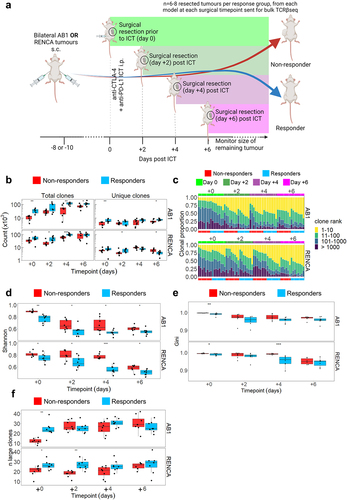
Figure 4. ICT response-related signatures can be trained from selected timepoints. (a) Schematic of DeepTCR classification of tumor TCRβs into ICT response and tumor model-related signatures (b) Unsupervised classification all unique TCRβ sequences in both models reduced data to 87 clusters. Multi-dimensional scaling plot of overall cluster expression, each dot represents one animal. AB1 (orange) or RENCA (blue) tumors overlayed in color; (c) ROC curve depicting how DeepTCR classified tumor-related signatures trained from day 0 samples are predictive of AB1 and RENCA tumor models when applied to remaining samples. (d, e) Modelling of tumor-related signatures, or (f, g) ICT-response-related signatures in samples over time, responders (blue, R) versus non-responders (red, R). Y-axis depicts weighted proportion of tumor-related signature in each sample. Mean±SEM depicted for each bar graph. n = 6–8 mice per group. Kruskal Wallis tests with multiple comparisons used to compare between timepoints. Multiple Mann-Whitney tests used to compare between responder and non-responder groups at individual timepoints. *p < 0.05, ***p < 0.0005.
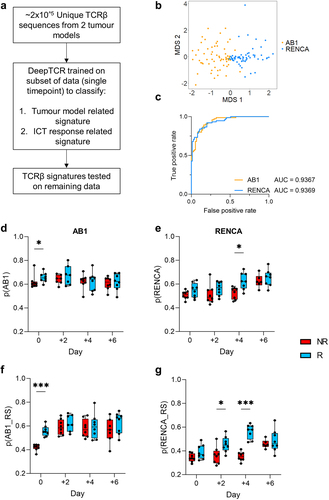
Figure 5. Clonally expanded CD8+ TILs have displayed an effector and progenitor exhausted phenotype. (a) Experimental schematic for single cell experiment (b) AB1 tumor growth curves of ICT (anti-CTLA-4 + anti-PD-L1) treated animals (n = 3/group). Dotted lines on growth curves represent when ICT was administered. CD45+ T cells from right flank tumor excised 6 days post ICT sent for single cell analysis. (c) TSNE clustering of all 18,029 cells, labeled by color and cell type. (d) GSEA plot depicting significant enrichment of an effector T cell signature in CD8+ large clones from responding tumors, (e) Enrichment of T cell exhaustion signature in CD8+ T cells from non-responding tumors. Negative NES indicates enrichment in non-responders. (f) Experimental schematic for flow cytometry experiment in AB1-HA bearing animals with HA-specific, CL4 TCRβ transgenic (CD8+Thy1.1+) T cells. (g) AB1-HA tumor growth curves of ICT (anti-CTLA-4 + anti-PD-L1) treated animals (n = 6–8/group). (h) Frequencies of HA-specific (CD8+Thy1.1+) and endogenous (CD8+Thy1.1−) TILs, (i) frequencies of effector (SLAMF6−PD-1+), progenitor exhausted (SLAMF6−PD-1+) HA-specific (CD8+Thy1.1+) TILs, and (j) MFI of inhibitory receptor expression on HA-specific (CD8+Thy1.1+) TILs in responding and non-responding tumors. Mann-Whitney tests used to compare between responder and non-responder groups at individual timepoints. *p < 0.05, ***p < 0.0005.
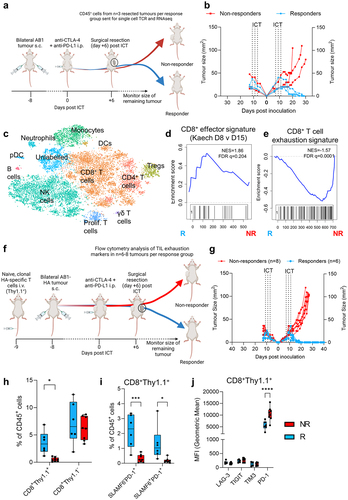
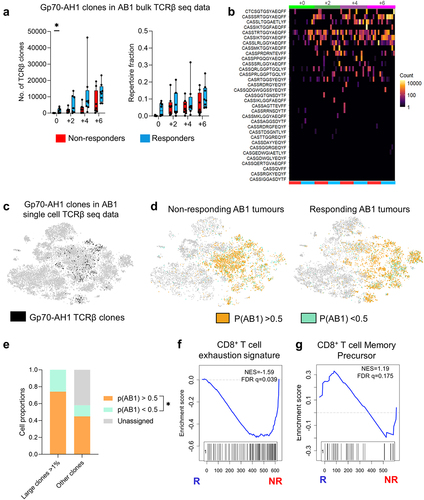
Figure 6. Tumor antigen-specific TCRβ clonotypes increase earlier in time in ICT responders. (a) The number, and proportion of gp70-AH1 associated TCRβ clones in ICT responding and non-responding AB1 tumors across time. (b) The distribution of each gp70-AH1 associated TCRβ clone across individual animals represented as a heatmap. Each rectangle on the heatmap represents an individual animal at a particular time points, and ICT response. (c) The number of cells with gp70-AH1 antigen specific TCRβ clonotypes in the single cell dataset, with (d) p(AB1) high (>0.5) and low (<0.5) cells depicted on a tSNE plot from single cell analysis of day 6 ICT. (e) Proportion of large or other clones that have TCRβs with either p(AB1) high and low scores. (f,g) GSEA plots depicting enrichment of T cell exhaustion or memory precursor gene signatures in pAB1 high cells, responders vs non-responders. Positive NES indicates enrichment in responders. Kruskal Wallis tests were used to compare between timepoints. Multiple mann-whitney tests were used to compare between responder and non-responder groups. All tests were adjusted for multiple comparisons with a false discovery rate of 0.1. *q < 0.05. Friedman tests were used to compare cell populations from matched samples. *p < 0.05.