
Figures & data
Figure 1. Exposure of an in vitro model of human blood-brain barrier, consisting of brain microvascular endothelial cells, astrocytes and pericytes, to hyperglycemia (HG) for 24–72 h led to significant impairments in barrier integrity (a) compared to those exposed to normoglycaemia (NG) and D-mannitol. Although no differences were observed in paracellular flux of high molecular weight marker EBA across different experimental groups (b), the flux of low molecular weight marker sodium fluorescein (NaF) was higher (c) in HG group compared to both NG and D-mannitol groups. Data are expressed as mean±SEM from six independent experiments. ***p < 0.001 compared to HG group.
Figure 2. Treatment of human brain microvascular endothelial cells with high glucose (HG) leads to disappearance of tight junction protein, zonula occludens-1 from plasma membrane (a) and increases actin stress fiber formation in a time-dependent manner (b-c) compared to cells subjected to normoglycaemia (NG) or equimolar concentrations of D-mannitol. Scale bars: 100 μm for ZO-1 and 20 μm for actin microfilament staining. All images were captured using 20× magnification. ****p < 0.001 compared to HG group.
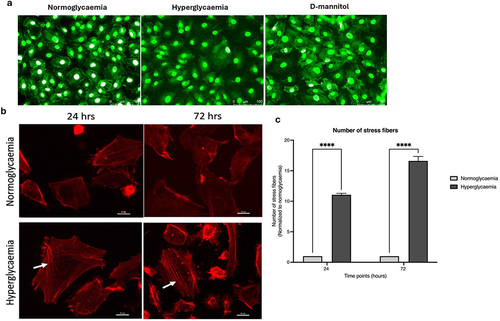
Figure 3. Human brain microvascular endothelial cells subjected to hyperglycemia (HG), normoglycaemia (NG) or D-mannitol did not show significant difference in their angiogenic capacity as evidenced by similarities in morphology (a), the number of junctions (b), number of branching points (c), mesh area (d), total length (e) and total segment length (f). Data are expressed as mean±SEM from six independent experiments. The tubules were visualized using 10× magnification.
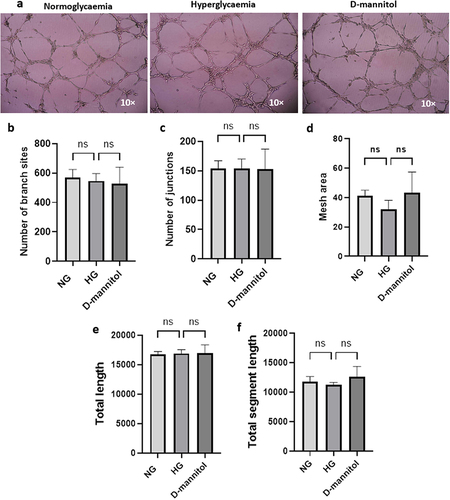
Figure 4. Analysis of angiogenic factors in human brain microvascular endothelial cells subjected to hyperglycemia (HG) or normoglycaemia (NG) revealed significant alterations in the levels of angiogenin, endothelin-1, basic fibroblast growth factor (bFGF), interleukin-8 (IL-8) and placental GF (PlGF) but not angiopoietin-2 (ang-2) and vascular endothelial GF (VEGF). Data are expressed as mean±SEM from three independent experiments. **p < 0.01 compared to HG group. ***p < 0.001 compared to HG group.
Figure 5. Analysis of cytokine profile in pericytes subjected to secretome obtained from human brain microvascular endothelial cells treated with hyperglycemia (HG) or normoglycaemia (NG) revealed significant alterations in the levels of monocyte chemoattractant protein-1 (MCP-1), intercellular adhesion molecule-1 (ICAM-1), interleukin-8 (IL8) and macrophage migration inhibitory factor (MIF) but not growth regulated oncogene-beta (GRO), IL6 and serpin. Data are expressed as mean±SEM from three independent experiments. ***p < 0.001 compared to HG group.
Data availability statement
The datasets used and analyzed during the current study are available from the corresponding author on reasonable request.