1,365
Views
6
CrossRef citations to date
0
Altmetric
Research Paper

Class II members of the poly(A) binding protein family exhibit distinct functions during Arabidopsis growth and development

ORCID Icon
Article: e1295129 | Received 15 Dec 2016, Accepted 09 Feb 2017, Published online: 02 Mar 2017

Figures & data

Figure 1. Mutants with altered expression of the widely-expressed class II PABP isoforms. (A) Gene structure and location of the T-DNA insertion in PAB2, PAB4, and PAB8 genes. Bars indicate exons and bent lines indicate introns. The location of the T-DNA insertion in each class II PABP member is indicated by the arrow head. (B) Western analysis of class II single and double PABP mutants to detect PABP (top panel) and eIF4A (bottom panel). PAB4 and PAB8 comigrate whereas PAB2 migrates just below.
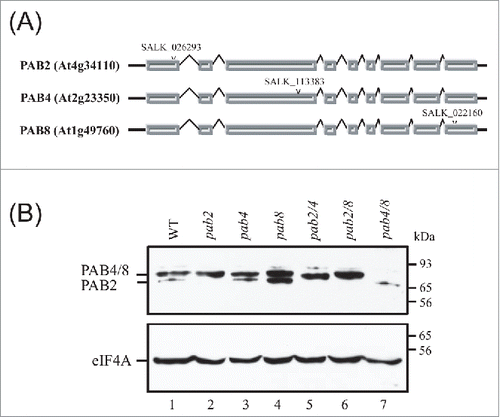
Figure 1. Mutants with altered expression of the widely-expressed class II PABP isoforms. (A) Gene structure and location of the T-DNA insertion in PAB2, PAB4, and PAB8 genes. Bars indicate exons and bent lines indicate introns. The location of the T-DNA insertion in each class II PABP member is indicated by the arrow head. (B) Western analysis of class II single and double PABP mutants to detect PABP (top panel) and eIF4A (bottom panel). PAB4 and PAB8 comigrate whereas PAB2 migrates just below.

Figure 2. Growth characteristics of pab mutants. (A) Growth of class II single and double PABP mutants at 3.5 weeks just before the appearance of the inflorescence relative to wild-type plants. (B) All leaves from adult wild-type and mutant plants at the appearance of the inflorescence. (C) Mature siliques from adult wild-type and mutant plants.
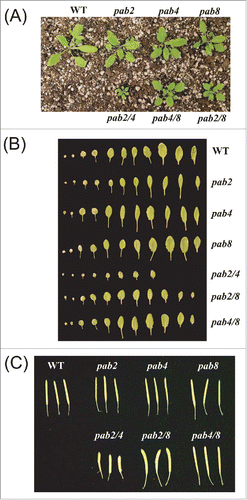
Figure 2. Growth characteristics of pab mutants. (A) Growth of class II single and double PABP mutants at 3.5 weeks just before the appearance of the inflorescence relative to wild-type plants. (B) All leaves from adult wild-type and mutant plants at the appearance of the inflorescence. (C) Mature siliques from adult wild-type and mutant plants.

Figure 3. The effect of pab mutants on inflorescence growth. Flowering wild-type and class II PABP mutant plants with the inflorescence displayed.
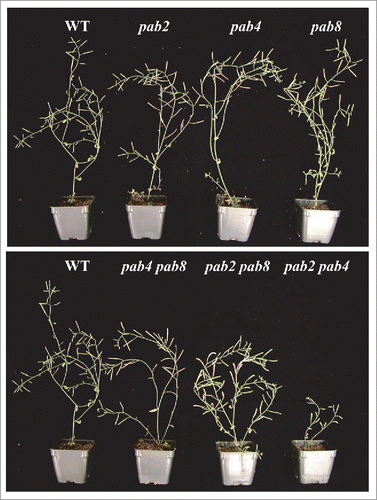
Figure 3. The effect of pab mutants on inflorescence growth. Flowering wild-type and class II PABP mutant plants with the inflorescence displayed.

Figure 4. Flower, silique, and embryo development of pab mutants. Flowers (top panels) and dissected siliques (bottom panels) showing developing embryos are shown for wild-type and class II PABP mutants. Bar represents 5 mm.
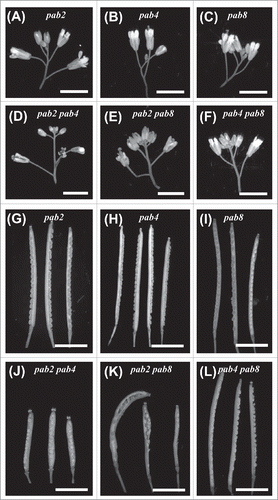
Figure 4. Flower, silique, and embryo development of pab mutants. Flowers (top panels) and dissected siliques (bottom panels) showing developing embryos are shown for wild-type and class II PABP mutants. Bar represents 5 mm.

Table 1. Requirement for class II PABP members during seed development.

Figure 5. Flower, silique, and embryo development of heterozygous pab mutants. Flowers (top panels) and dissected siliques (bottom panels) showing developing embryos are shown for wild-type and heterozygous class II PABP mutants. Bar represents 5 mm.
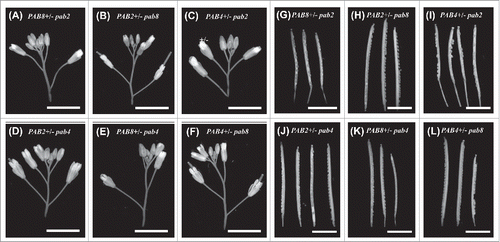
Figure 5. Flower, silique, and embryo development of heterozygous pab mutants. Flowers (top panels) and dissected siliques (bottom panels) showing developing embryos are shown for wild-type and heterozygous class II PABP mutants. Bar represents 5 mm.

Table 2. Effect of heterozygous class II PABP members during seed development.

Table 3. Class II PABP members negatively regulate root growth.

Table 4. Class II PABP members are required to support expression from Luc mRNA.

Table 5. Class II PABP members are required to support Luc transcript level.

Table 6. Class II PABP members are required to support expression from Ω-Luc mRNA.

Table 7. Class II PABP members are required to support W-Luc transcript level.

Figure 6. Expression from class II PABP genes in class II PABP mutants. qPCR was performed for PAB2 (black bars), PAB4 (gray bars), and PAB8 (white bars) in 8 day old WT seedlings and class II PABP mutants. Expression for each gene is reported relative to the level in WT seedlings which is set at a value of 1.
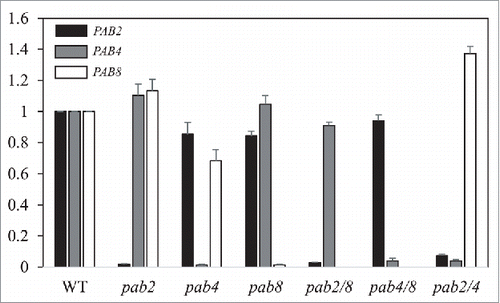
Figure 6. Expression from class II PABP genes in class II PABP mutants. qPCR was performed for PAB2 (black bars), PAB4 (gray bars), and PAB8 (white bars) in 8 day old WT seedlings and class II PABP mutants. Expression for each gene is reported relative to the level in WT seedlings which is set at a value of 1.

Reprints and Corporate Permissions

Please note: Selecting permissions does not provide access to the full text of the article, please see our help page How do I view content?

To request a reprint or corporate permissions for this article, please click on the relevant link below:

Academic Permissions

Please note: Selecting permissions does not provide access to the full text of the article, please see our help page How do I view content?

Obtain permissions instantly via Rightslink by clicking on the button below:

If you are unable to obtain permissions via Rightslink, please complete and submit this Permissions form. For more information, please visit our Permissions help page.