2,282
Views
12
CrossRef citations to date
0
Altmetric
Research Paper

Regulation of gene expression by translation factor eIF5A: Hypusine-modified eIF5A enhances nonsense-mediated mRNA decay in human cells

ORCID Icon, ORCID Icon, ORCID Icon, ORCID Icon, ORCID Icon, ORCID Icon, ORCID Icon, ORCID Icon, ORCID Icon, ORCID Icon & ORCID Icon show all
Article: e1366294 | Received 13 Jun 2017, Accepted 07 Aug 2017, Published online: 28 Sep 2017

Figures & data

Figure 1. Effects of drugs and eIF5A hypusination on reporter gene expression. (A) Pathway of hypusine formation. The ϵ-amino group of eIF5A Lys-50 (in the human protein) is substituted by a spermidine-derived 4-aminobutyl moiety in a NAD+-dependent reaction catalyzed by DHS. The aminobutyl portion of the deoxyhypusine residue is then hydroxylated by DOHH using O2. DOHH is inhibited by the drugs ciclopirox (CPX) and deferiprone (DEF). (B) Diagrams of plasmids pLTR-FF and pGL2TAR and its deleted derivatives, containing the HIV-1 LTR promoter (hatched), firefly luciferase (FF) coding sequence (brown), and 3′UTRs harboring different SV40 polyadenylation signals (PAS) derived from the vectors pGL2 and pGL3. pLTR-FF contains the SV40 late PAS (blue, stippled) which is devoid of an intron. pGL2TAR contains the SV40 early PAS (open) with a small T intron sequence (red) located 246 nt downstream of the FF luciferase stop codon. In pGL2TARΔ1, the small T intron has been excised. In pGL2TARΔ2, the separation between the FF luciferase stop codon and small T intron sequence is reduced to 43 nt. Arrow: transcription direction. (C) Effect of CPX and DEF on reporter gene expression in 293T cells transfected with pGL2TAR or pLTR-FF. FF activities were normalized to Renilla luciferase expression from the co-transfected pCMV-Ren plasmid and are plotted relative to control cells not treated with drugs. (D) Firefly (FF) and Renilla (Ren) luciferase RNA in 293T cells co-transfected with pGL2TAR or pLTR-FF and pCMV-Ren assayed by RNase protection. (E) Expression from pGL2TAR, pGL2TARΔ1 (Δ1), pGL2TARΔ2 (Δ2), and pLTR-FF in 293T cells. Relative luciferase activity (FF/Ren) is plotted relative to pGL2TAR. (F) Effect of wild-type (WT) or dominant-negative mutant (DN) forms of Upf1 on expression from pGL2TAR and pGL2TARΔ1 in 293T cells. Relative luciferase activity (FF/Ren) is plotted relative to controls transfected with empty vector (V) instead of Upf1 vector. Inset: immunoblot probed for Upf1 protein.
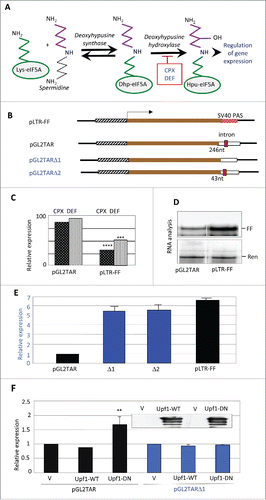
Figure 1. Effects of drugs and eIF5A hypusination on reporter gene expression. (A) Pathway of hypusine formation. The ϵ-amino group of eIF5A Lys-50 (in the human protein) is substituted by a spermidine-derived 4-aminobutyl moiety in a NAD+-dependent reaction catalyzed by DHS. The aminobutyl portion of the deoxyhypusine residue is then hydroxylated by DOHH using O2. DOHH is inhibited by the drugs ciclopirox (CPX) and deferiprone (DEF). (B) Diagrams of plasmids pLTR-FF and pGL2TAR and its deleted derivatives, containing the HIV-1 LTR promoter (hatched), firefly luciferase (FF) coding sequence (brown), and 3′UTRs harboring different SV40 polyadenylation signals (PAS) derived from the vectors pGL2 and pGL3. pLTR-FF contains the SV40 late PAS (blue, stippled) which is devoid of an intron. pGL2TAR contains the SV40 early PAS (open) with a small T intron sequence (red) located 246 nt downstream of the FF luciferase stop codon. In pGL2TARΔ1, the small T intron has been excised. In pGL2TARΔ2, the separation between the FF luciferase stop codon and small T intron sequence is reduced to 43 nt. Arrow: transcription direction. (C) Effect of CPX and DEF on reporter gene expression in 293T cells transfected with pGL2TAR or pLTR-FF. FF activities were normalized to Renilla luciferase expression from the co-transfected pCMV-Ren plasmid and are plotted relative to control cells not treated with drugs. (D) Firefly (FF) and Renilla (Ren) luciferase RNA in 293T cells co-transfected with pGL2TAR or pLTR-FF and pCMV-Ren assayed by RNase protection. (E) Expression from pGL2TAR, pGL2TARΔ1 (Δ1), pGL2TARΔ2 (Δ2), and pLTR-FF in 293T cells. Relative luciferase activity (FF/Ren) is plotted relative to pGL2TAR. (F) Effect of wild-type (WT) or dominant-negative mutant (DN) forms of Upf1 on expression from pGL2TAR and pGL2TARΔ1 in 293T cells. Relative luciferase activity (FF/Ren) is plotted relative to controls transfected with empty vector (V) instead of Upf1 vector. Inset: immunoblot probed for Upf1 protein.

Figure 2. Hypusinated eIF5A participates in NMD in human cells. (A) Structure of NMD-sensitive expression construct Rluc-Gl Ter containing the Renilla luciferase gene (RLuc, open rectangle) fused in frame at its 3′ end to three exons of the human β-globin gene (Gl, filled rectangles), the second of which harbors a PTC at position 39. (B, C): Effect of siRNA directed against eIF5A1 (5A), Upf1, DHS or DOHH on expression from pGL2TAR (left) or Rluc-Gl Ter (right) in HeLa cells with co-transfected pCMV-Ren and pCMV-FF, respectively. Relative luciferase activity (FF/Ren, left; Ren/FF, right) is plotted relative to expression transfected with control siRNA (siC). (D) Effect of the drugs DEF and CPX at concentrations indicated on expression from RLuc-Gl Ter. Relative luciferase activity (Ren/FF) is plotted relative to expression in the absence of drug. (E) Effect of drugs on Renilla luciferase RNA measured in Northern blots. Data is mean of three independent experiments presented as a ratio of expression from RLuc-Gl Ter (NMD sensitive) relative to the normal construct, RLuc-Gl Norm. *, p < 0.05.
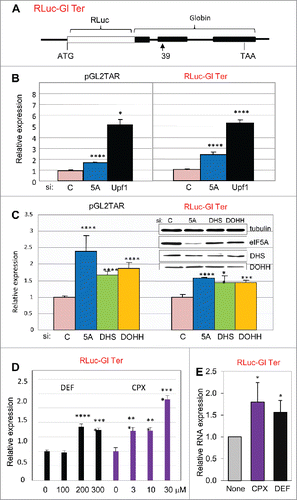
Figure 2. Hypusinated eIF5A participates in NMD in human cells. (A) Structure of NMD-sensitive expression construct Rluc-Gl Ter containing the Renilla luciferase gene (RLuc, open rectangle) fused in frame at its 3′ end to three exons of the human β-globin gene (Gl, filled rectangles), the second of which harbors a PTC at position 39. (B, C): Effect of siRNA directed against eIF5A1 (5A), Upf1, DHS or DOHH on expression from pGL2TAR (left) or Rluc-Gl Ter (right) in HeLa cells with co-transfected pCMV-Ren and pCMV-FF, respectively. Relative luciferase activity (FF/Ren, left; Ren/FF, right) is plotted relative to expression transfected with control siRNA (siC). (D) Effect of the drugs DEF and CPX at concentrations indicated on expression from RLuc-Gl Ter. Relative luciferase activity (Ren/FF) is plotted relative to expression in the absence of drug. (E) Effect of drugs on Renilla luciferase RNA measured in Northern blots. Data is mean of three independent experiments presented as a ratio of expression from RLuc-Gl Ter (NMD sensitive) relative to the normal construct, RLuc-Gl Norm. *, p < 0.05.

Figure 3. Effects of eIF5A and hypusination on the expression of cellular genes. (A) Flowchart of RNA sequencing analysis. (B) Clustering of genes and samples using gene expression changes. RNA expression changes of 8,690 genes that exhibited significant change relative to siC (t-test, p < 0.05 in at least one condition) are shown on a log2 scale with heatmap values displayed below. Hierarchical clustering was applied based on Pearson correlation and the average linkage method. (C) Scatter plots showing two-way correlations between the effects of eIF5A1, DHS and DOHH knockdowns on gene expression. Fold changes (>1.2, Fisher's exact test p < 0.001) are displayed on a log2 scale and Pearson r values are shown.
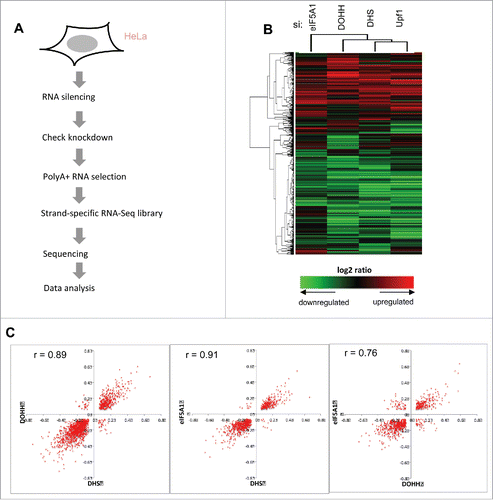
Figure 3. Effects of eIF5A and hypusination on the expression of cellular genes. (A) Flowchart of RNA sequencing analysis. (B) Clustering of genes and samples using gene expression changes. RNA expression changes of 8,690 genes that exhibited significant change relative to siC (t-test, p < 0.05 in at least one condition) are shown on a log2 scale with heatmap values displayed below. Hierarchical clustering was applied based on Pearson correlation and the average linkage method. (C) Scatter plots showing two-way correlations between the effects of eIF5A1, DHS and DOHH knockdowns on gene expression. Fold changes (>1.2, Fisher's exact test p < 0.001) are displayed on a log2 scale and Pearson r values are shown.

Figure 4. Coordinate effects of Upf1 and the eIF5A pathway on human gene expression. (A) Venn diagrams displaying the number of genes whose expression changed significantly (fold change >1.2, Fisher's exact test p < 0.001) in HeLa cells depleted for eIF5A1, DHS, DOHH and Upf1 in comparison with siC-treated cells. (B) Scatter plots showing the distribution of genes whose expression was significantly up- or down-regulated by knockdown of Upf1 compared with eIF5A1 (left), DHS (middle) or DOHH (right). Parameters are as in . (C) GO analysis of genes up-regulated by knockdown of Upf1, eIF5A1, DHS or DOHH. The p-values are plotted for each term.
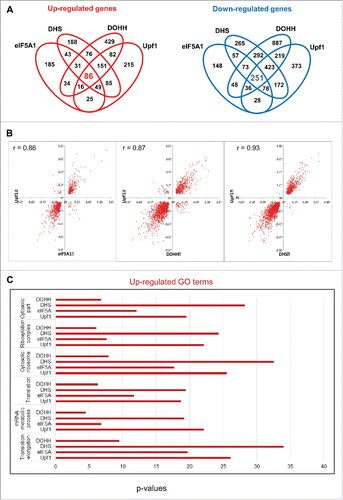
Figure 4. Coordinate effects of Upf1 and the eIF5A pathway on human gene expression. (A) Venn diagrams displaying the number of genes whose expression changed significantly (fold change >1.2, Fisher's exact test p < 0.001) in HeLa cells depleted for eIF5A1, DHS, DOHH and Upf1 in comparison with siC-treated cells. (B) Scatter plots showing the distribution of genes whose expression was significantly up- or down-regulated by knockdown of Upf1 compared with eIF5A1 (left), DHS (middle) or DOHH (right). Parameters are as in Figure 3C. (C) GO analysis of genes up-regulated by knockdown of Upf1, eIF5A1, DHS or DOHH. The p-values are plotted for each term.

Figure 5. Up-regulation of cellular transcripts by depletion of Upf1 or eIF5A pathway genes. (A) Gene transcripts significantly up-regulated in RNA-Seq analysis by Upf1 knockdown (total 709) that were also up-regulated by knockdown of eIF5A1, DHS or DOHH singly or in combinations. (B) qPCR analysis showing up-regulation of 10 gene transcripts in cells depleted for eIF5A1, DHS, DOHH or Upf1. Data are normalized to siC-treated cells. Standard deviations are included but are too small to be readily visible; p-values were <0.01, and mostly <0.001, except where marked #. The genes were selected on the basis of their up-regulation in RNA-Seq analysis (see text for details).
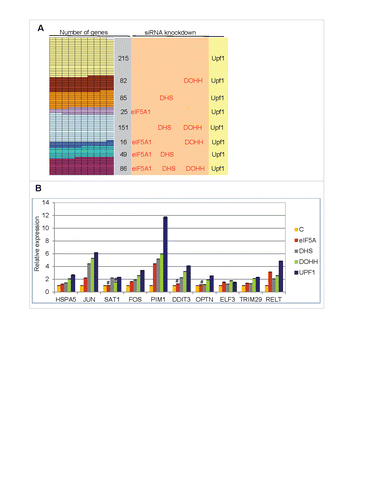
Figure 5. Up-regulation of cellular transcripts by depletion of Upf1 or eIF5A pathway genes. (A) Gene transcripts significantly up-regulated in RNA-Seq analysis by Upf1 knockdown (total 709) that were also up-regulated by knockdown of eIF5A1, DHS or DOHH singly or in combinations. (B) qPCR analysis showing up-regulation of 10 gene transcripts in cells depleted for eIF5A1, DHS, DOHH or Upf1. Data are normalized to siC-treated cells. Standard deviations are included but are too small to be readily visible; p-values were <0.01, and mostly <0.001, except where marked #. The genes were selected on the basis of their up-regulation in RNA-Seq analysis (see text for details).

Table 1. Up-regulated transcripts encoding components of the translation systemFootnote1

Figure 6. Alternative splicing-coupled NMD of ribosomal protein genes. (A) Scatter plot for genes in the “cytosolic ribosome” GO category, displaying co-regulation of transcripts by knockdown of Upf1 and by knockdown of eIF5A1, DHS or DOHH. Parameters are as in (note log scale). (B) Evidence for AS-NMD in RPS3 transcripts. Isoform expression in control and knockdown samples was analyzed by the MISO method, where Ψ represents the fraction of transcripts containing exon 5. Histograms show Ψ value distributions (abscissa, Ψ value; ordinate, percent frequency) with 95% confidence intervals (dotted lines). The Ψ values are listed together with 95% confidence intervals (square brackets). Bayes factors were >1012 in all samples except for the eIF5A1 knockdown (not shown). Diagrams below illustrate the alternatively spliced junctions detected (top) and corresponding RNA isoforms (bottom). Exons and introns are depicted as boxes and lines, respectively; filled and open boxes depict translated and untranslated sequences, respectively.
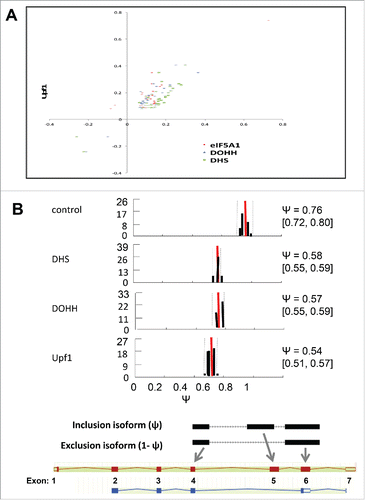
Figure 6. Alternative splicing-coupled NMD of ribosomal protein genes. (A) Scatter plot for genes in the “cytosolic ribosome” GO category, displaying co-regulation of transcripts by knockdown of Upf1 and by knockdown of eIF5A1, DHS or DOHH. Parameters are as in Figure 3C (note log scale). (B) Evidence for AS-NMD in RPS3 transcripts. Isoform expression in control and knockdown samples was analyzed by the MISO method, where Ψ represents the fraction of transcripts containing exon 5. Histograms show Ψ value distributions (abscissa, Ψ value; ordinate, percent frequency) with 95% confidence intervals (dotted lines). The Ψ values are listed together with 95% confidence intervals (square brackets). Bayes factors were >1012 in all samples except for the eIF5A1 knockdown (not shown). Diagrams below illustrate the alternatively spliced junctions detected (top) and corresponding RNA isoforms (bottom). Exons and introns are depicted as boxes and lines, respectively; filled and open boxes depict translated and untranslated sequences, respectively.
Supplemental material

KTRS_S_1366294.zip

Download Zip (3.7 MB)

Reprints and Corporate Permissions

Please note: Selecting permissions does not provide access to the full text of the article, please see our help page How do I view content?

To request a reprint or corporate permissions for this article, please click on the relevant link below:

Academic Permissions

Please note: Selecting permissions does not provide access to the full text of the article, please see our help page How do I view content?

Obtain permissions instantly via Rightslink by clicking on the button below:

If you are unable to obtain permissions via Rightslink, please complete and submit this Permissions form. For more information, please visit our Permissions help page.