Figures & data
Figure 1. The study area (blue) and sample plots (red). Bottom-left, the density distribution of the CO2 equivalent in the 20 plots measured on the ground.
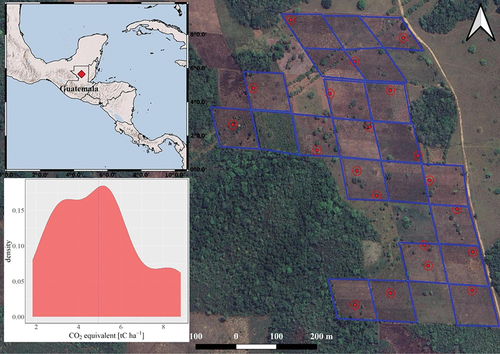
Table 1. Parameters used in the different strategies by progressively increasing the level of plantation knowledge. The FI model requires the information available for user d. The information available for users a, b, and c are used to obtain the information available for user d as detailed below.
Table 2. Parameters for estimating the diameter of switenia macrophylla and cedrela odorata (INB, Citation2019a, Citation2019b).
Table 3. Data used for the different strategies by progressively increasing the level of plantation knowledge and thus of information available to calculate the parameters required by the FI approach: min, mean, and max CO2 equivalent in the plantation. User d is not reported as it is the benchmark in which min, mean, and max CO2 equivalent in the plantation are known.
Table 4. Comparison of the results achieved using the DB, MA, and FI carbon mapping and estimation methods. For the DB estimation methods RMSE% and r2 are not available as it provides just estimates and not maps. For the FIs methods, confidence intervals are not available as they are based just on remote sensing data, and reference data is not used.
Figure 2. Top, map of CO2 equivalent obtained with FI method with different CO2 equivalent ranges (MgC ha−1) depending on the FI case. Bottom, map of CO2 equivalent obtained with the MA method. Empty pixels correspond to outliers and were masked out.
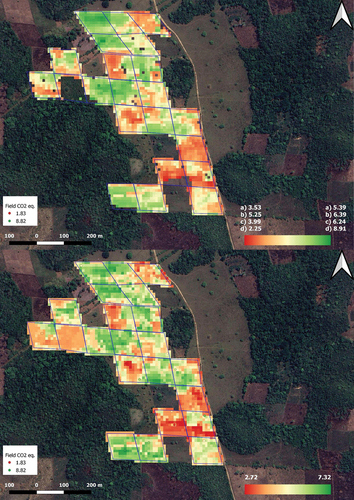
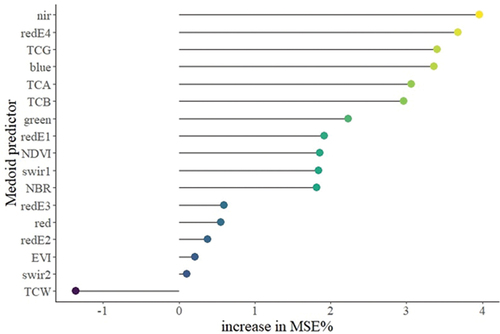
Figure 3. Medoid predictors’ importance assessment in terms of mean square error percentage increase.