
Figures & data
Figure 1. Economic Growth in Korea before and after the 1997 Crisis.
Source: Bank of Korea.
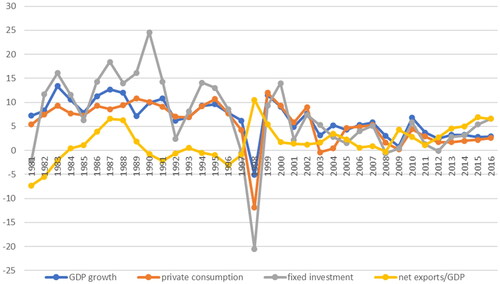
Figure 2. Exports to China and Trade Balance with China.
Source: Korea Customs Service
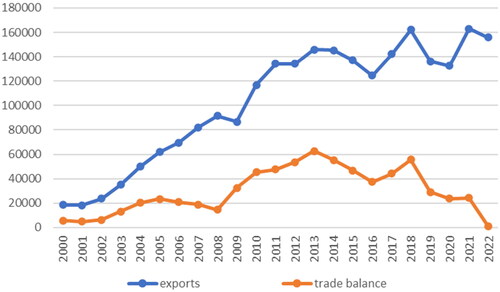
Figure 3. The share of export and net export as a percentage of GDP (%).
Source: Bank of Korea.
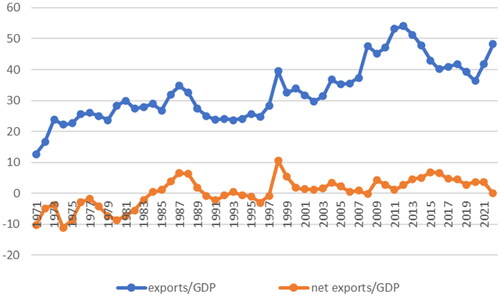
Figure 4. The Share of Components of GDP in Korea.
Source: Bank of Korea.
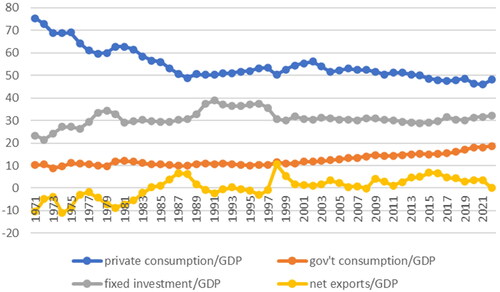
Figure 5. The Gini coefficients in Korea.
Source: Statistics Korea.
Note: This is from the Household Income and Expenditure Survey.
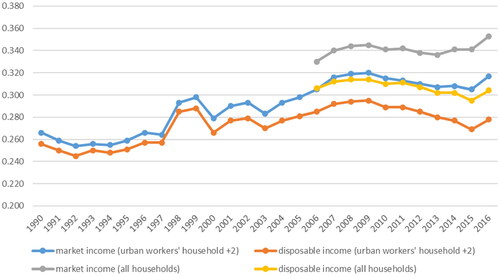
Figure 6. Gini coefficients in Korea after the Moon government.
Source: Statistics Korea.
Note: This is based on the Survey of Household Finances and Living Conditions.
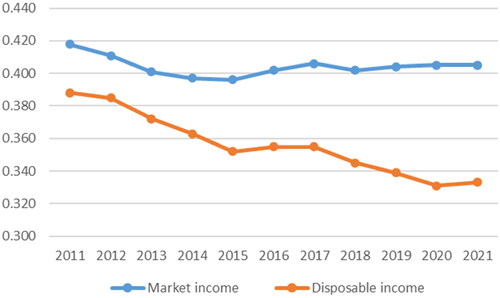
Figure 7. Adjusted Wage Share in Korea.
Source: Bank of Korea, calculated by the author.
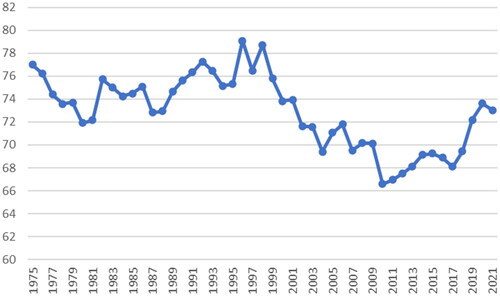
Figure 8. Economic Growth in Korea in the Recent Period.
Source: Bank of Korea.
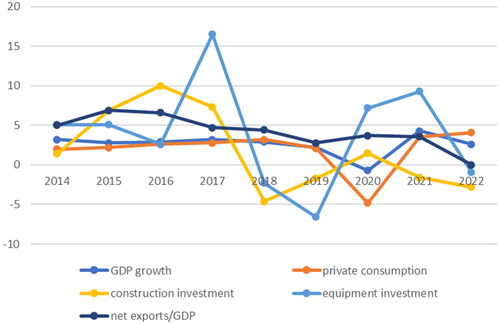
Figure 9. Government Structural Balance as a Percentage of Potential GDP.
Source: World Economic Outlook Database, March 2023, IMF.
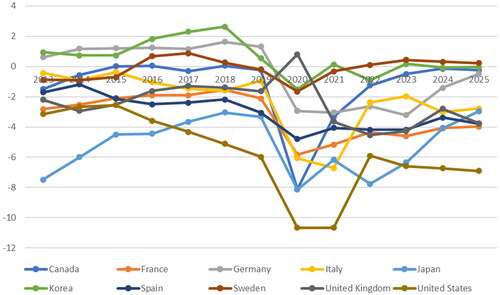
Figure 10. Growth Rates of Export in Korea.
Source: Korea Customs Service.
Note: compared with the previous year.
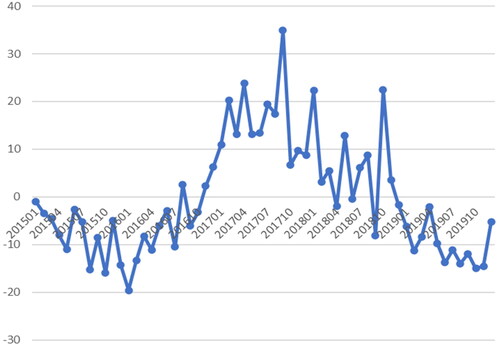
Figure 11. Trade balance in Korea 1) Total Trade Balance in Korea ($0.1 billion) 2) Trade balance with China ($million).
Source: Korea Customs Service.
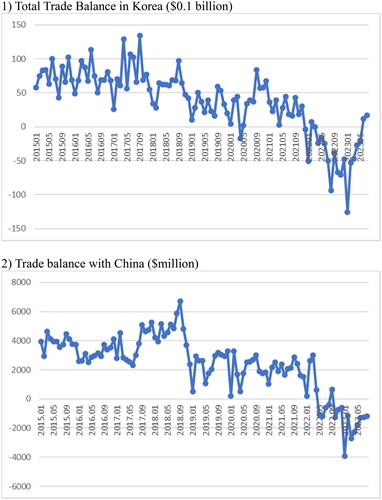
Table 1. Exports to China and its share in all exports ($0.1 billion, %).