
Figures & data
Figure 1. Evolving perceptions of resilience within the engineering, ecological and social sciences during the last 50+ years and historical milestones (papers, reports, alliances, networks, programmes, policies).
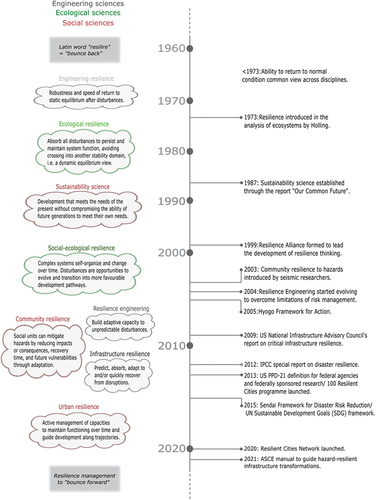
Figure 2. Design strategies of risk management and concepts of resilience, derived from comparison to the fundamental resilient water system capabilities defined by Shin, Lee, Judi, et al. (Citation2018). Outer circles indicate which capabilities are covered, illustrating overlap with and extension beyond conventional risk management.
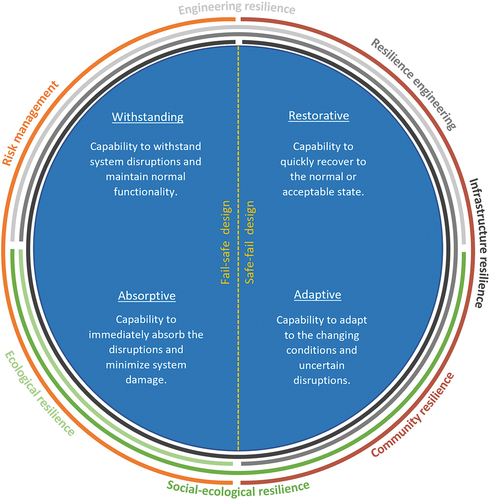
Figure 3. Resilience framework showing levels of performance when the system is exposed to disruptions, the related design dimensions and contributing capabilities, and the linkage with sustainable development through system transformation.
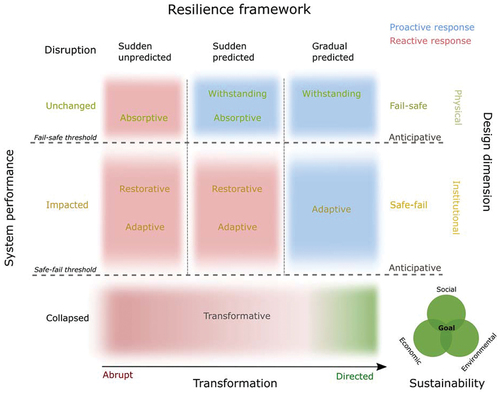
Table 1. Essential capabilities (WARATA) and their toolkit in practice for providing resilient system performance.
Figure 4. Conceptual system performance curve when exposed to a sudden disruption. a) No impact from predicted disruption. b) Impact from predicted disruption. c) Impact from unpredicted disruption.
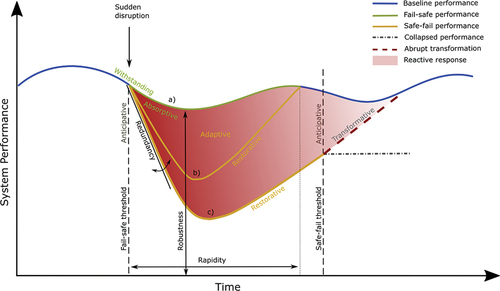
Figure 5. Conceptual system performance curve when facing a predicted gradual disruption. Magnification of sudden disruption included to illustrate time scales, and of critical safe-fail threshold to show details.
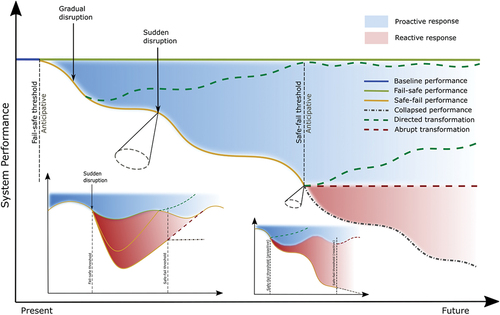
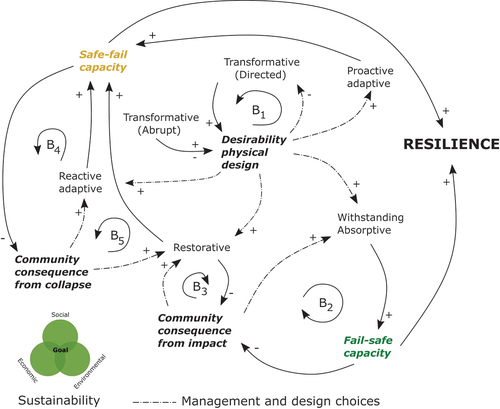
Figure 6. Causal loop diagram showing relationships (all arrows) between variables related to sustainability goals, system capabilities, capacities, and level of resilience. Positive (+) and negative (-) relationships, and balancing feedback loops (B). Management and design choices (dashed arrows) in a sustainability decision-making context.
Data availability statement
The authors confirm that the data supporting the findings of this study are available within the article.