Figures & data
Figure 1. To meet the Paris goal and limit warming to 1.5–2 °C would require a rapid decrease in carbon emissions – a much deeper transition than proposed by the Nationally Determined Contributions (NDCs). Source: IPCC (Citation2023)
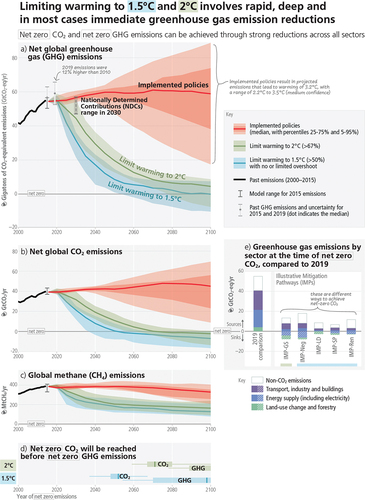
Figure 2. The four Systemic Cycles of Accumulation (SCA) in the history of capitalism, noting our present position. Source: Arrighi (Citation1994), modified by the author. In Marx’s (Citation1867/1976) general formula for capital, M-C-M’, M is money and C is commodity. M-C is the process of producing a commodity; C-M’ is the sale of the commodity. In his history of capital, Arrighi treats these two processes as temporal phases of oscillating, systemic cycles of accumulation (see Arrighi, Citation1994 for details).
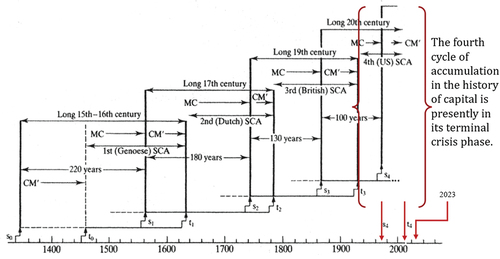
Figure 3. Number of countries in the world in conflict, 1946–2021 (three year rolling average).Data from UCDP (Citation2022); Figure by author. A corresponds to a brief period of stability after World War II; B to the rise in conflicts during the Cold War and anticolonial period; C to the brief period of renewed US hegemony after the fall of the USSR; D to the era of the triple crisis. I thank Marwan Safar Jalani and IRC for assistance with the Figure.
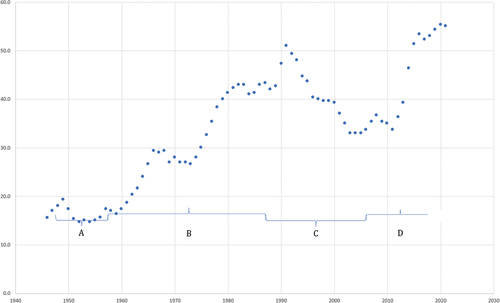
Figure 4. Four potential future pathways. From Wainwright and Mann (Citation2018), Climate Leviathan.
Figure 5. The fate of the concept and practice of development in four distinct future pathways.