
Figures & data
Figure 1. Courses (% of 48) with enrollment in each range for a typical semester.
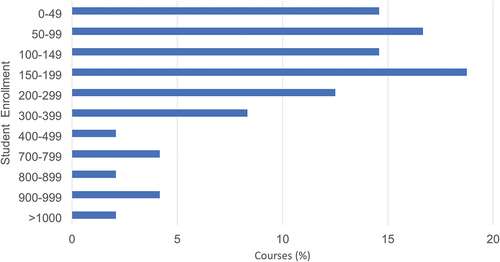
Figure 2. Courses (% of 24 first-year, % of 15 second-year, % of 7 third-year, and % of 2 fourth-year) that use each approach to anatomy education.
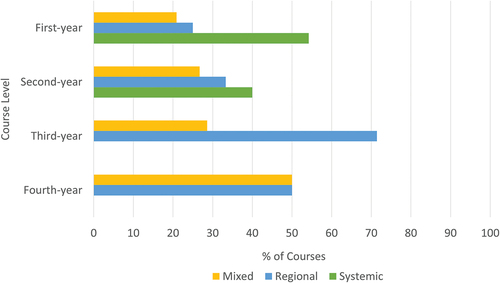
Figure 3. Courses (% of 47) that cover each content area.
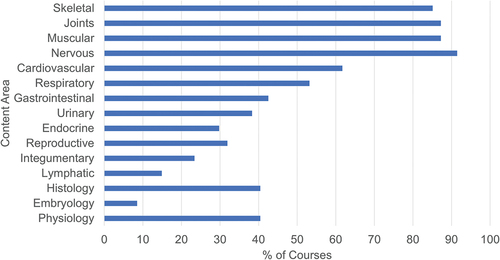
Figure 4. Mean (SD) weekly contact hours students experience using each content delivery method. F2F = face-to-face (in person). Note: 42 courses used F2F lectures; 42 courses used F2F labs/tutorials; 12 courses used synchronous online groups; 15 courses used asynchronous online individual sessions.
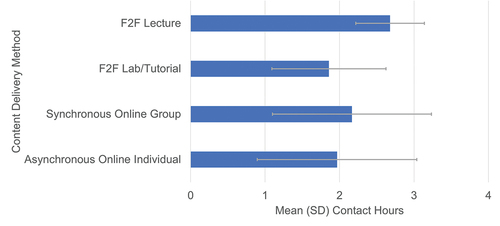
Table 1. Courses with labs (% of 42) that use each teaching method in the labs.
Figure 5. Courses (% of 46) offering each resource to students.
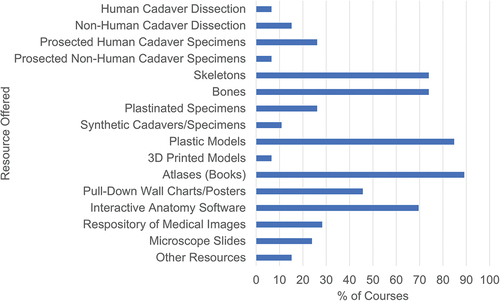
Table 2. Courses with (% of 22) or without (% of 24) access to an anatomy lab that offer each resource to students.
Table 3. Courses (% of 46 and total number of courses) that use each type of assessment and courses (% of 44 courses with written exams, % of 33 courses with practical exams, % of 19 courses with assignments) that use each assessment subtype.
Figure 6. Proportion (%) of students’ final grade associated with each assessment method. Note: 31 courses had grade components totaling 100%.
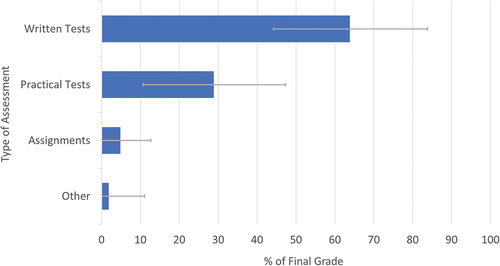
Table 4. Courses (%) using each type of personnel for course-related tasks.