Figures & data
Table 1. Variable descriptions.
Table 2. Offensive variables and running match distance from 110 cases of performance of the 2023 FIFA Women’s World Cup.
Table 3. Mixed linear model from offensive variables and team total distance covered (km).
Figure 1. Decision tree from running distance covered (km) and offensive variables. Risk estimates = 25.28 ± 3.34 (SE).
Table 4. Mixed linear model from offensive variables and team high-speed distance covered.
Figure 2. Decision tree from high-speed running distance covered (km) and offensive variables. Risk estimates = 0.32 ± 0.04 (SE).
Figure 3. Clusters of offensive variables and running distance different letters represent statistical differences between clusters.
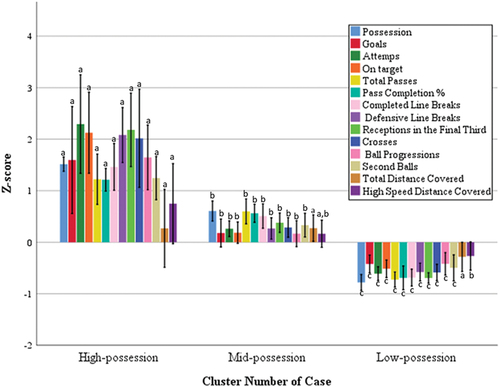
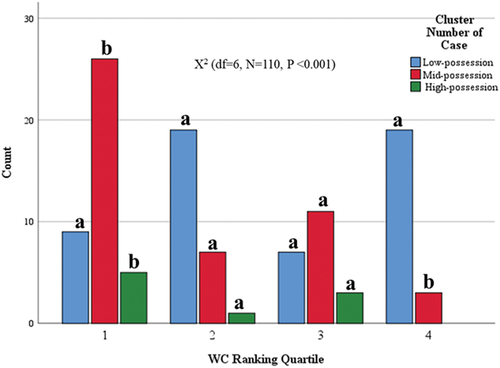
Figure 4. Clusters association with 2023-WC final classification. Different letters for the same cluster represent statistical differences for the z-test with Bonferroni correction.