Figures & data
Figure 1. The frequency of each variable used in the BART model. is an important variable.
are irrelevant variables.
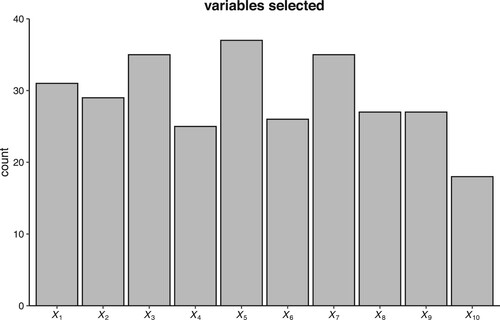
Figure 2. Toy example for PFBART.
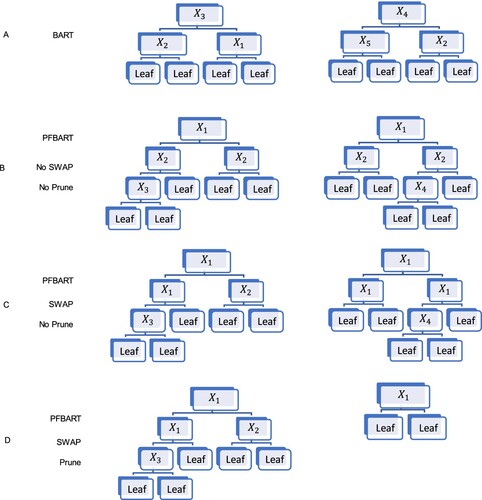
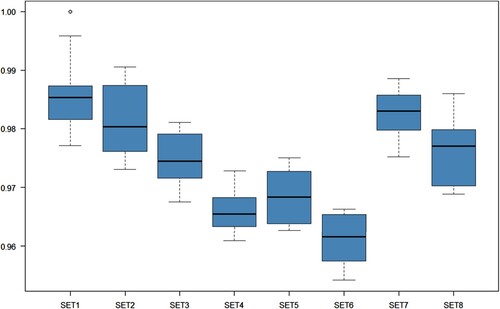
Figure 3. Boxplots of the RMSE values for each method across the 100 data sets.
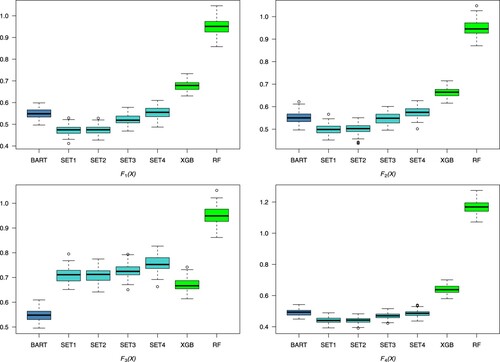
Table 1. Settings for hyperparameter.
Table 2. UCI data sets information.
Figure 4. Relative RMSE for every covariate in UCI data sets.
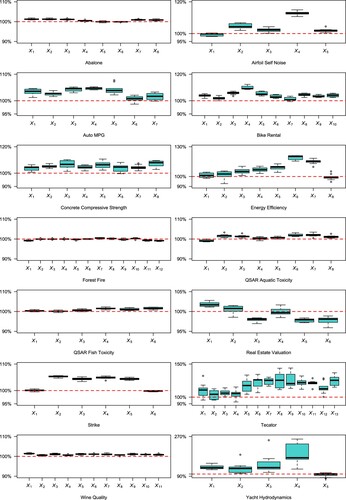
Table 3. Hyper parameter combinations.
Figure 5. Relative RMSE for PFBART with Beijing house price data.