
Figures & data
Figure 1. Piracy attacks in the world.
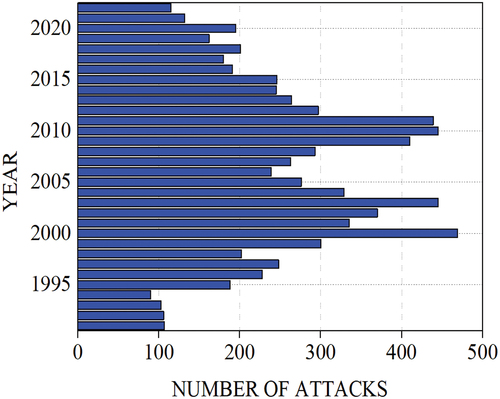
Figure 2. Yearly comparison of piracy cases in different world regions.
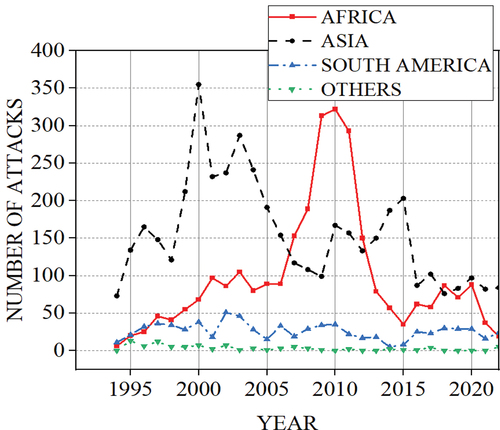
Figure 3. Piracy events distribution in Africa.
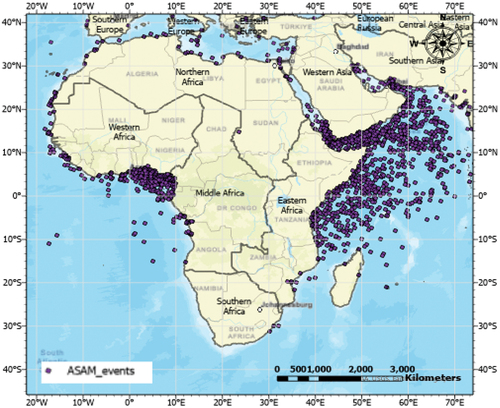
Figure 4. Piracy distribution in East Africa.
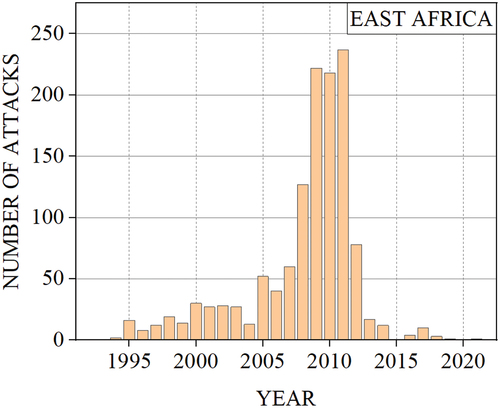
Figure 5. Piracy distribution in West Africa.
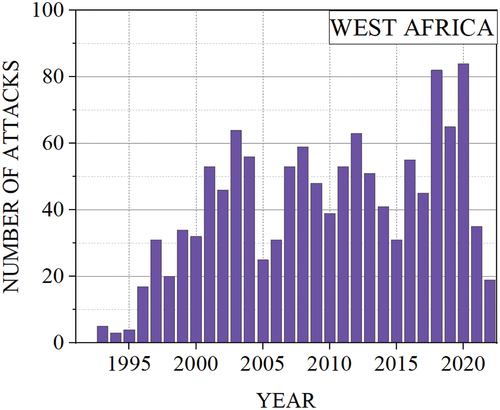
Figure 6. Piracy events comparison in Africa versus the world.
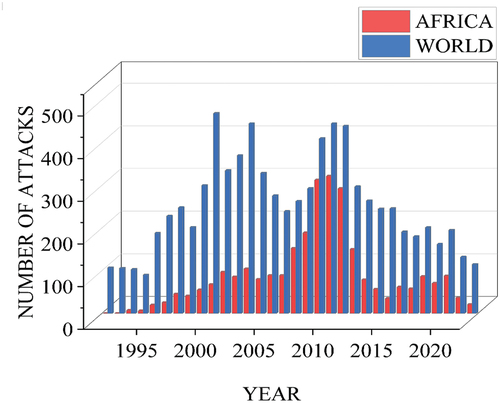
Table 1. Comparison for piracy attacks in Africa versus the world (1991–2022).
Figure 7. Maps of study areas.
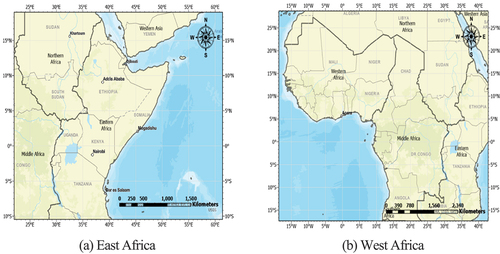
Figure 8. Flow diagram of the methodology used in the study.
Table 2. Summary of data used for spatial analysis.
Figure 9. Getis-ord Gi* hot spot analysis result for East Africa before 2012.
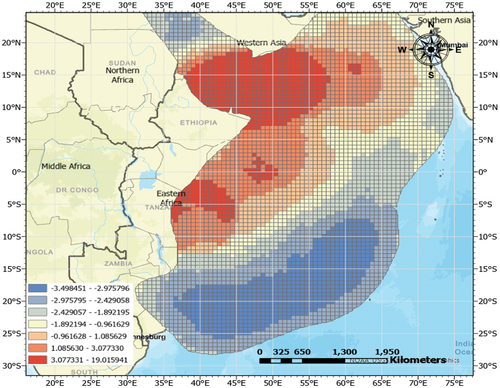
Figure 10. Getis-ord Gi* hot spot analysis result for East Africa after 2012.
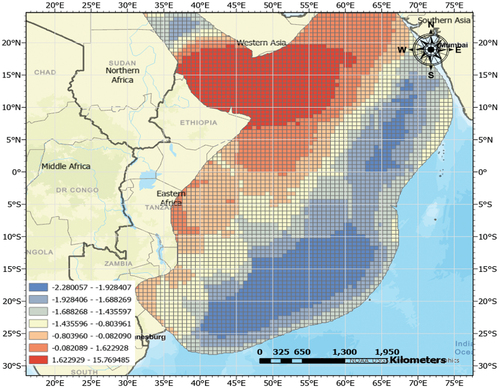
Figure 11. Getis-ord Gi* hot spot analysis result for West Africa before 2012.
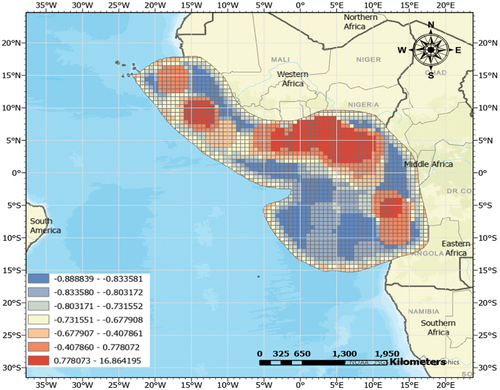
Figure 12. Getis-ord Gi* hot spot analysis result for West Africa after 2012.
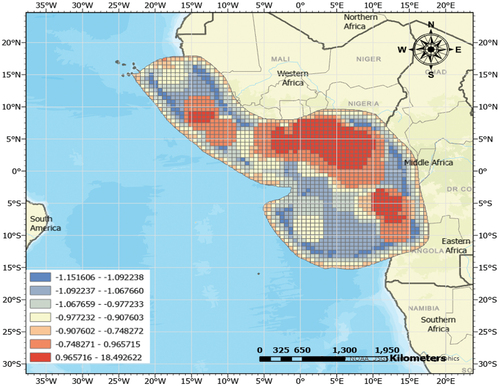
Table 3. Descriptive statistics of getis-ord Gi* hot spot result.
Figure 13. Hot spot analysis comparison result for West Africa.
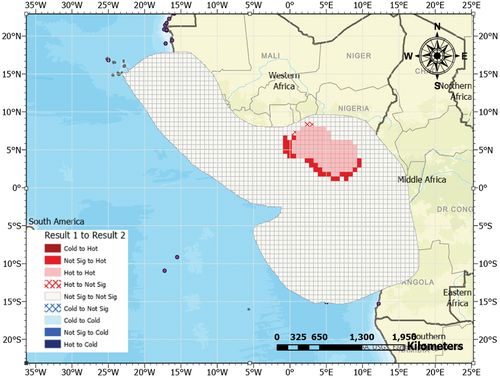
Table 4. Global hot spot analysis comparison results for West Africa.
Table 5. Hot spot significance level pair counts (percentages) for West Africa.
Figure 14. Hot spot analysis comparison result for East Africa.
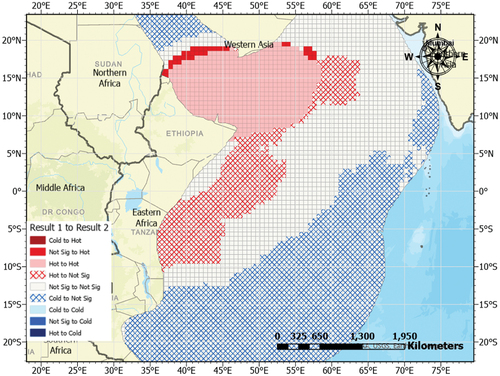
Table 6. Global hot spot analysis comparison results for East Africa.
Figure 15. Spatial dynamics of maritime piracy in east and West Africa (before and after 2012).
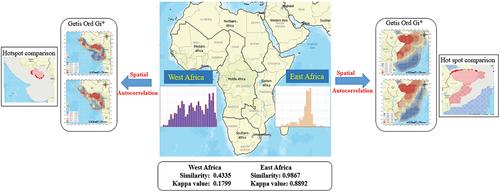
Table 7. Hot spot significance level pair counts (percentages) for East Africa.