Figures & data
Figure 1. Methodology adopted in this study.
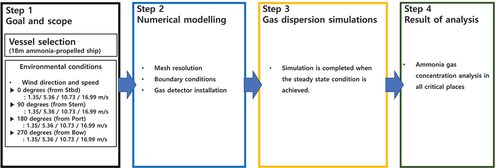
Table 1. The principal characteristics of the ship model used in this study.
Figure 2. Ship geometry used in this study.
Figure 3. Annual climate characteristics of Busan port (Windfinder, Citation2018).
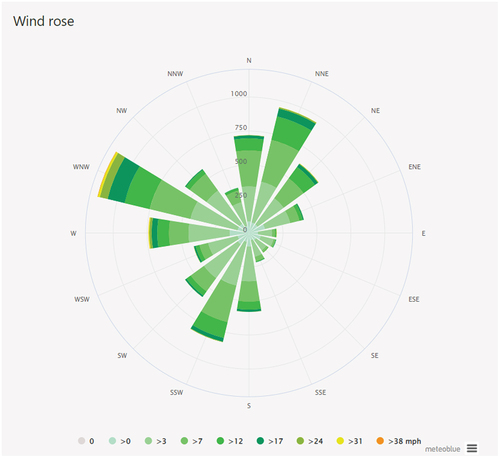
Table 2. Wind conditions applied in this study.
Figure 4. The operating pressure of the ammonia storage tank and the vent mast diameter.
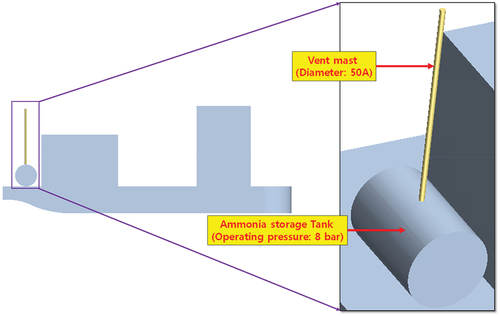
Table 3. Sixteen simulation cases carried out in this study.
Figure 5. The computation mesh generated in this work.
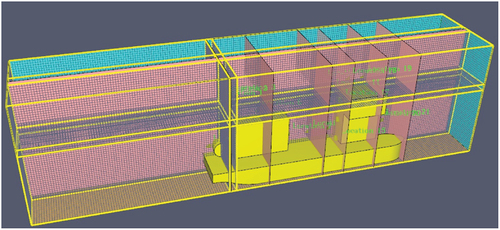
Figure 6. The number of grids generated in each compartment and the zoomed view of the vent mast.
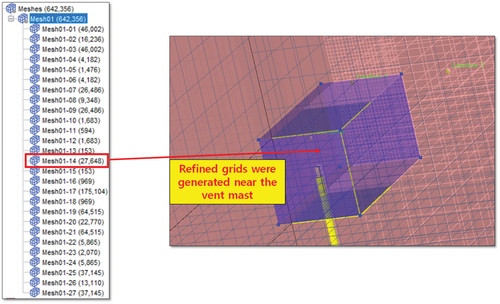
Figure 7. The boundary conditions applied to the background domain.
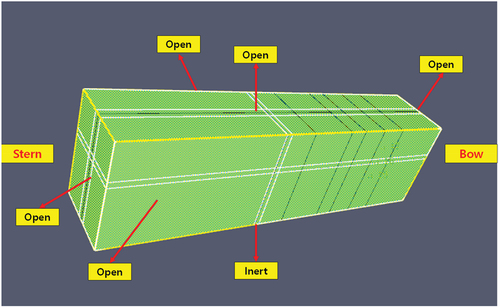
Figure 8. The boundary condition applied to the ship.
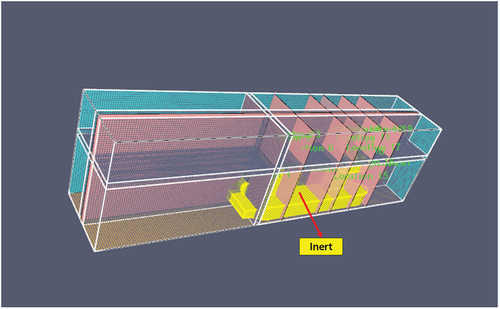
Figure 9. The boundary condition applied to the upper part of the vent mast.
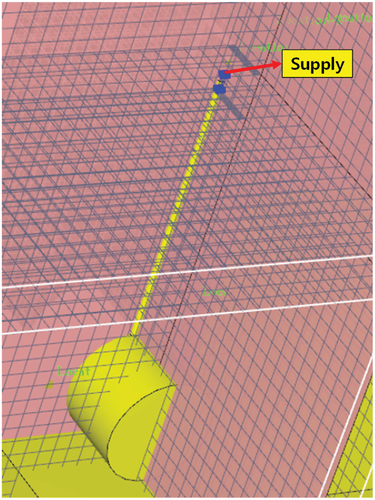
Figure 10. The locations of the gas detectors installed.
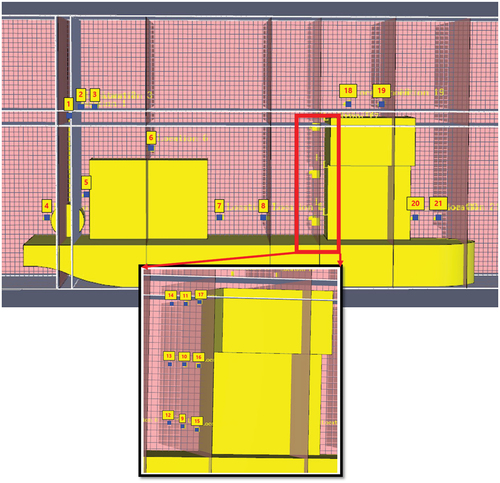
Figure 11. Ship coordinate system.
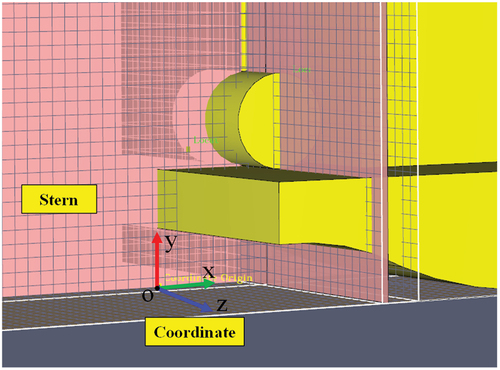
Table 4. The coordinates of the detectors.
Figure 12. Computational grids generated in Star-ccm+.
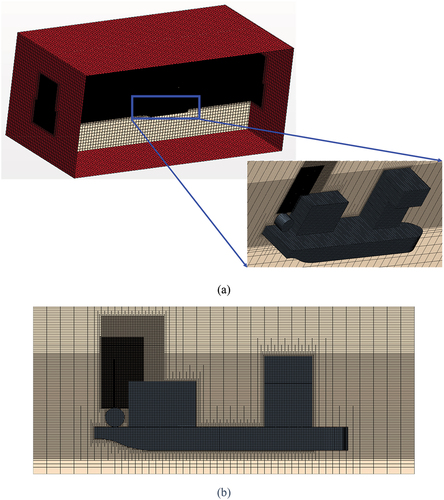
Figure 13. The boundary conditions applied to the gas dispersion CFD model.
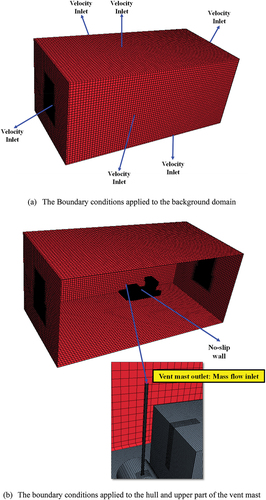
Figure 14. The physics adopted in Star-ccm+.
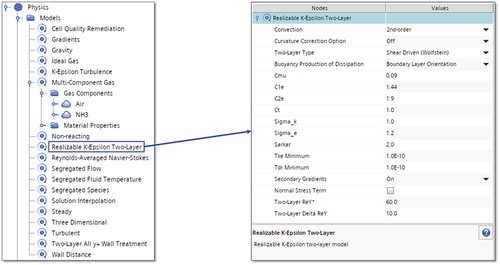
Figure 15. The results of the grid sensitivity study.
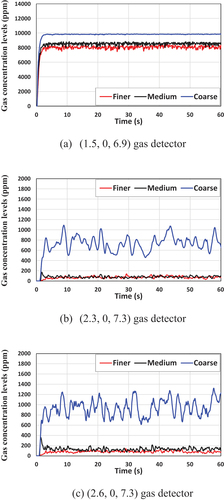
Table 5. Results for the gas dispersion simulation, obtained from PyroSim.
Table 6. Results for the gas dispersion simulation, obtained from Star-ccm+.
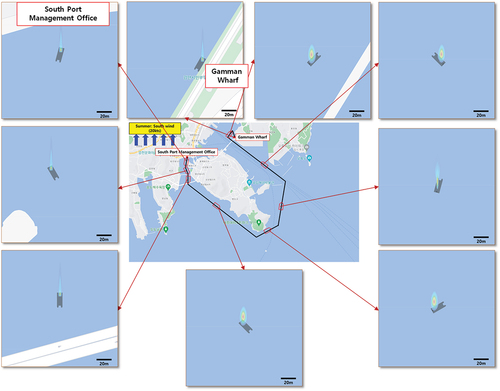
Figure 16. Gas dispersion simulation during ship operation (condition: winter, south wind 20 kts).
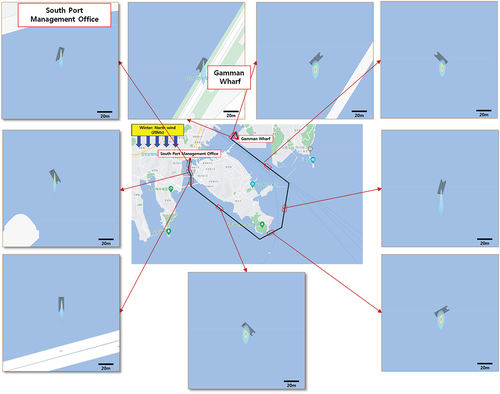
Figure 17. Gas dispersion simulation during ship operation (condition: summer, south wind 20 kts).