
Figures & data
Figure 1. ECHO cohort flow chart, United States, 2017–2019, ages 4 to 8.
832 children had in-person visits, but one did not have their weight measured, so n = 831 have BMI.
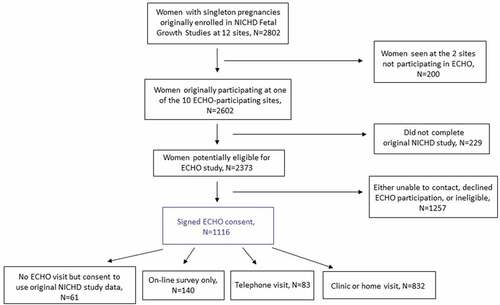
Table 1. Description of all variables considered, total and by child BMI percentile status, United States, 2017–2019, ages 4 to 8
Table 2. Multinomial logistic regression with 3 categories of child BMI percentile as outcome, with and without multiple imputation, United States, 2017–2019, ages 4 to 8
Table 3. Multivariable linear regression with continuous percent fat mass as outcome, United States, 2017–2019, ages 4 to 8