217
Views
0
CrossRef citations to date
0
Altmetric
Original Research

Study on treatment of chemical plant wastewater by using a integrated anaerobic–aerobic bioreactor

, &
Article: 2327359 | Received 16 Jan 2024, Accepted 03 Mar 2024, Published online: 11 Mar 2024

Figures & data

Figure 1. Schematic diagram of the IAAB process [Citation21]: 1, feed tank; 2, peristaltic pump; 3, heater; 4, supernatant sampling port; 5, sludge sampling port; 6, gas collection; 7, reflux pump; 8, aeration pump; 9, effluent.

Figure 1. Schematic diagram of the IAAB process [Citation21]: 1, feed tank; 2, peristaltic pump; 3, heater; 4, supernatant sampling port; 5, sludge sampling port; 6, gas collection; 7, reflux pump; 8, aeration pump; 9, effluent.

Table 1. Operation conditions of IAAB.

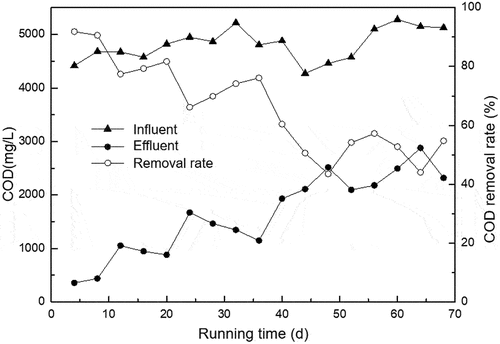
Figure 2. The change of COD in anaerobic chamber during the domestication stage.

Figure 2. The change of COD in anaerobic chamber during the domestication stage.

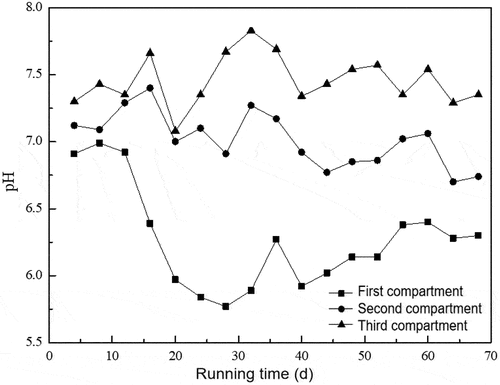
Figure 3. The change of pH during the domestication stage in each compartment.

Figure 3. The change of pH during the domestication stage in each compartment.

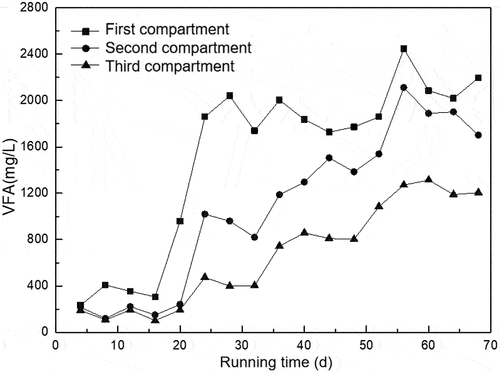
Figure 4. The change of VFA during the domestication stage in each compartment.

Figure 4. The change of VFA during the domestication stage in each compartment.

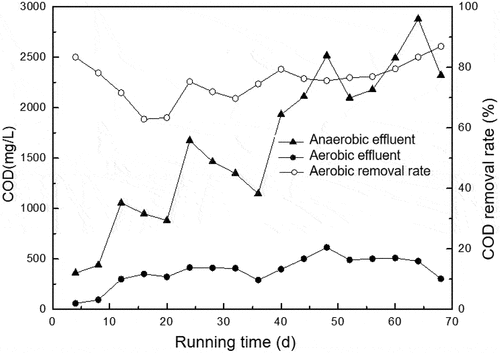
Figure 5. The change of COD in aerobic chamber during the domestication stage.

Figure 5. The change of COD in aerobic chamber during the domestication stage.

Table 2. EPS content in sludge of anaerobic chamber.

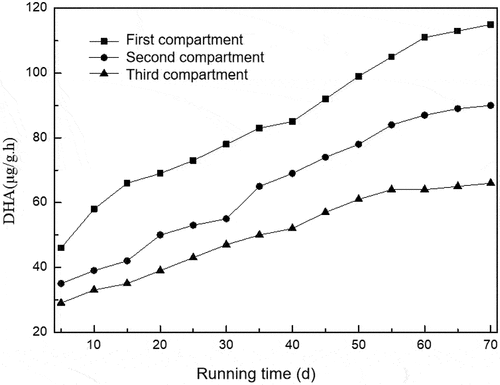
Figure 6. The change of DHA in each compartment of anaerobic chamber.

Figure 6. The change of DHA in each compartment of anaerobic chamber.

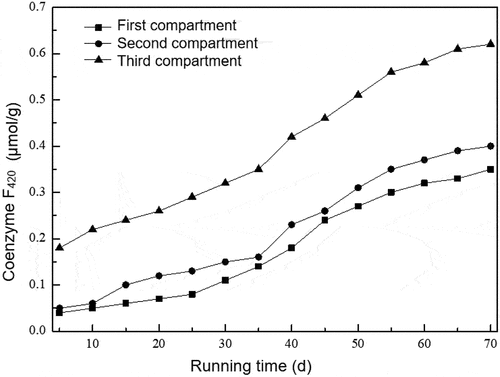
Figure 7. The change of F420 in each compartment of anaerobic chamber.

Figure 7. The change of F420 in each compartment of anaerobic chamber.

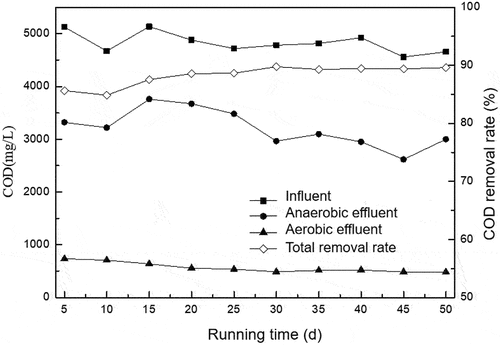
Figure 8. The change of COD during the stable operation.

Figure 8. The change of COD during the stable operation.

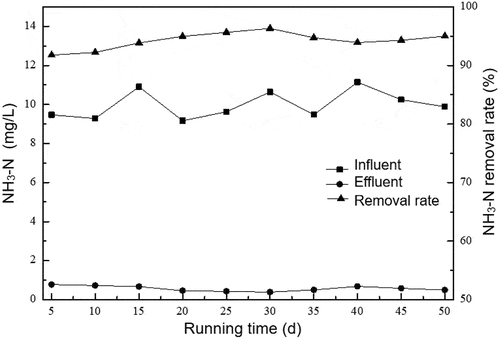
Figure 9. The change of NH3-N during the stable operation.

Figure 9. The change of NH3-N during the stable operation.

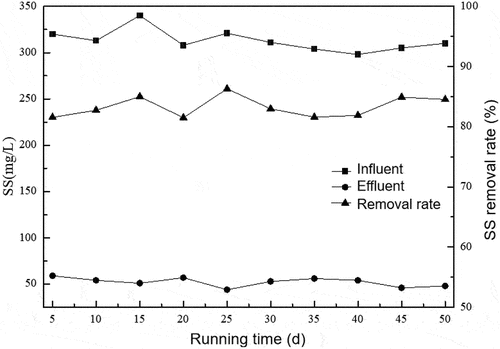
Figure 10. The change of SS during the stable operation.

Figure 10. The change of SS during the stable operation.

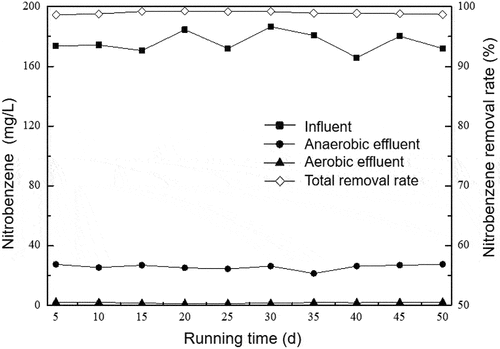
Figure 11. The change of nitrobenzene during the stable operation.

Figure 11. The change of nitrobenzene during the stable operation.

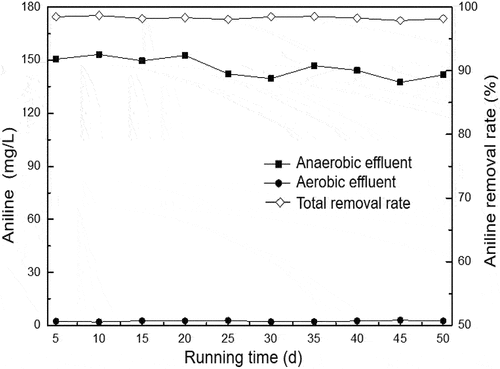
Figure 12. The change of aniline during the stable operation.

Figure 12. The change of aniline during the stable operation.

Data availability statement

Data will be made available on request.