Figures & data
Table 1. Basic physicochemical properties of test soil.
Figure 1. Effects of Sb3+ on soil enzyme activity. Note a sucrase activity sucrase activity was expressed as milligrams of 1 g of soil glucose after 24 h); b Catalase promotes (Catalase activity was expressed as milliliters of 0.02 mol/L potassium permanganate consumed by lg soil); c urease activity (urease activity was expressed as milligrams of NH3-N in lg soil after 24 h).
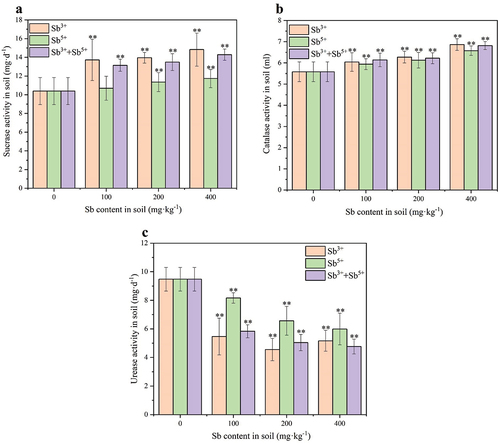
Figure 2. Effects of Sb3+ on soil nitrogen content. Note. a total nitrogen content in soil (mg·kg−1); b ammonia nitrogen content in soil (mg·kg−1).
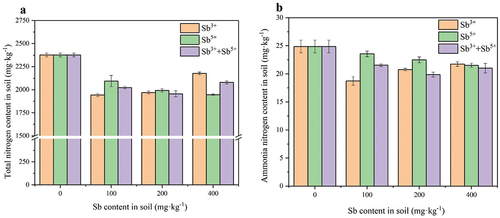
Table 2. Physical indicators of mung bean root nodules.
Table 3. Physical indicators of kidney bean root nodules.
Table 4. Physical indicators of peanut root nodules.
Figure 3. Effects of Sb3+ on rhizobium activity. Note a mung bean’s rhizobium activity (rhizobium activity was calculated as C2H4 content consumed per minute, **: p < 0.01); b kidney bean’s rhizobium activity; c peanut’s rhizobium activity.
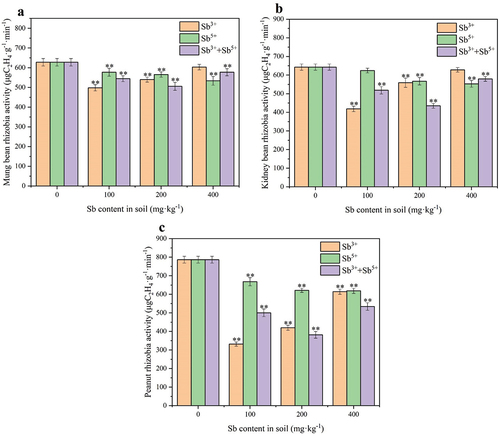
Figure 4. Statistical chart of the number of microbial taxonomic units at each level. Note. Sb0 represents CK, Sb1 represents soil with added Sb5+, and Sb2 represents soil with added Sb3+.
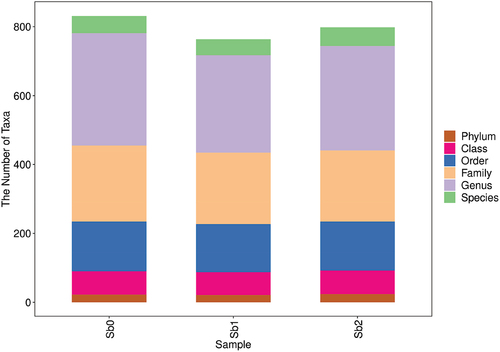
Table 5. Statistical table of the number of microbial taxonomic units at each level.
Figure 5. Venn diagram of the sample (group) ASV/OUT.
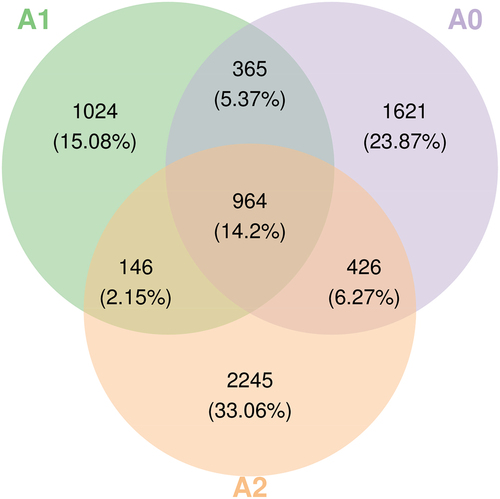
Figure 6. Abundance grade graph.
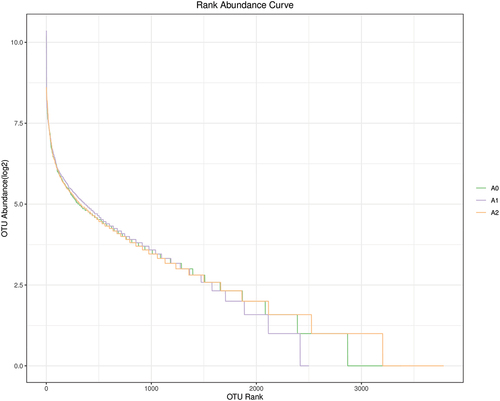
Figure 7. Heat map of species composition at the genus level for species clustering.
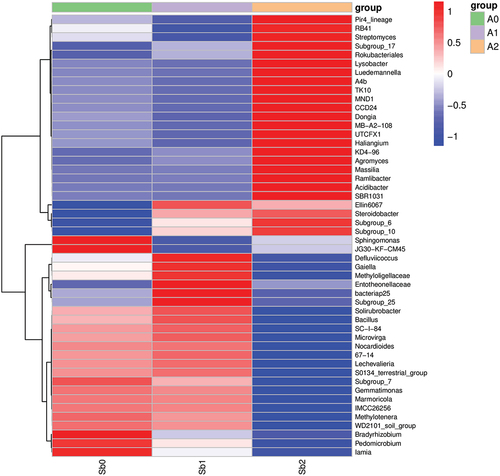
Figure 8. Heat map of species composition at the genus level for biclustering.
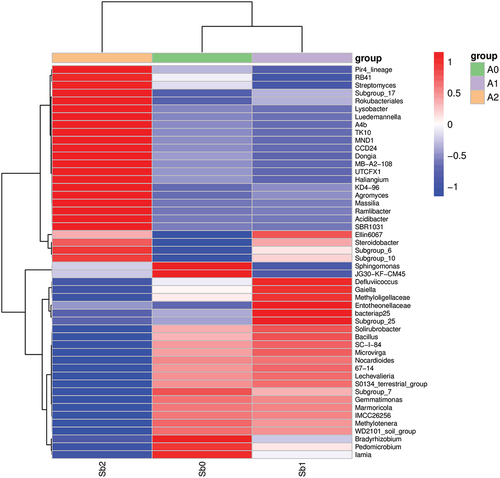
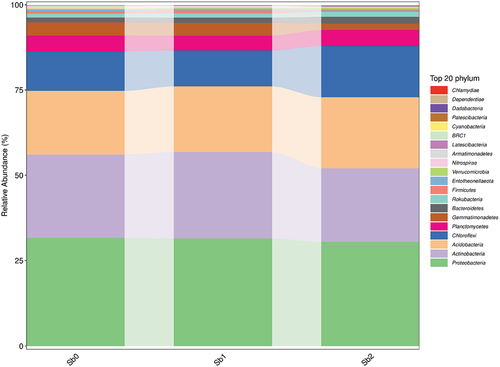
Figure 9. Bar chart of species composition. Note Sb0 represents CK, Sb1 represents soil with added Sb5+, and Sb2 represents soil with added Sb3+.
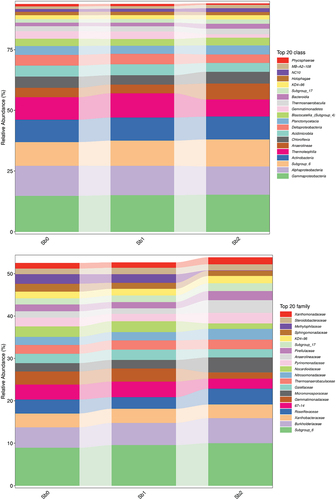
Figure 9. (Continued).
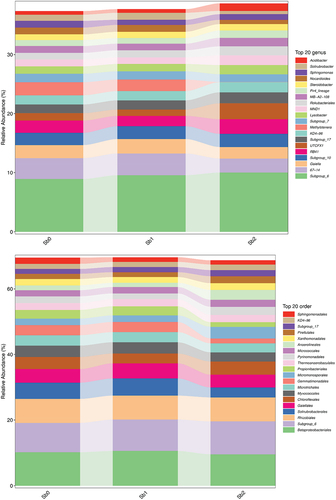
Figure 9. (Continued).