
Figures & data
Figure 1. Rice planting area and phosphorus fertiliser application quantity across China from 2010 to 2020.
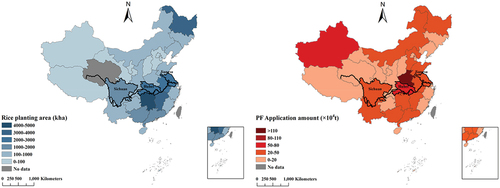
Figure 2. Total planting area and the proportion of different food crops for the three provinces from 2010 to 2020.
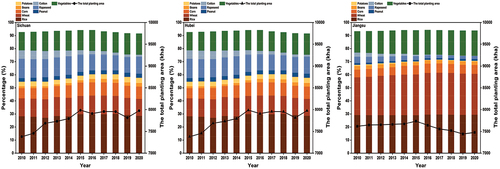
Figure 3. The PF application rate for the three provinces from 2010 to 2020.
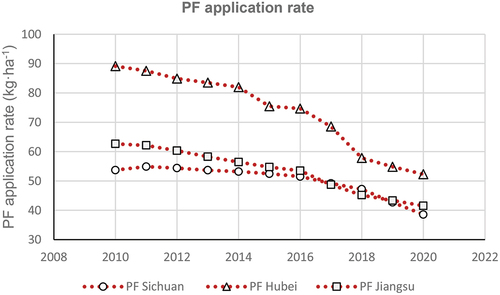
Figure 4. The yield of grains, cash crops and vegetables for the three provinces from 2010 to 2020.
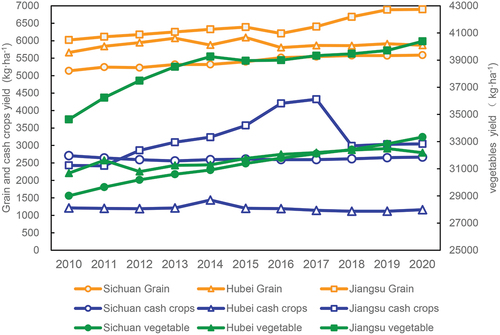
Figure 5. Cd content in Chinese PF from 2010 to 2020 (mg∙kg−1).
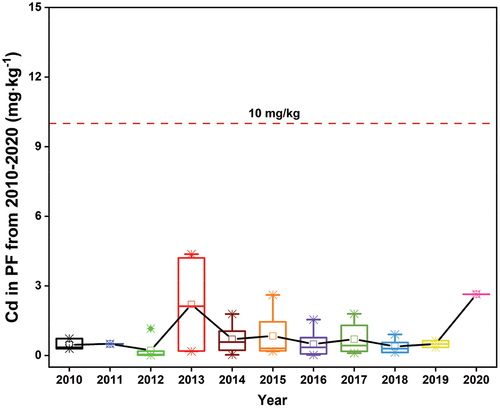
Figure 6. Cd input from PF from 2010 to 2020 (μg∙kg−1 soil∙ha−1).
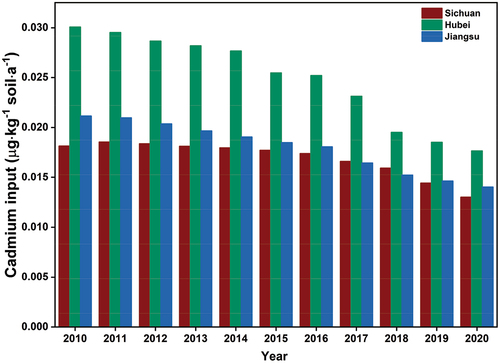
Figure 7. Area of cultivated land, PF application rate and Cd input from PF of Sichuan, Hubei and Jiangsu for 2010–2020.
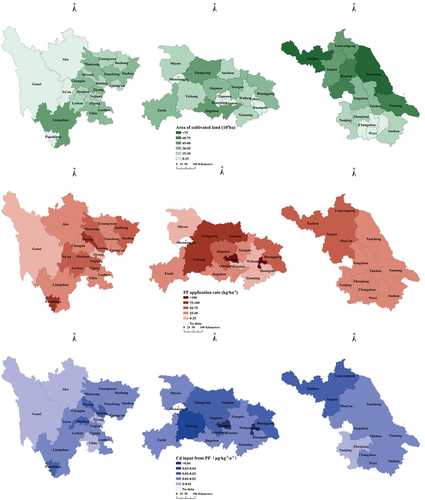
Figure 8. Dietary Cd intake for adults per week (μg∙kg−1 bw).
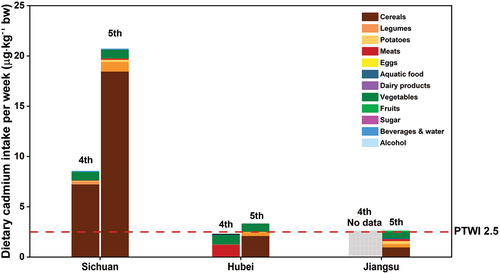
Table 1. The calculated THQ for different types of food of the three provinces.