Figures & data
Figure 1 Prevalence of pain in the past 12 months, according to sex, age, and income level.
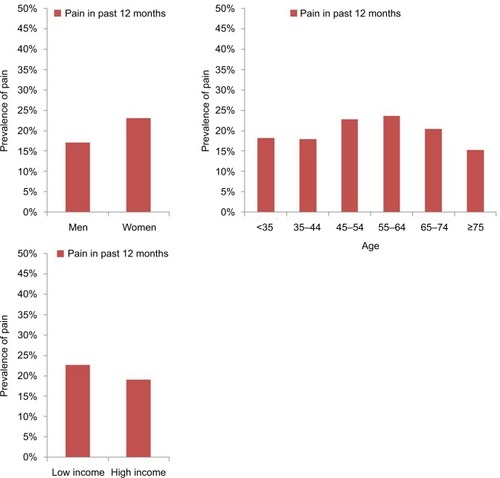
Table 1 Respondents according to sex, presence of pain, and comorbidity category
Figure 2 Mean mental and physical component summary scores, according to pain, age group, and income level.
Abbreviations: MCS, mental component summary; PCS, physical component summary.
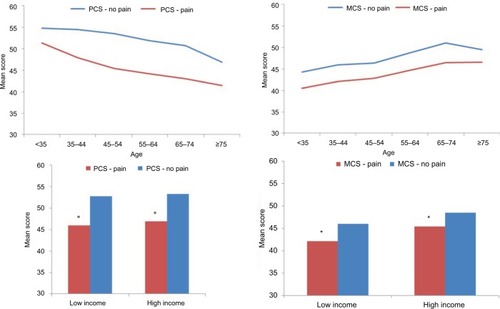
Figure 3 Mean SF-6D health utility score, according to pain, age group, and income level.
Abbreviations: CCI, Charlson comorbidity index; SF-6D, Short Form 6-Dimensions.
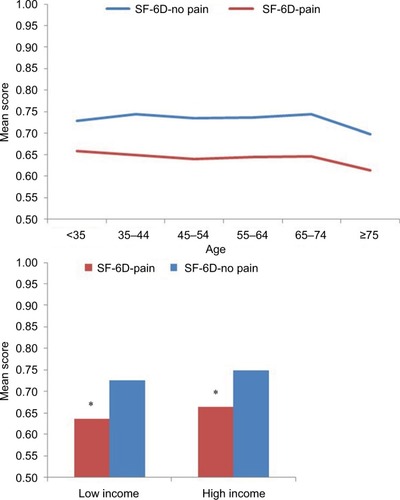
Figure 4 Mental component summary scores, according to pain, sex, and CCI category.
Abbreviations: CCI, Charlson comorbidity index; MCS, mental component summary.
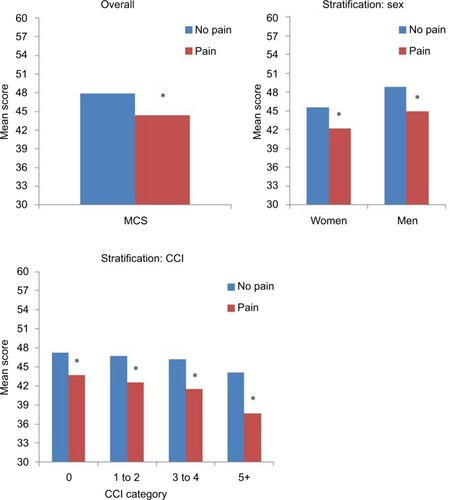
Figure 5 Physical component summary scores, according to pain, sex, and CCI category.
Abbreviations: CCI, Charlson comorbidity index; PCS, physical component summary.
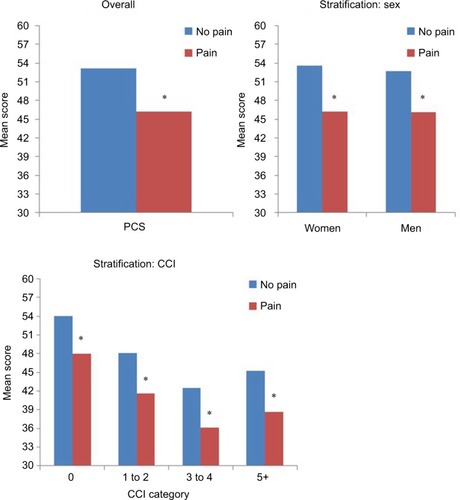
Figure 6 SF-6D health utility scores, according to pain, sex, and CCI category.
Abbreviations: CCI, Charlson comorbidity index; SF-6D, Short Form 6-Dimensions.
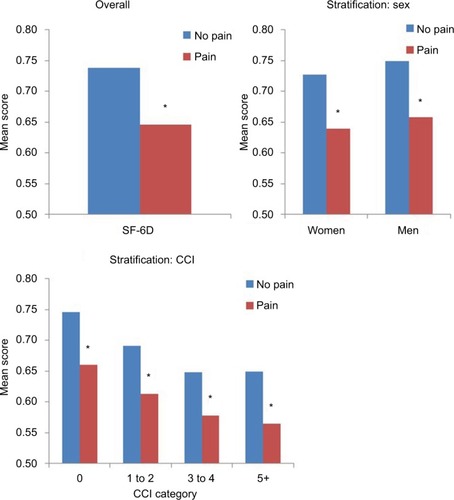
Figure 7 Mean activity impairment (WPAI), according to pain, age group, and income level.
Abbreviation: WPAI, Work Productivity and Activity Impairment.
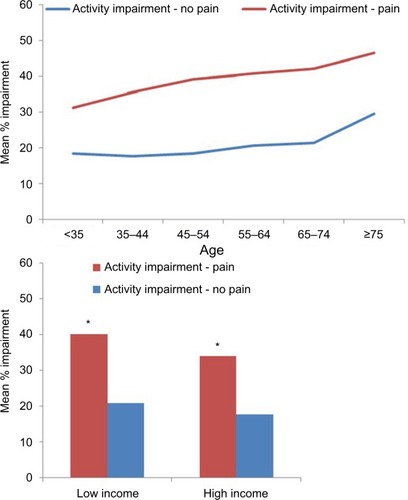
Figure 8 Mean activity impairment (WPAI), according to pain, sex, and CCI category.
Abbreviations: CCI, Charlson comorbidity index; WPAI, Work Productivity and Activity Impairment.
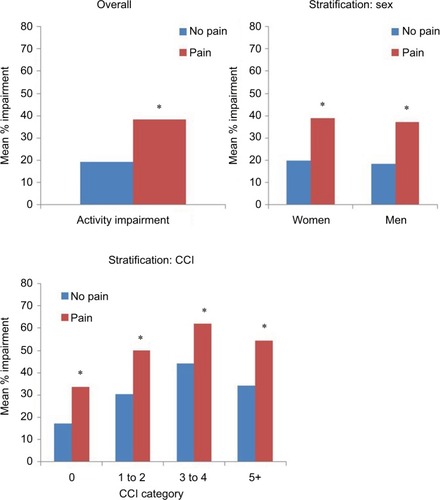
Figure 9 Prevalence of employment, according to pain and age group, in past 12 months.
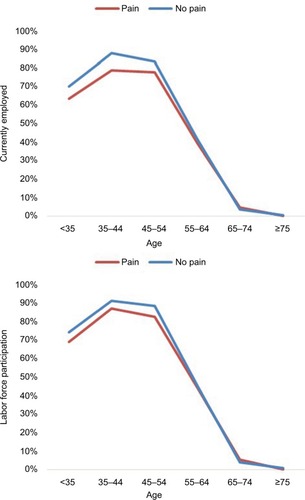
Figure 10 Mean number of health care provider visits in past 6 months, according to pain, age group, and income level.
Abbreviation: HCP, health care provider.
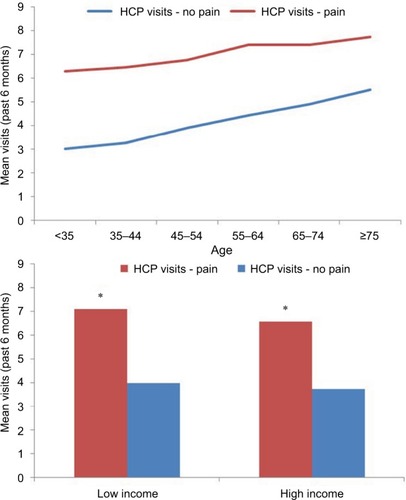
Figure 11 Mean number of emergency room visits and hospitalizations in the past 6 months, according to pain, age group, and income level.
Abbreviation: ER, emergency room.
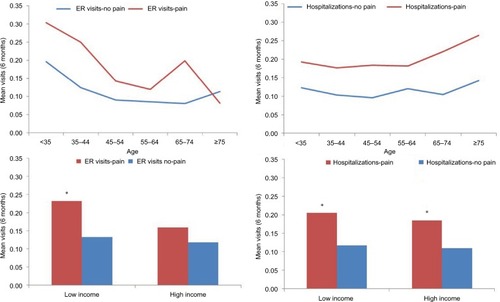
Figure 12 Health care provider visits (6 months, all-cause) by pain, sex, and CCI category.
Abbreviations: CCI, Charlson comorbidity index
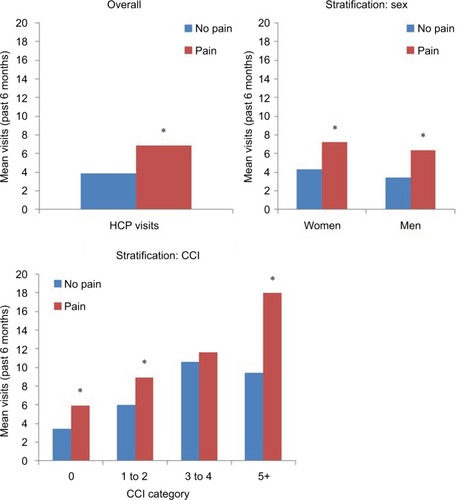
Figure 13 Percentage of adults visiting the emergency room by pain, sex, and CCI category.
Abbreviations: CCI, Charlson comorbidity index.
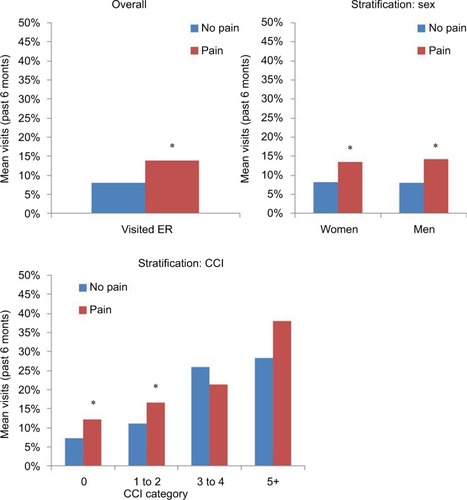
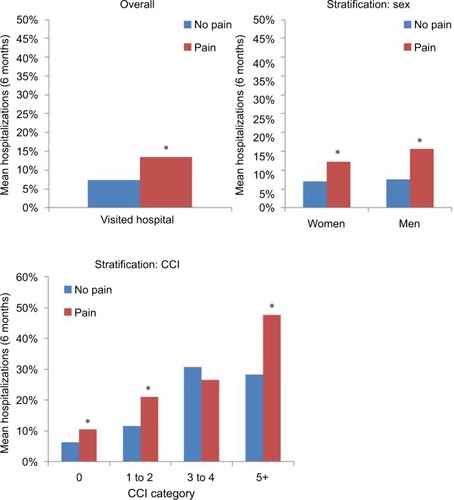
Figure 14 Percentage of adults who were hospitalized by pain, sex, and CCI category.
Abbreviation: CCI, Charlson comorbidity index.