Figures & data
Figure 1 Comparison of four potential normalization candidates for qPCR data.
Notes: Data are expressed as mean ± SD (n=8 for den/sham ratio for each time point). A ratio equivalent to 1 is indicative of similar expression levels in the den and sham muscle samples. (A) Actin den/sham ratios over the four denervation time points. Actin expression is fairly stable between the den and sham muscles at day 1, day 3, and day 14 but extremely variable at day 7. (B) Tubulin expression is similar to actin, with high variability at day 7 but also increased variability at day 14. (C) RPS12 was the most stable of all three potential normalization candidates with minimal variance. (D) The den/sham ratios for actin, tubulin, and RPS12 were collapsed, and the mean and SD were calculated. The higher variability at day 7 persisted following the average. Based on this high variability at day 7 in all other normalization candidates, RPS12 alone was selected as the normalization control for the qPCR analyses, because the ratios were closest to one with minimal variance.
Abbreviations: den, denervated; qPCR, quantitative polymerase chain reaction; RPS12, ribosomal protein S12.
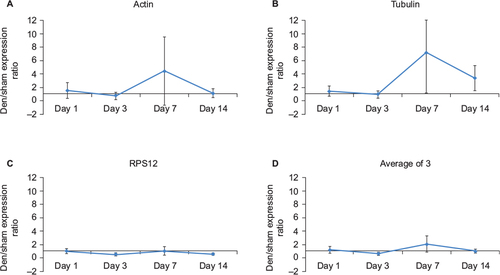
Table 1 Mouse gastrocnemius mass (mg) normalized to body weight (g)
Figure 2 Impact of denervation on plectin, dystonin, and MACF mRNA expression levels.
Notes: Data are expressed as a ratio of mRNA levels in den vs sham muscles (mean ± SE) (n=8 for den/sham ratio for each time point). Both plectin and dystonin gene expressions were progressively reduced over the denervation time course. By day 14, mRNA levels for plectin and dystonin were reduced by half compared to day 1 levels. In contrast, MACF gene expression was significantly upregulated at day 3, day 7, and day 14 relative to day 1, with expression in den muscle peaking at roughly three times the expression levels in the contralateral sham limb. aSignificantly lower than day 1 expression levels. bSignificantly lower than day 7 expression levels. cSignificantly higher than day 1, day 7, and day 14 expression levels.
Abbreviations: den, denervated; MACF, microtubule-actin cross-linking factor; SE, standard error.
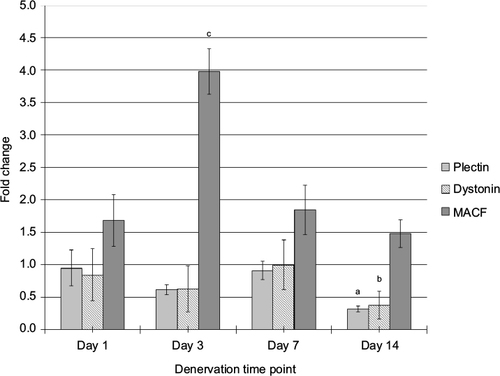
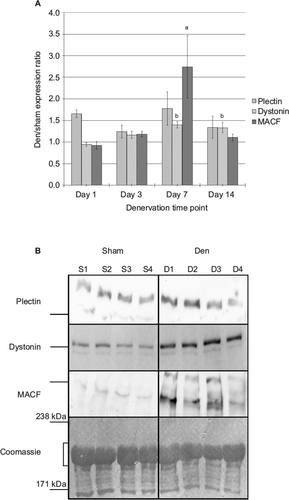
Figure 3 Impact of denervation on plectin, dystonin, and MACF protein expression levels.
Notes: (A) Data are expressed as a ratio of protein levels in den vs sham muscles (mean ± SE) (n=8 for den/sham ratio for each time point, except plectin where n=6 due to the removal of outliers). No statistically significant differences were observed for plectin protein expression between all denervation time points. Dystonin protein expression was slightly higher at day 7 and day 14 postdenervation compared to day 1 expression levels, but the ratios were <1.5. MACF protein levels were significantly upregulated at day 7, but this increased expression was only transient as protein levels returned to sham levels at day 14 postdenervation. (B) Examples of day 7 immunoblots for plectin (500 kDa), dystonin (800 kDa), and MACF (600 kDa), with sham samples (S1–S4) and corresponding den (D1–D4) samples. The line to the left of each plakin blot indicates the location of the 460 kDa marker. The corresponding images of the Coomassie-stained membranes are presented along with the 171 kDa and 238 kDa markers. The area used for normalization is also indicated with a bracket. aSignificantly different from day 1, day 3, and day 14 expression levels. bSignificantly different from day 1 expression levels.
Abbreviations: den, denervated; MACF, microtubule-actin cross-linking factor; SE, standard error.