Figures & data
Figure 1 Short-term effect of cyto-D treatment on MEFs.
Notes: (A) Actin-GFP image of a transfected MEF cell. (B) The same cell imaged after cyto-D was added to the cell dish. (C) The same cell imaged after the cyto-D was washed out. After 2 hours, the actin-filament structure gradually recovered. (D–F) Dispersion maps of Γ (qx, qy) associated with the time-lapse images in A–C. (G) The dispersion curves along fiber directions (red line in A) were plotted on the same graph. The black squares represent the normal MEF shown in A, and exhibit linear dependence (directed transport). The green line is a linear curve indicating deterministic transport. The blue circles correspond to B, where the cells were treated with cyto-D, and exhibit a quadratic dependence (diffusion). The red triangles represent the cell in C, recovered after washing out cyto-D. Note that the normal and recovered cells exhibit an identical dispersion relation, which indicates that the dynamics were fully recovered as a result of washout. All time-lapse images were acquired at 1 frame/second for 4.25 minutes using epifluorescence microscopy.
Abbreviations: MEF, mouse embryonic fibroblast; cyto-D, cytochalasin D; GFP, green fluorescence protein.
Abbreviations: MEF, mouse embryonic fibroblast; cyto-D, cytochalasin D; GFP, green fluorescence protein.
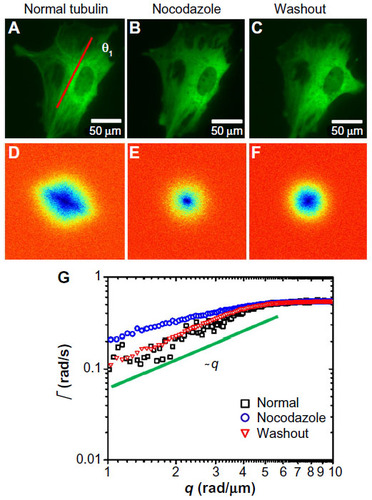
Figure 2 Short-term effect of nocodazole treatment on MEFs.
Notes: (A) Tubulin-GFP image of a transfected MEF cell. (B) The same cell imaged after nocodazole was added to the cell dish. (C) The same cell imaged after the nocodazole was washed out. (D–F) Dispersion maps of Γ (qx, qy) associated with the time-lapse images in A–C. (G) The dispersion curves along fiber directions (red line in A) were plotted on the same graph. The black squares represent the normal MEF shown in A, and exhibit linear dependence (directed transport). The blue circles correspond to B, where the cells were treated with nocodazole, causing the curve to flatten out. The red triangles are associated with the cell in panel C, which recovered after washing out the nocodazole. The green lines indicate the theoretical fit for the q1 and q2 dependence. Note that the normal and recovered cells exhibit an identical dispersion relation, which indicates that the dynamics were fully recovered as a result of washout. All time-lapse images were acquired at 1 frame/second for 4.25 minutes using epifluorescence microscopy. q2 corresponds to diffusion.
Abbreviations: MEF, mouse embryonic fibroblast; cyto-D, cytochalasin D; GFP, green fluorescence protein.
Abbreviations: MEF, mouse embryonic fibroblast; cyto-D, cytochalasin D; GFP, green fluorescence protein.
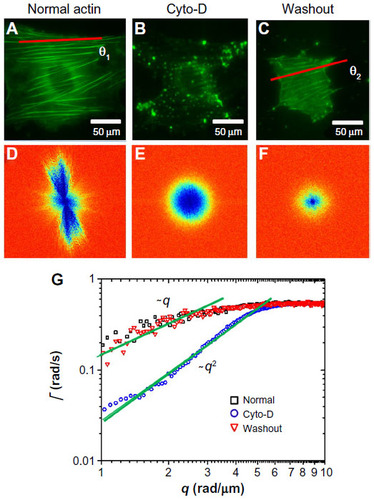
Figure 3 Long-term effect of nocodazole treatment on MEFs.
Notes: (A) Tubulin-GFP image of a transfected MEF cell. (B–D) The same cell at different points in time, as indicated, after adding nocodazole. (E–H) Dispersion maps of Γ (qx, qy) associated with images A–D, with two axes of symmetry shown. (I–L) Dispersion-relation curves plotted along the two axes (θ1, θ2), and azimuthally averaged, as indicated. The green lines are linear curves indicating deterministic transport. Before treatment, the linear dependence (deterministic motion) was dominant. Under nocodazole treatment, the curves flatten out progressively. All time-lapse images were acquired at 1 frame/second for 4.25 minutes using epifluorescence microscopy. q1 corresponds to deterministic transport.
Abbreviation: MEF, mouse embryonic fibroblast; GFP, green fluorescence protein; T, time.
Abbreviation: MEF, mouse embryonic fibroblast; GFP, green fluorescence protein; T, time.
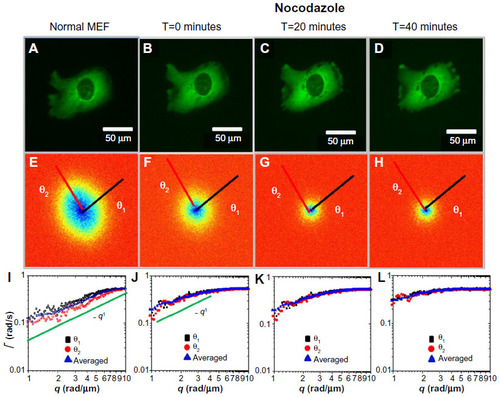
Figure 4 Long-term effect of cyto-D treatment on MEFs.
Notes: (A) Actin-GFP image of a transfected MEF cell. (B–D) The same cell at different points in time, as indicated, after adding cyto-D. (E–H) Dispersion maps of Γ (qx, qy) associated with images A–D, with two axes of symmetry shown. (I–L) Dispersion-relation curves plotted along the two axes (θ1, θ2), and azimuthally averaged, as indicated. Immediately after cyto-D was applied, the transport became diffusive (q2). However, with time, the deterministic trend (q1) was observed again (K and L). All time-lapse images were acquired at 1 frame/second for 4.25 minutes using epifluorescence microscopy. q1 corresponds to deterministic transport and q2 corresponds to diffusion.
Abbreviations: MEF, mouse embryonic fibroblast; cyto-D, cytochalasin D; GFP, green fluorescence protein; T, time.
Abbreviations: MEF, mouse embryonic fibroblast; cyto-D, cytochalasin D; GFP, green fluorescence protein; T, time.
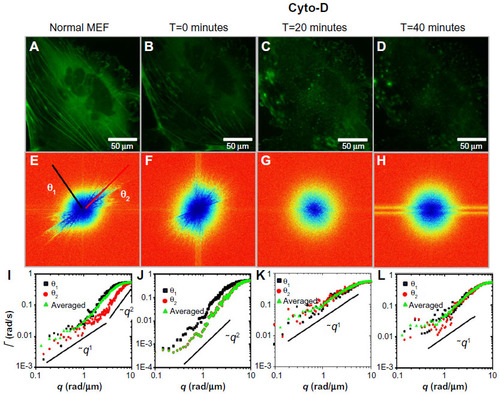
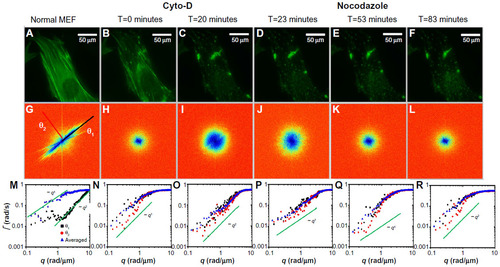
Figure 5 Effects of MEF treatment with cyto-D and nocodazole.
Notes: (A) Actin-GFP image of a transfected MEF cell. (B and C) The same cell at different points in time, as indicated, after adding cyto-D. (D) Addition of nocodazole. (E and F) The same cell at different points in time after adding nocodazole. (G–L) Dispersion maps of Γ (qx, qy) associated with images (A–F), with two axes of symmetry shown in (G). (M–R) Dispersion-relation curves plotted along the two axes (θ1, θ2), and azimuthally averaged, as indicated. The green lines show the theoretical curve for a ~q fit, or linear fit, which indicates deterministic transport, and ~q2 fit, or quadratic fit, which indicates Brownian motion. Immediately after cyto-D was applied, the transport became diffusive (O), and later showed a deterministic trend (P). However, after the nocodazole treatment, diffusion became dominant (Q and R). All time-lapse images were acquired at 1 frame/second for 4.25 minutes using epifluorescence microscopy. q1 corresponds to deterministic transport and q2 corresponds to diffusion.
Abbreviations: MEF, mouse embryonic fibroblast; cyto-D, cytochalasin D; GFP, green fluorescence protein; T, time.
Abbreviations: MEF, mouse embryonic fibroblast; cyto-D, cytochalasin D; GFP, green fluorescence protein; T, time.