745
Views
141
CrossRef citations to date
0
Altmetric
Original Research

Major air pollutants and risk of COPD exacerbations: a systematic review and meta-analysis

, , , , , & show all
Pages 3079-3091 | Published online: 12 Dec 2016

Figures & data

Figure 1 PRISMA flow chart of identified, included, and excluded studies.

Abbreviation: COPD, chronic obstructive pulmonary disease.
Figure 1 PRISMA flow chart of identified, included, and excluded studies.

Table 1 Contextual details of the studies included in the meta analysis

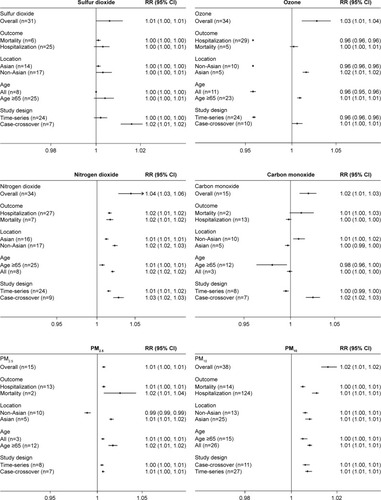
Table 2 Subgroup analysis by gaseous and particulate pollutants

Figure 2 Associations between gaseous and particular air pollution and COPD risk stratified by time lag (days).

Abbreviations: CI, confidence interval; COPD, chronic obstructive pulmonary disease; RR, relative risk.
Figure 2 Associations between gaseous and particular air pollution and COPD risk stratified by time lag (days).

Figure 3 Subgroup analysis for all gaseous and particulate air pollutants stratified by outcome, location, age, and study design.

Abbreviations: CI, confidence interval; COPD, chronic obstructive pulmonary disease; RR, relative risk.
Figure 3 Subgroup analysis for all gaseous and particulate air pollutants stratified by outcome, location, age, and study design.

Figure 4 Cartogram identifying associations between sulfur dioxide and nitrogen dioxide short-term exposure and COPD risk stratified by countries of high- and low-/middle-income levels.

Figure 4 Cartogram identifying associations between sulfur dioxide and nitrogen dioxide short-term exposure and COPD risk stratified by countries of high- and low-/middle-income levels.