Figures & data
Table 1 Primer Sequences for Quantitative Real-Time PCR Analysis
Figure 1 LD improved the structural damage of lung tissue in COPD mice. (A) The establishment of a mouse model for COPD and the schematic diagram illustrating drug administration. (B) Changes in body weight of mice in each group from 0 to 12 weeks; (C) Body weight of mice in each group at the end of the experiment (n = 10). (D) Using H&E staining to observe lung pathology (n = 3), bar = 50 μm. ((E) The lung injury in mice was quantified. According to the scope and severity of the lung, it was graded on a scale of 0.5–4: 0.5 = minor, 1 = mild, 2 = moderate, 3 = severe, 4 = very severe. Data are presented as mean ± SEM. ***P <0.001 vs Control group; ###P < 0.001 vs COPD group.
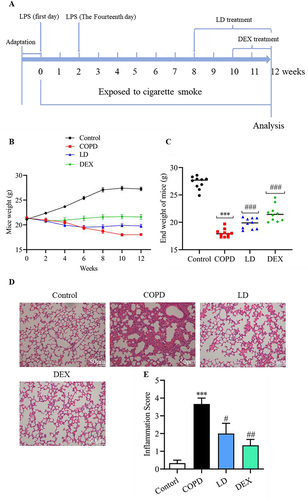
Figure 2 The LD treatment significantly improved inflammation in COPD mice. The numbers of neutrophils, macrophages and lymphocytes in BALF were counted (A). The levels of IL-1β, IL-6, TNF-α and INF-γ in BALF (B) and lung tissue (C) were analyzed by ELISA, respectively. Data are presented as mean ± SEM, n = 6. ***P <0.001 vs Control group; # P < 0.05, ##P < 0.01 and ###P < 0.001 vs COPD group.
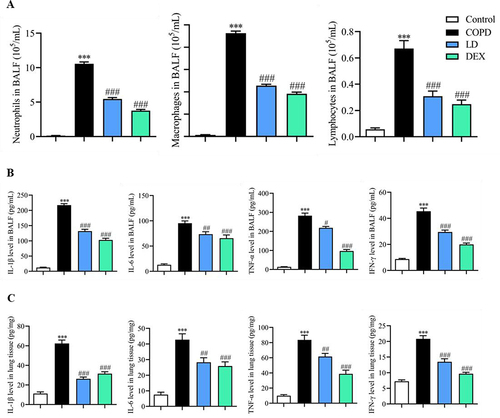
Figure 3 LD decreased the expression of p-NF-κB protein (A), and increased the expression of GDF11 protein (B) and gene (C) in lung tissue of COPD mice. Data are presented as mean ± SEM, n = 3. *P <0.05 and ***P <0.001 vs Control group; #P < 0.05, ##P < 0.01 and ###P < 0.001 vs COPD group.
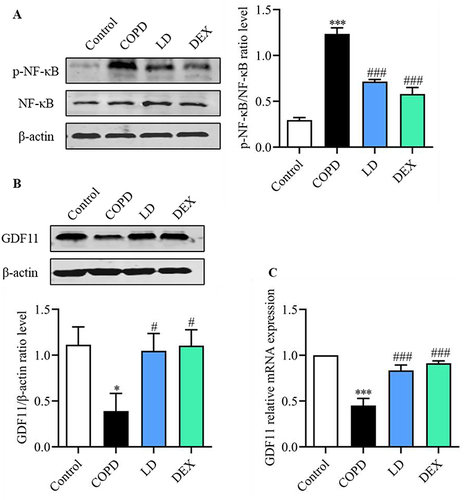
Table 2 The Enumeration of Gut Microbiome
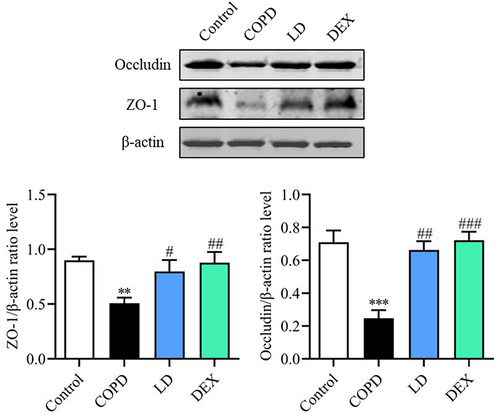
Figure 4 LD partially restored the barrier function of the impaired small intestine in COPD mice. ZO-1 and Occludin-1 protein levels in the small intestine were analyzed by Western blot. Data are presented as mean ± SEM, n = 3. **P <0.01 and ***P <0.001 vs Control group; #P < 0.05, ##P < 0.01 and ###P < 0.001 vs COPD group.