Figures & data
Table 1 The Basic Characteristics of the Included Studies
Figure 1 Flow chart for inclusion and exclusion of literature.
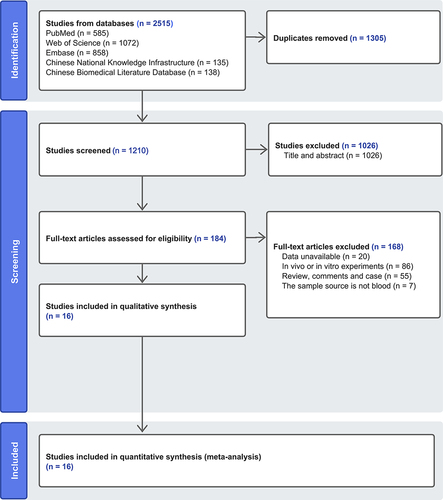
Figure 2 The blood miRNA was utilized to differentiate between COPD patients and the healthy control group in the meta-analysis results. Forest plot of (a) SSEN, (b) SSPE, (c) SPLR, (d) SNLR and (e) DOR. (f) AUC of SROC. (g) The fagan’s nomogram. (h) The results of publication bias.
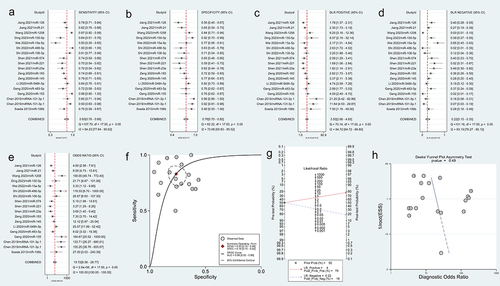
Figure 3 The blood miRNA was utilized to differentiate between AECOPD patients and the SCOPD patients in the meta-analysis results. Forest plot of (a) SSEN, (b) SSPE, (c) SPLR, (d) SNLR and (e) DOR. (f) AUC of SROC. (g) The fagan’s nomogram. (h) The results of publication bias.
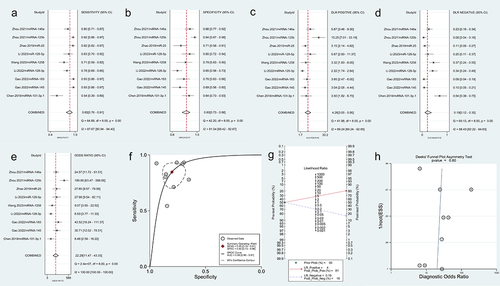
Table 2 Meta Regression and Subgroup Analysis of the Meta-Analysis
Figure 4 (a) The results of univariable meta-regression and subgroup analyses.(a) The blood miRNA was utilized to differentiate between COPD patients and the healthy control group in the meta-analysis results. (b) The blood miRNA was utilized to differentiate between AECOPD patients and the SCOPD patients in the meta-analysis results.
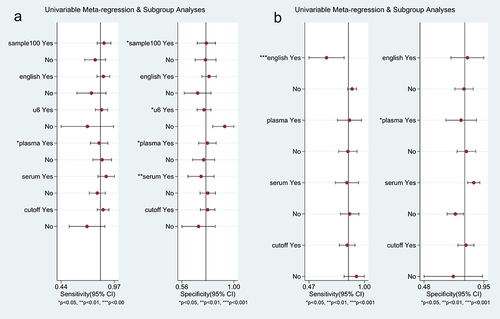
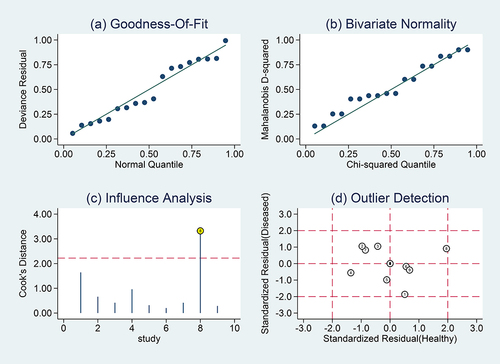
Figure 5 The sensitivity analysis was conducted using blood miRNA to distinguish between COPD patients and the healthy control group. (a) goodness-of-fit, (b) bivariate normality, (c) influence analysis, and (d) outlier detection.
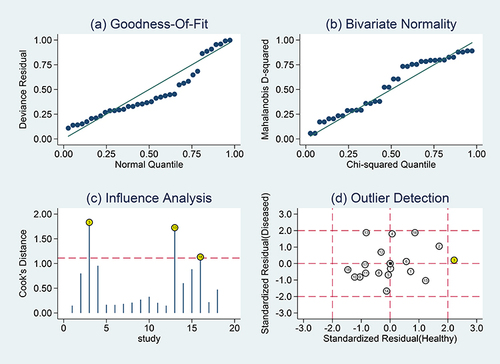
Figure 6 The sensitivity analysis was conducted using blood miRNA to distinguish between AECOPD patients and the SCOPD patients. (a) goodness-of-fit, (b) bivariate normality, (c) influence analysis, and (d) outlier detection.