Figures & data
Figure 1 Experimental set-up. Mice were randomly assigned to 4 different experimental groups (n=10 mice per group): (i) Normoxic control (NC) group: mice were kept under normoxic conditions (FiO2=21%) from day 0 to the day of sacrifice (day 7); (ii) Normoxic suspended (NS) group: mice were subjected to suspension from day 0 to day 7 under normoxic conditions (FiO2=21%); (iii) Hypoxic control (HC) group: mice were housed into a hypoxic chamber at 50 kPa (FiO2=10%) for 4 days before sacrifice (day 3 to day 7); (iv) Hypoxic suspended (HS) group: mice were subjected to suspension for 7 days (day 0 to day 7) and were transferred into a hypoxic chamber at 50 kPa (FiO2=10%) for the 4 final days of suspension (day 3 to day 7).
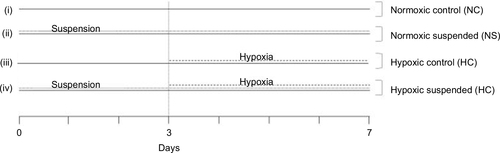
Figure 2 Suspension alters the hypoxia-induced egress of HSPCs from bone marrow to blood. Colony assay was used to determine the content of myeloid-derived progenitors [colony-forming cells sorted out as the number of CFU-granulocyte (CFU-G), CFU-macrophage (CFU-M) and CFU-granulocyte macrophage (CFU-GM)] in bone marrow (BM, panel A) and blood (panel B) of normoxic control (NC), normoxic suspended (NS), hypoxic control (HC) and hypoxic suspended (HS) animals (n=10/group). The content of erythroid progenitors (burst-forming unit-erythroid BFU-E) was similarly determined in bone marrow (BM, panel C) and blood (panel D) of the animals. *p≤0.05, ***p≤0.001.
![Figure 2 Suspension alters the hypoxia-induced egress of HSPCs from bone marrow to blood. Colony assay was used to determine the content of myeloid-derived progenitors [colony-forming cells sorted out as the number of CFU-granulocyte (CFU-G), CFU-macrophage (CFU-M) and CFU-granulocyte macrophage (CFU-GM)] in bone marrow (BM, panel A) and blood (panel B) of normoxic control (NC), normoxic suspended (NS), hypoxic control (HC) and hypoxic suspended (HS) animals (n=10/group). The content of erythroid progenitors (burst-forming unit-erythroid BFU-E) was similarly determined in bone marrow (BM, panel C) and blood (panel D) of the animals. *p≤0.05, ***p≤0.001.](/cms/asset/492eac28-9ec8-4b5c-98ce-511a91edb783/dhpx_a_12195786_f0002_b.jpg)
Table 1 Suspension does not alter hypoxia-driven hematological changes. Citrate-anticoagulated blood was collected at the sacrifice time (n=5/group) and hematological parameters were determined using an optical-based hematology analyzer (MS-9, Melet Schloesing) with a mouse-specific analysis software
Figure 3 Hypoxia modulates bone cell responses to suspension, without altering the suspension-driven bone loss. (A) Clonogenic capacity was assessed by colony-forming unit-fibroblast (CFU-F) assay in bone marrow (BM) of normoxic control (NC), normoxic suspended (NS), hypoxic control (HC) and hypoxic suspended (HS) animals (n=10/group). (B) Histomorphometric quantification of osteoblast surface normalized to bone surface (Ob.S/BS). (C) Histomorphometric quantification of osteoclast number normalized to bone surface (Oc.N/BS). (D) Quantification of femur bone volume/total volume ratio (BV/TV). (E) Representative Masson’s trichrome stained trabeculae of normoxic control femur (NC group) showing bone lining osteoblasts compared to (F) representative trabeculae of hypoxic control femur (HC group) showing osteoclast. Scale bars represent 50 µm in the main picture area and 25 µm in the zoomed areas. Arrows point out osteoblasts (E) and osteoclast (F). All histomorphometric measurements were performed in the distal femoral metaphysis of the animals (For each experimental group n=5 littermate mice). *p≤0.05.
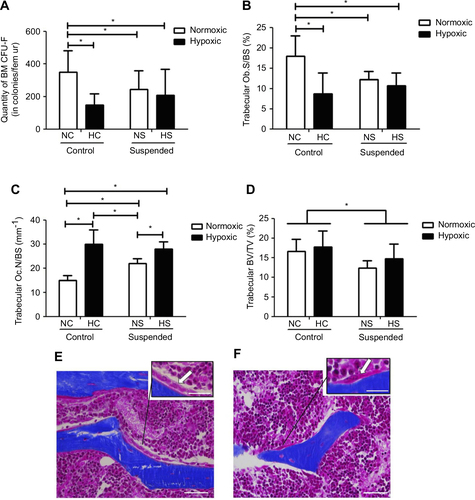
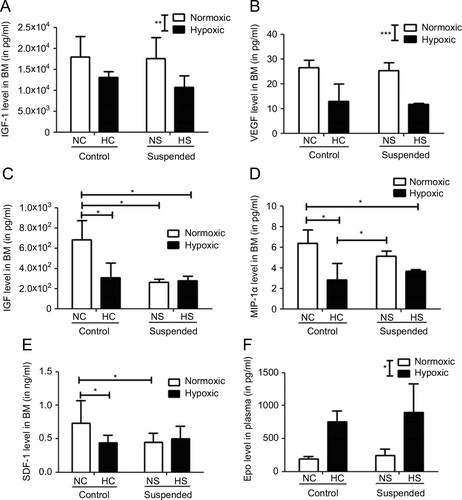
Figure 4 Suspension and hypoxia interact at the molecular level. In BM supernatants, level of proteins involved in stem cell proliferation and mobilization such as (A) IGF-1 (insulin-like growth factor-1), (B) VEGF (vascular endothelial growth factor), (C) HGF (hepatocyte growth factor), (D) MIP-1α (macrophage inflammatory protein-1α), and (E) SDF-1 (stromal cell-derived factor-1) was determined using Multiplex Sandwich Elisa (n=5/group) or Elisa kit (for SDF-1 only, n=10/group). In panel F, plasmatic level of Epo (erythropoietin) was measured by Elisa kit (n=5/group). *p≤0.05, **p≤0.01 and ***p≤0.001.