
Figures & data
Table 1 Effect of EEBR on the BW of the Rats Before and After Cisplatin-Induced Nephrotoxicity
Figure 1 Effect of EEBR on kidney function (left: SCr; right: BUN) of cisplatin-induced nephrotoxicity rats. Only the highest dose of EEBR (500 mg/kg BW) shows protection against nephrotoxicity as portrayed by a significant difference in SCr and BUN levels compared to the negative control. The # denotes the significant difference with the normal control (p<0.05). The * indicates a remarkable difference with the negative control (p<0.05).
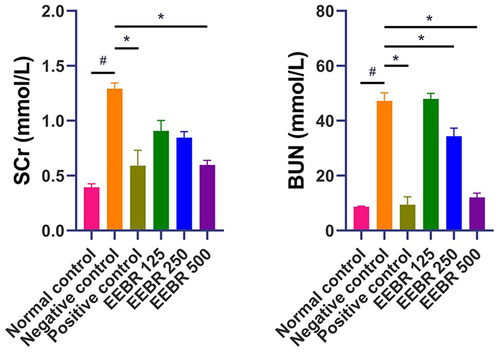
Table 2 Effect of EEBR on the Kidney Relative Weight of the Cisplatin-Induced Rats
Figure 2 Effect of EEBR on liver function ((A). GPT; (B) GOT) of cisplatin-induced nephrotoxicity rats. All doses of EEBR improved GPT levels but not GOT levels of the cisplatin-induced nephrotoxicity rats. The highest dose of EEBR elevated the GOT levels of the cisplatin-induced nephrotoxicity rats. The # denotes the significant difference with the normal control (p<0.05). The * indicates a remarkable difference with the negative control (p<0.05).
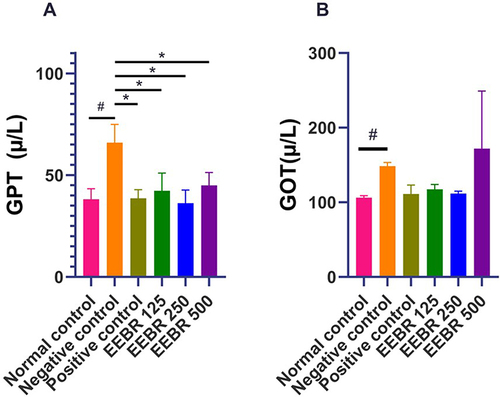
Figure 3 Effect of EEBR on MDA level and viability of kidney cells in cisplatin-induced nephrotoxicity rats. The * indicates a remarkable difference with the negative control (p<0.05). The # indicates a remarkable difference from the normal control group (p<0.05). Histology of the kidney tissue of rats in (a) normal control; (b) negative control; (c) positive control; (d) EEBR 125 mg/kg BW; (e) EEBR 250 mg/kg BW; (f) EEBR 500 mg/kg BW. Red arrows show the Bowman capsule. Inflammatory cells are shown by black arrows.
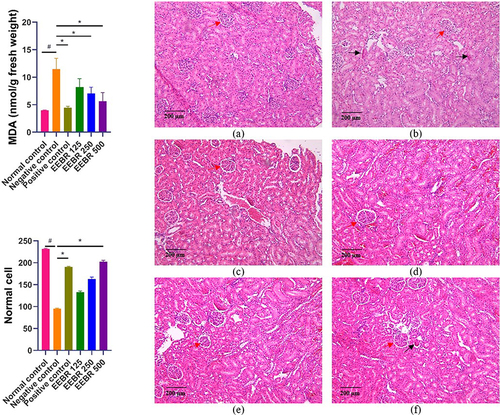
Table 3 RT-PCR Analysis of Kim-1, NGAL, Casp-3, and Casp-7 Expression in the RNA Isolated from the Kidney Cortex of Cisplatin-Induced Sprague-Dawley Rats
Table 4 Statistical Analysis of All Parameters
Data Sharing Statement
The data generated in the present study may be requested from the corresponding author upon reasonable request.