
Figures & data
Figure 1 Bioinformatics analysis of the DRGs microarray datasets, GSE126773 and GSE38038, after nucleus pulposus (NP). (A) Volcano plot depicting the differentially expressed genes (DEGs) in GSE126773. (B) Volcano plot illustrating the DEGs in GSE38038. (C) Heatmap displaying the top 1000 DEGs in GSE126773. (D) Heatmap showcasing the top 1000 DEGs in GSE38038.
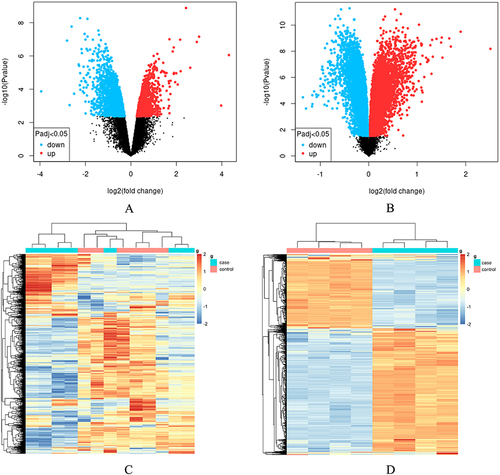
Figure 2 Venn diagram showing the overlapping DEGs between GSE126773 and GSE38038.
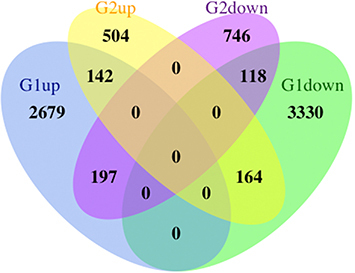
Figure 3 GO analysis and KEGG pathway analysis of the overlapping DEGs. (A) Enriched biological processes (BP) identified in GO analysis. (B) Cellular component (CC) terms enriched in GO analysis. (C) Molecular function (MF) terms enriched in GO analysis. (D) KEGG pathway enrichment analysis of the integrated DEGs.
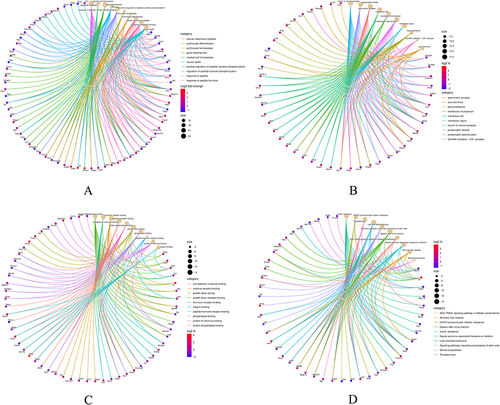
Figure 4 Significant gene clustering module. (A) Six gene clustering modules are shown. (B-D) The three modules with the highest scores include a total of 16 genes.
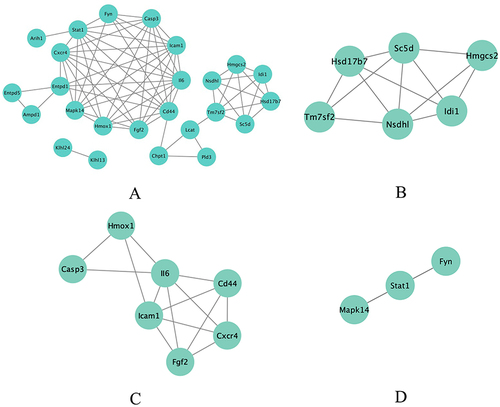
Figure 5 Common enrichment analysis results, and KEGG pathway graph. (A) Gene Ontology enrichment analysis results are presented. (B) KEGG pathway enrichment analysis results are displayed.
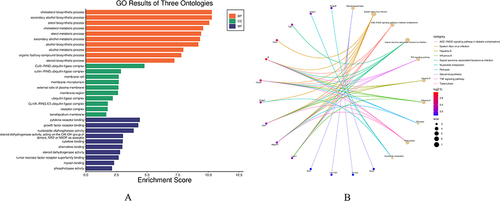
Table 1 The Top 10 Hub Genes by Topological Analysis Methods of CytoHubba
Table 2 Details of the Hub genes
Figure 6 Venn diagram and co-expression network of hub genes. (A) The Venn diagram illustrates the overlapping hub genes identified by six different algorithms. (B) The co-expression network of hub genes and their associated genes was analyzed using GeneMANIA. (C) Module analysis revealed that eight genes were present in the three modules with the highest scores. (D) Expression patterns of the eight hub genes in the control and treatment groups. (E and F) Pathways associated with the hub genes.
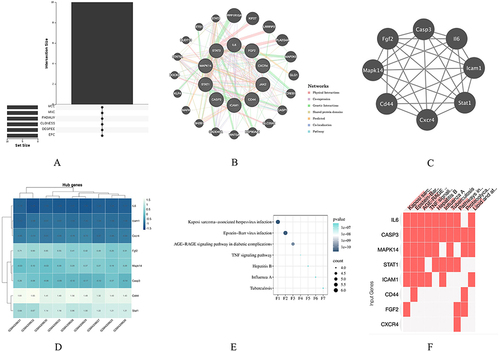
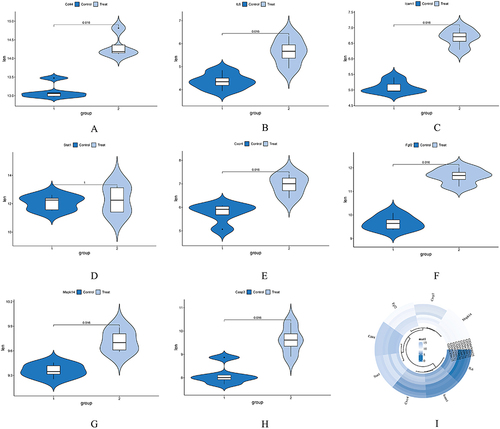
Figure 7 Expression level of hub genes in GSE145222. (A-H) Comparison between data sets using a mean t test. P<0.05 was considered statistically significant. (I) Expression of hub genes in both the control and CCD groups.
Data Sharing Statement
The data that support the findings of this study are downloaded from the Gene Expression Omnibus (GEO) database (https://www.ncbi.nlm.nih.gov/geo/query/acc.cgi; GEO accession: GSE38038; GSE126773).