
Figures & data
Figure 1 Sonoanatomy of PENG block. The ultrasonic anatomy of a PENG block (a); Ultrasound anatomy of PENG block after local anesthetic injection (b). Arrow, needle pathway; Area outlined by an ellipse, local anesthetic dissemination.
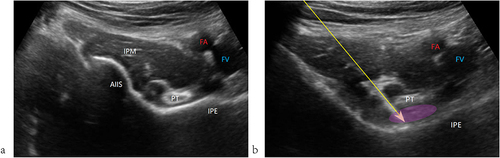
Figure 2 Sonoanatomy of LFCN block. The needle tip was inserted into the fascia tunnel produced by the sartorius and tensor fascia lata. Arrow, needle pathway.
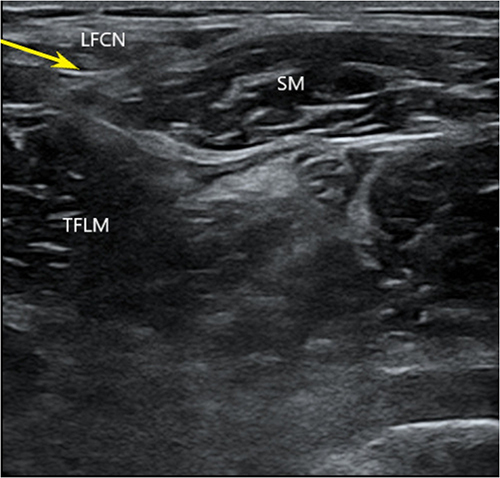
Figure 3 Sonoanatomy of FICB. Arrow, needle pathway.
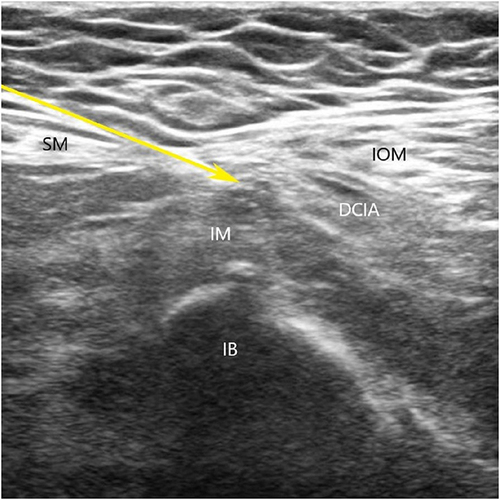
Table 1 Patients’ Demographic Characteristics
Figure 4 The CONSORT flow diagram.
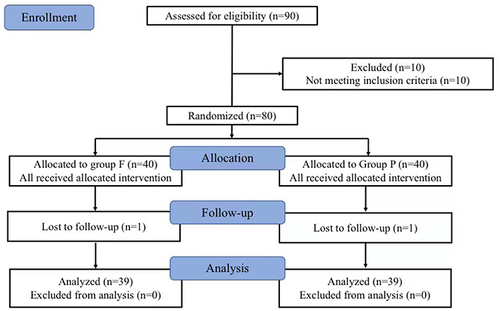
Table 2 Perioperative Medications and Recovery Indicator
Figure 5 Comparison of the muscular strength grading (MMT) (a), the VAS pain score (b) at static and (c) at dynamic, and (d) the quality of sleep (RCSQ) between the two groups. *P <0.05. The violin plots show medians and interquartile ranges. For group P in comparison with group F, the median (95% CI) difference in Pain static at 24 h after block (VAS) was 1 (1–2). For group P in comparison with group F, the median (95% CI) difference in Pain dynamic at 24 h after block (VAS) was 0 (0–0).
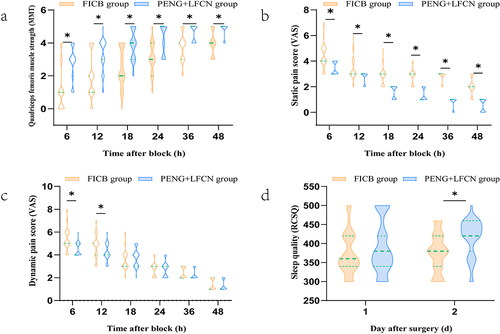
Table 3 Postoperative Adverse Events in Two Group
Data Sharing Statement
The datasets used and/or analyzed during the current study are available from the corresponding author upon reasonable request.