Figures & data
Figure 1 PRISMA flowchart. Adapted from Page MJ, McKenzie JE, Bossuyt PM, et al. The PRISMA 2020 statement: an updated guideline for reporting systematic reviews. J Clin Epidemiol. 2021;134:178–189. Creative Commons.Citation11
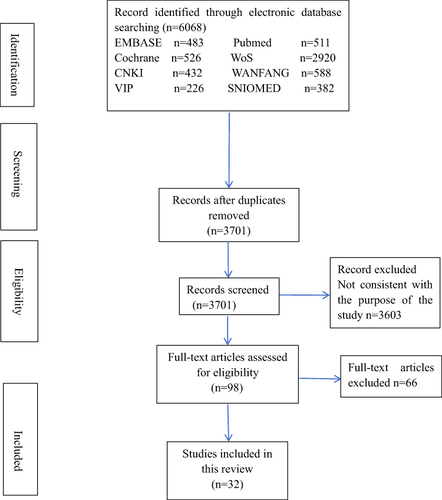
Table 1 Summary of Included Trials Basic Information
Table 2 Summary of Included Trials’ Outcome Measures and Follow-Up Period
Figure 2 Risk of bias graph: review of the authors’ judgments regarding each risk of bias item presented as percentages across all included studies.
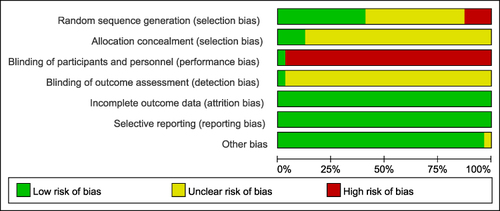
Figure 3 Risk of bias summary: review of the authors’ judgments regarding each risk of bias item in each included study.
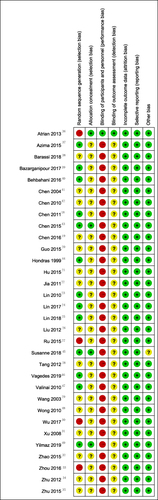
Figure 4 Overall and different follow-up times subgroup forest plot of weighted mean difference (95% CI) for pain intensity for manual therapy versus no treatment.
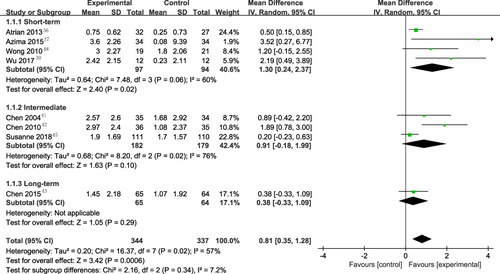
Figure 5 Overall and various manual therapies subgroup forest plot of weighted mean difference (95% CI) for pain intensity for manual therapy versus no treatment.
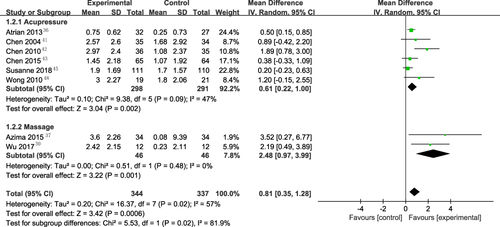
Figure 6 Overall and various manual therapies subgroup forest plot of weighted OR (95% CI) for effective rate for manual therapy versus no treatment.
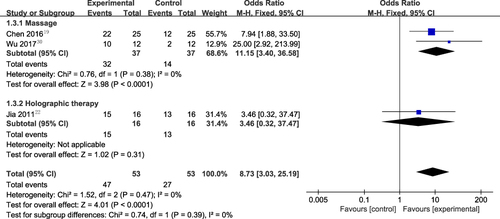
Figure 7 Overall and different follow-up times subgroup forest plot of weighted mean difference (95% CI) for MDQ for manual therapy versus no treatment.
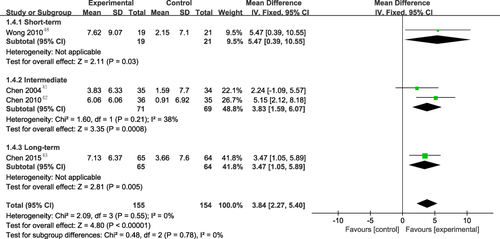
Figure 8 Forest plot of weighted mean difference (95% CI) for pain intensity for manual therapy versus place control.
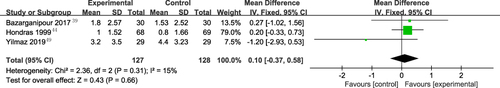
Figure 9 Overall and various manual therapies subgroup forest plot of weighted mean difference (95% CI) for pain intensity for manual therapy versus NSAIDs.
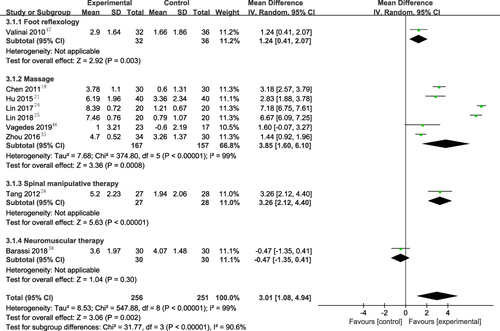
Figure 10 Overall and different follow-up times subgroup forest plot of weighted mean difference (95% CI) for pain intensity for manual therapy versus versus NSAIDs.
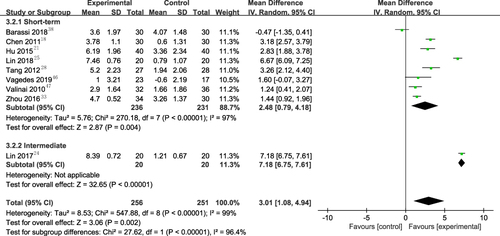
Figure 11 Overall and various manual therapies subgroup forest plot of weighted OR (95% CI) for effective rate for manual therapy versus NSAIDs.
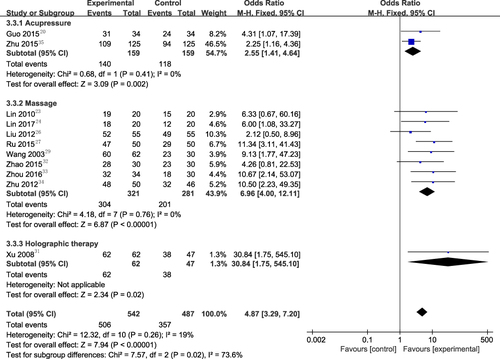
Figure 12 Overall and different follow-up times subgroup forest plot of weighted OR (95% CI) for effective rate for manual therapy versus NSAIDs.
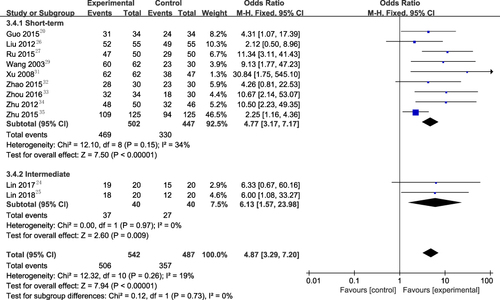
Table 3 Summery of Finding
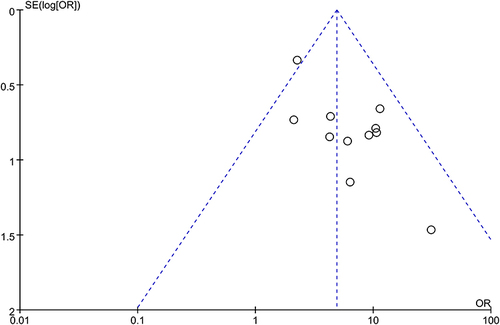
Figure 13 Funnel plot of effective rate for manual therapy versus NSAIDs.