Figures & data
Figure 1 Flowchart of subjects’ selection with addiction in the HELP clinic clinical study.
Note: *MMS score, max 30.
Abbreviations: HELP, Health Evaluation and Linkage to Primary care; MMS, Mini-Mental State.
Abbreviations: HELP, Health Evaluation and Linkage to Primary care; MMS, Mini-Mental State.
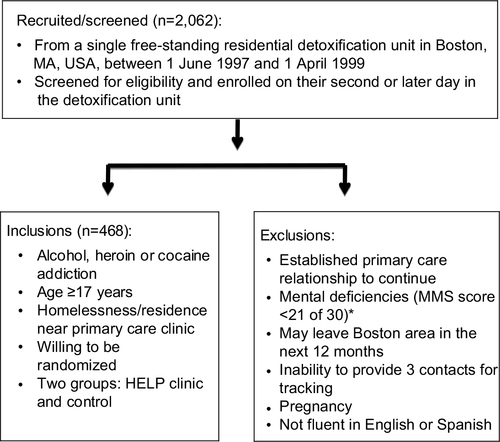
Table 1 Association of Homeless with demographics characteristics and baseline measures for the HELP clinic clinical data
Table 2 Effects of Homeless on PCS using the propensity score adjusted for covariates
short-legendBox 1 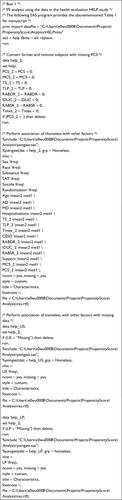
short-legendBox 2 
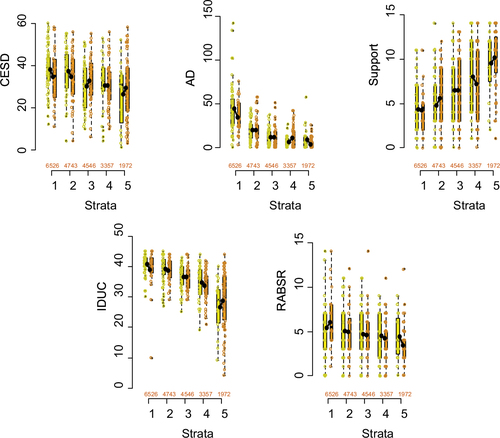
Figure 2 Side-by-side boxplot for the significant continuous covariates (CESD, AD, Support, IDUC, RABSR), which are included in .
Notes: Here yellow colors and brown colors denote the treated (homeless) and untreated (housed) subjects, respectively, the slope of the black lines denotes the expected differences in covariates between the two groups, and the numbers are the sample sizes of the subjects in each of the two groups.
Abbreviations: CESD, center for epidemiologic studies depression measure; AD, average number of drinks consumed per day in the past 30 days; Support, perceived social support by friends; IDUC, inventory of drug use consequences total score; RABSR, risk assessment battery sex risk score.
Abbreviations: CESD, center for epidemiologic studies depression measure; AD, average number of drinks consumed per day in the past 30 days; Support, perceived social support by friends; IDUC, inventory of drug use consequences total score; RABSR, risk assessment battery sex risk score.
short-legendBox 3 
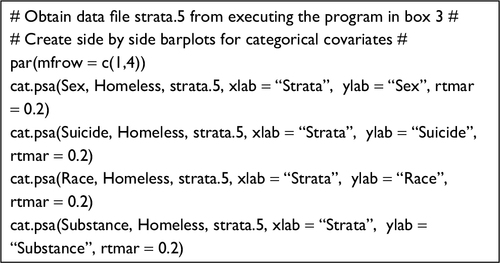
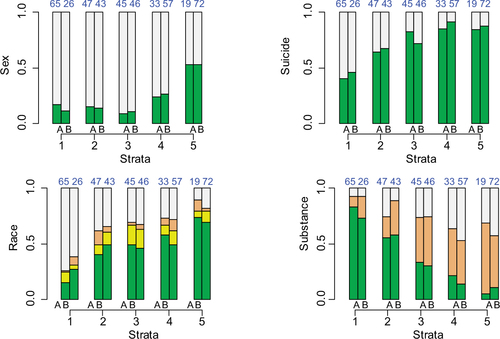
Figure 3 Side-by-side barplots for the significant categorical covariates (sex, Suicide, race, Substance), which are included in .
Note: Here the same colors represent the same level of the variables; A and B represent treated (homeless) and untreated (housed), respectively.
Abbreviations: Suicide, serious thoughts of suicide in last 30 days; Substance, primary substance of abuse.
Abbreviations: Suicide, serious thoughts of suicide in last 30 days; Substance, primary substance of abuse.
short-legendBox 4