Figures & data
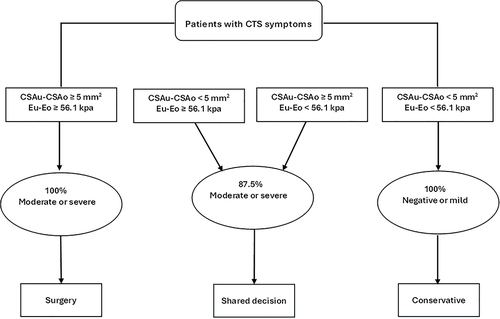
Figure 1 Plots showing (a) mean CSAu and (b) mean CSAu-CSAo of MN among patients classified by EDT findings.
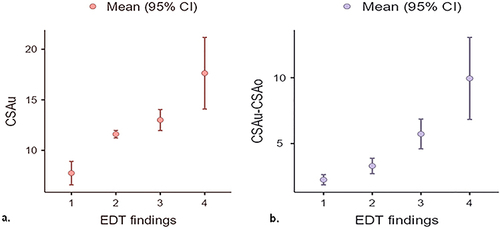
Figure 2 Plots showing (a) mean Eu and (b) mean Eu-Eo of the MN among patients classified by EDT findings.
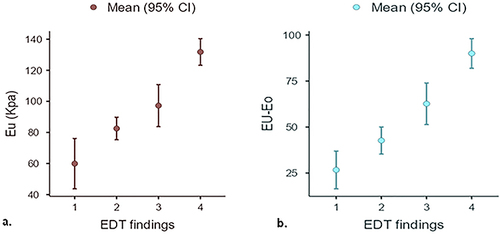
Table 1 Measurements of CSA of MN Among Studied Groups
Table 2 Post-Hoc Analysis of CSA Measurements Among Studied Groups
Table 3 Measurements of E of MN Among Studied Groups
Table 4 Post-Hoc Analysis of E Measurements Among Studied Groups
Table 5 Validity Data of US Findings to Discriminate Between Patients with Severe/Moderate CTS and Those with Mild/No CTS
Figure 3 ROC curve of US measurements to discriminate between patients with severe/moderate CTS and those with mild/no CTS. (a) ROC curve for the CSAu-CSAo measurement. (b) ROC curve for the Eu-Eo measurement.
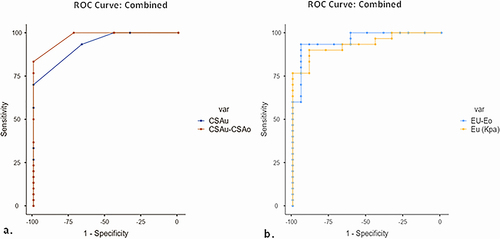
Table 6 Logistic Regression of the Cutoff Points of E and CSA of the MN with the Two Proposed Groups of Patients with CTS
Figure 4 (a) Transverse US image of the median nerve (MN) at the carpal tunnel inlet. The landmarks are the scaphoid (SC) and pisiform (PI). (b) Transverse US image of the MN at the proximal third of the pronator quadratus (PQ).
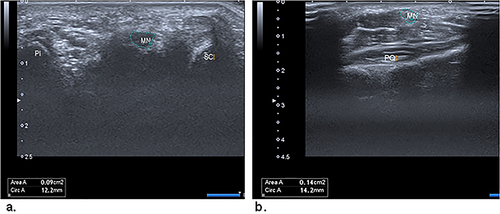
Figure 5 (a) Sagittal US image of the median nerve (MN) in the carpal tunnel. The transducer is parallel to the nerve, and the landmarks are the distal radial epiphysis (RE) and the first (C1) and second (C2) carpal rows. (b) Sagittal US image of the MN in the pronator quadratus (PQ).
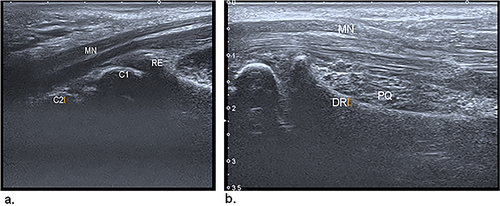
Figure 6 Algorithm proposed for the therapeutic decisions of patients with clinically suspected CTS.