Figures & data
Figure 1 Different cellular composition of pCRC and LM cells. (A) Cellular composition in pCRC. (B) Cellular composition in LM. (C) Dotplot of cell markers expression in pCRC. (D) Dotplot of cell markers expression in LM. (E) Proportion of each cell types in pCRC. (F) Proportion of each cell types in LM. (G) Comparison of the cell proportion of pCRC and LM.
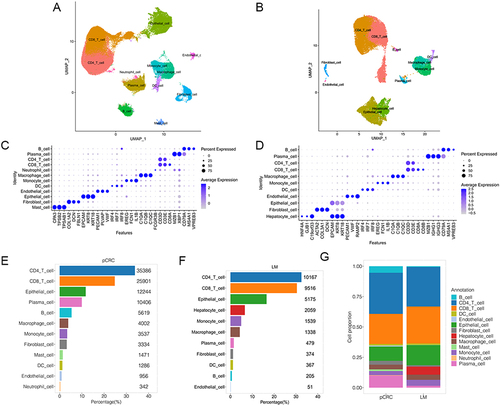
Figure 2 Cellular composition of immune cell subpopulation. (A) UMAP cluster diagram of immune cells. (B) Annotation of immune cells divided into subsets. (C) Proportion of each cell types in immune cells. (D)Native T cell LM vs pCRC GSVA enrichment. (E)CD8 T cell LM vs pCRC GSVA enrichment. (F)CD4 T cell LM vs pCRC GSVA enrichment.
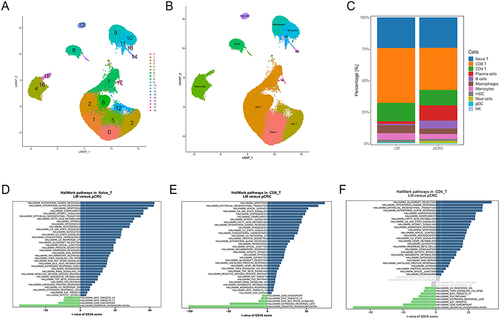
Figure 3 CNV and clonality analysis of malignant cells. (A) InferCNV scoring plot of pCRC epithelial cells. (B) InferCNV scoring plot of LM epithelial cells. (C) Malignant cell ratio plot. (D) InferCNV clones evolutionary trees. (E) Upset plot of genes in metastasis related chromosome in pCRC. (F) Upset plot of genes in metastasis related chromosome in LM. (G) Venn plot of shared genes. (H) GSVA enrichment plot of malignant cells.
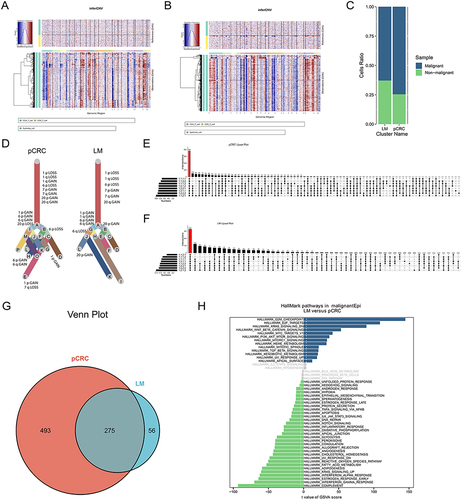
Figure 4 Identification of LMECs by pseudotime analysis. (A) UMAP diagram of malignant epithelial cells in cluster. (B) UMAP diagram of malignant epithelial cells in group. (C-D) Pseudotime diagram of shared subgroups of in pCRC and LM. (E) Heatmap of branch related genes. (F) LM vs pCRC GSVA enrichment of LMECs.
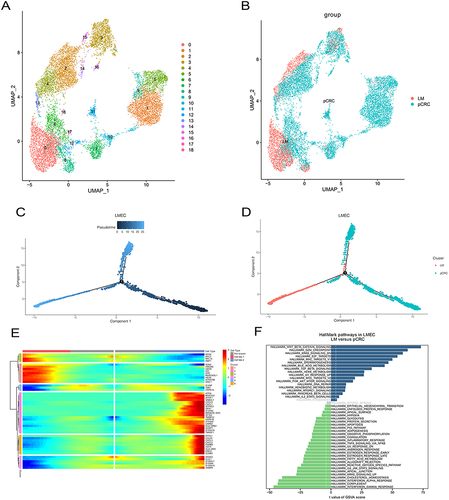
Figure 5 LM-index with metastasis-associated factors and clinical indicators. (A)Venn diagram showing signature gene selection. (B) Risk gene LM-index plotted against different clinical indicators. (C) Survival curves of LM-index corresponding patients. (D) Difference analysis between clinical indicators and LM-index.
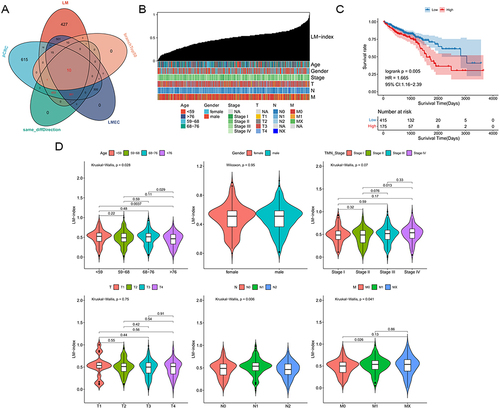
Figure 6 Drug characterization and analysis. (A) Violin plot of predicted IC50 in Lapatinib_1558 with TCGA bulk mRNA data. (B) Violin plot of predicted IC50 in Lapatinib_1558 with scRNA data. (C) Spearman correlation analysis of lapatinib between predicted IC50 and LM-index. (D) Expression of lapatinib targeted gene in TCGA bulk mRNA data. (E) Expression of lapatinib targeted gene in scRNA data.
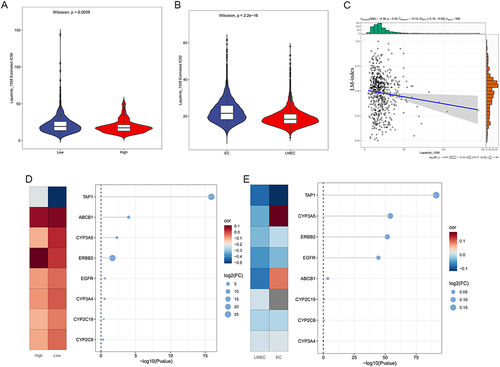
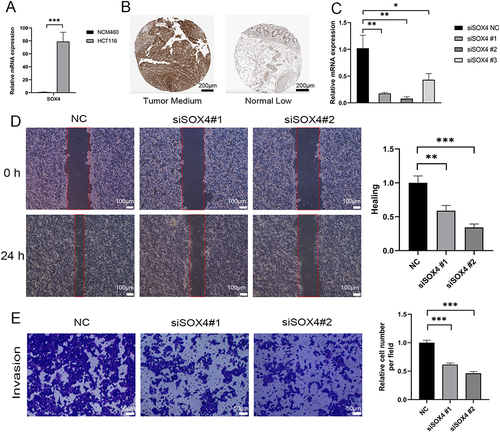
Figure 7 External experimental verification. (A) qPCR validation of SOX4 expression levels in tumor and normal cell lines. (B) IHC staining of protein expression levels of SOX4 in tumor and normal samples (The scale bar is 200 μm). (C) SOX4 silencing in HCT116 cells. (D) Scratch experiments to assess the migratory capacity of siSOX4 (The scale bar is 100 μm). (E) Transwell experiment to assess the invasive capacity of siSOX4. (#1, #2, #3 are three different siSOX4 sequences, p values were shown as: *p<0.05; **p<0.01; ***p<0.001.The scale bar is 50 μm).