Figures & data
Table 1 Components of biodiversity assessment and measurement tools
Table 2 Characteristics of global biodiversity hotspots
Figure 1 Distribution and LULC in biodiversity hotspots.
Notes: (A) Global biodiversity hotspot distribution; (B) Distribution of natural areas in Madagascar as in 2009; (C) land use and land cover in Western Ghats and Sri Lanka in 2009; and (D) land use and land cover in Atlantic Forest in 2009.
Abbreviation: LULC, land use and land cover.
Abbreviation: LULC, land use and land cover.
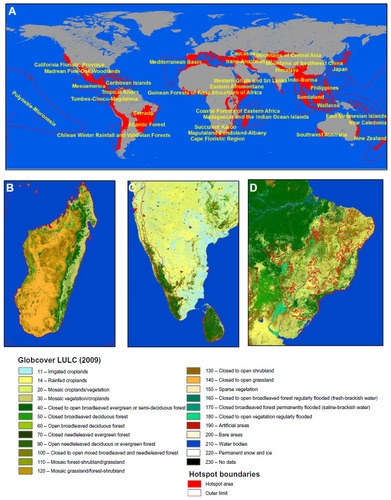
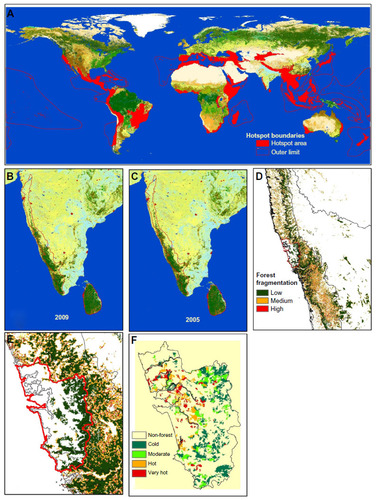
Figure 2 Top-down approach for global biodiversity hotspots monitoring and prioritization.
Notes: (A) global LULC (Globcover) 2009 overlayed with hotspot boundaries; (B) LULC in Western Ghats in 2009; (C) LULC in Western Ghats in 2005; (D) forest fragmentation in Western Ghats 2005; (E) forest fragmentation in Goa, Western Ghats in 2005; and (F) hotspots of LULC change in Goa, Western Ghats in 2005.
Abbreviation: LULC, land use and land cover.
Abbreviation: LULC, land use and land cover.