Figures & data
Table 1 qPCR Primers to Quantify Expression of Genes During the Circadian Rhythm
Table 2 Variation in Transcript Abundance Levels in Bloodstains Collected from a Single Individual at the Same Time on Different Days*
Figure 1 Mean abundance values (expressed as (ΔCq)) for circadian panel transcript markers (labeled atop each row of datapoints in the figure) for each age group of males and females normalized against S100A12 transcript.
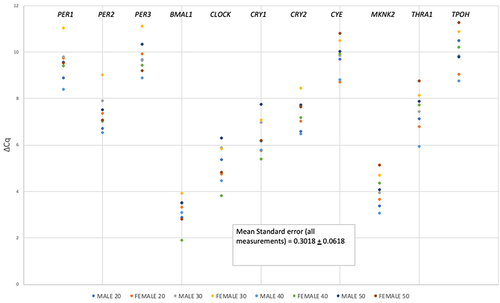
Figure 2 Mean abundance values (expressed as (ΔCq)) for circadian panel transcript markers (labeled atop each row of datapoints in the figure) for each age group of males and females normalized against CLOCK transcript.
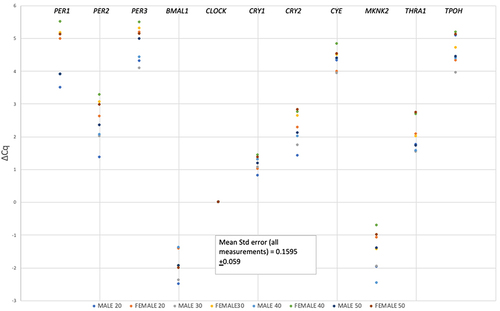
Table 3 Relative Expression of Circadian Rhythm Genes in Blood Stains from Males versus Females with Δcq Values Produced Using S100A12 or CLOCK*
Figure 3 24-hour expression of PER3 (normalized to CLOCK) in blood stains collected from females every 4 hours for 24 hours. Standard error bars indicate the variance in normalized ΔCq values at sample collection times during a 24-hour period.
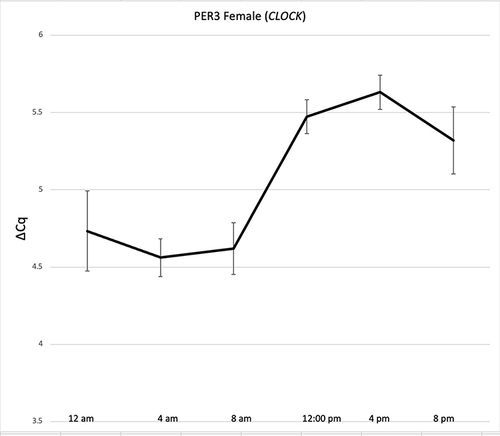
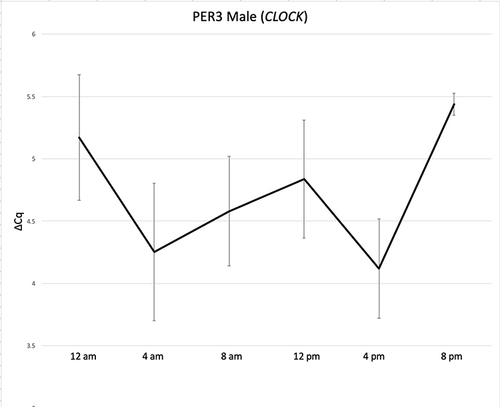
Figure 4 24-hour expression of PER3 (normalized to CLOCK) in blood stains collected from males every 4 hours for 24 hours. Standard error bars indicate the variance in normalized ΔCq values at sample collection times during a 24-hour period. The higher variance of PER3 ΔCq values in males obscures any abundance pattern.