Figures & data
Figure 1. EGFR and LRIG1-3 expressed in tumours of human oesophageal cancer using an immunohistochemical staining procedure. Representative stainings of tumour tissues are shown. a: EGFR, b: LRIG1, c: LRIG2, d: LRIG3. Stainings were visualised at 40×magnification.
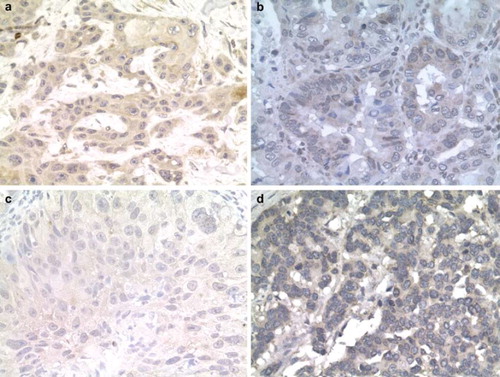
Figure 2a. Kaplan-Meier curves demonstrating the survival differences for patients with different tumour EGFR staining fraction and intensity, graded low or high. b. Kaplan-Meier curve demonstrating the survival differences for patients with different tumour LRIG2 staining fraction and intensity, graded low or high.
Figure 3a–c. Spearman rank order correlations describing significant correlations between expression levels of LRIG1 and chemosensitivity. a. Vinorelbine, R = −0.82 (p = 0.007) b. Docetaxel, R = −0.69 (p = 0.04) c. Cisplatin, R = −0.74 (p = 0.02).
Table I. Description of patient characteristics and survival. Between 1990 and 2000, 126 patients were recorded as having received treatment for oesophageal carcinoma at the Department of Oncology, Uppsala University Hospital, Sweden. Formalin-fixed and paraffin-embedded tumour samples were obtained for immunohistochemical analysis of EGFR and LRIG1-3. The expression (staining extent) of EGFR and LRIG1-3 is expressed as the % of respective immunohistochemical staining score for each category (row) of the variables analysed.
Table II. The RNA expression levels of ERBB1(EGFR) and LRIG1-3 evaluated by quantitative RT-PCR. The mRNA levels were normalised to the 18S rRNA levels in respective samples.
Table III. IC50 values for seven standard cytotoxic drugs for nine ESCC cell lines using the fluorometric microculture cytotoxicity assay (FMCA). All concentrations were tested in duplicates, and the experiments were repeated at least twice. nd = not determined, could not be achieved by experimental conditions or analysed with nonlinear regression curve fit.
Table IV. Spearman rank order correlations between RT-PCR data on indicated receptors and chemosensitivity in vitro. All concentrations were tested in duplicates, and the experiments were repeated at least twice. Marked correlations (bold) are significant at p < 0.05.