Figures & data
Table I. Number of cancers diagnosed 1985–2009 and numbers included/excluded from the analysis. Patients diagnosed incidentally at autopsy or without any information regarding follow-up and patients 90 years or older at diagnosis were excluded from the analysis. Patients with zero survival, but not formally registered as autopsy findings, were included in the analysis.
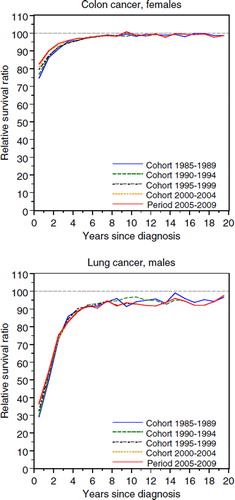
Figure 1. Colon cancer among females (upper panel) and lung cancer among males (lower panel). Interval-specific relative survival curves for period and cohort estimates. Patients less than 90 years of age at diagnosis. (sites chosen for illustrational purpose)

Figure 2. Five-year cumulative relative survival ratios (RSR) estimated for the latest available cohort-based analysis for patients with five years of follow-up in 2004 (patients diagnosed in 1995–1997) and from the period 2000–2002 in the analysis publicised in 2004 [Citation1] and the subsequent cumulative RSRs later observed for the actual cohort of patients diagnosed in 2000–2002 (data shown in ). Males and females less than 90 years of age at diagnosis. Points on the diagonal line represent perfect agreement between the cohort and period estimates and the subsequent true survival.
![Figure 2. Five-year cumulative relative survival ratios (RSR) estimated for the latest available cohort-based analysis for patients with five years of follow-up in 2004 (patients diagnosed in 1995–1997) and from the period 2000–2002 in the analysis publicised in 2004 [Citation1] and the subsequent cumulative RSRs later observed for the actual cohort of patients diagnosed in 2000–2002 (data shown in Table II). Males and females less than 90 years of age at diagnosis. Points on the diagonal line represent perfect agreement between the cohort and period estimates and the subsequent true survival.](/cms/asset/fbca53ae-e7ef-48cd-8126-8e453a263fff/ionc_a_626444_f0002_b.jpg)
Table II. Cumulative relative survival ratios (RSR) estimated from the period 2000–2002 in the analysis publicised in 2004 [Citation1], the latest available cohort-based estimates for patients with 5-years of follow-up in 2004 (patients diagnosed in 1995–1997), and the true cumulative 5-year RSRs later observed for the cohorts of patients diagnosed in 2000–2002. Males and females less than 90 years of age at diagnosis.
Figure 3. Data included in the five-year survival analysis for the period 2000–2002 published in 2004 [Citation1] (thick dashed line) and the latest available cohort-based analysis for patients with five years of follow-up in 2004 (patients diagnosed in 1995–1997, thin solid line), and data for five-year follow-up for the cohort of patients diagnosed in 2000–2002 (thick solid line). Numbers within cells indicate years of follow-up since diagnosis.
![Figure 3. Data included in the five-year survival analysis for the period 2000–2002 published in 2004 [Citation1] (thick dashed line) and the latest available cohort-based analysis for patients with five years of follow-up in 2004 (patients diagnosed in 1995–1997, thin solid line), and data for five-year follow-up for the cohort of patients diagnosed in 2000–2002 (thick solid line). Numbers within cells indicate years of follow-up since diagnosis.](/cms/asset/7e9a876a-935a-4c26-98e8-0d653e724b09/ionc_a_626444_f0003_b.gif)
Table III. Cumulative and interval-specific relative survival ratios (RSR) estimated for the period 2005–2009 and the observed cumulative RSRs for the last available cohort 5-, 10-, 15-, and 20-year survival. Males less than 90 years of age at diagnosis.
Table IV. Cumulative and interval-specific relative survival ratios (RSR) estimated for the period 2005–2009 and the observed cumulative RSRs for the last available cohort 5-, 10-, 15-, and 20-year survival. Females less than 90 years of age at diagnosis.
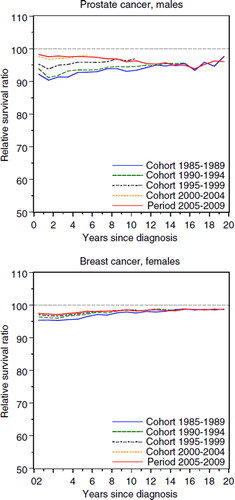
Figure 4. Prostate cancer (upper panel) and breast cancer among females (lower panel). Interval-specific relative survival curves for period and cohort estimates. Patients less than 90 years of age at diagnosis.

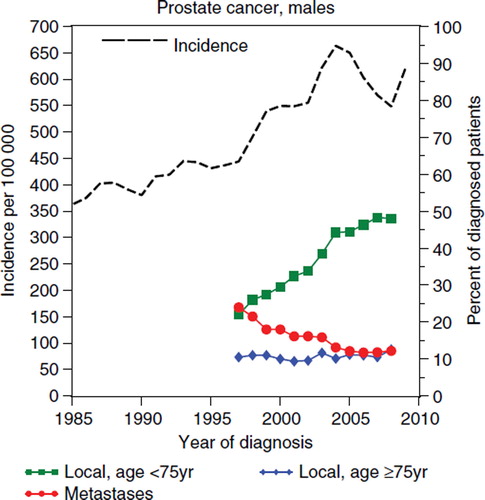
Figure 5. Prostate cancer. Age-standardised incidence per 100 000 for patients age ≥ 50 years at diagnosis, the proportion of patients diagnosed with localised disease with a PSA < 20, age ≤ 75 years and age ≥ 75 years, respectively, and the proportion of patients diagnosed with metastatic disease.
