1,670
Views
5
CrossRef citations to date
0
Altmetric
Research Paper

Cross-organism toxicogenomics with group factor analysis

, , &
Pages 71-80 | Published online: 31 Oct 2014

Figures & data

Figure 1. The model detects drug response patterns that generalize across organisms and are associated to organ-level changes driven by toxicity. Also the biological interpretation of the associations represented by a factor generalizes across organisms: changes at the molecular level are interpretable as a biological process. The “eye diagram” shows identified associations between pathological findings (left) and enriched gene ontology (GO) terms (right), represented by factors of the model (middle). Line widths between pathological findings and factors indicate the magnitude of factor loadings learned by the model. Line widths between factors and GO terms indicate the strength of the enrichment. Associations are shown individually for each organism and factor: organisms are indicated as small nodes attached to the nodes of the factors. Factors are named alphabetically from A to H; organisms are human in vitro (1), rat in vitro (2) and rat in vivo (3).
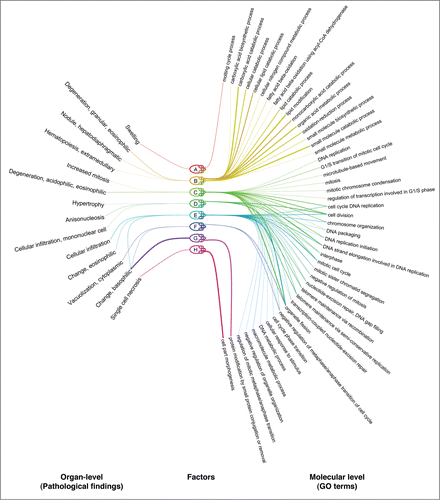
Figure 1. The model detects drug response patterns that generalize across organisms and are associated to organ-level changes driven by toxicity. Also the biological interpretation of the associations represented by a factor generalizes across organisms: changes at the molecular level are interpretable as a biological process. The “eye diagram” shows identified associations between pathological findings (left) and enriched gene ontology (GO) terms (right), represented by factors of the model (middle). Line widths between pathological findings and factors indicate the magnitude of factor loadings learned by the model. Line widths between factors and GO terms indicate the strength of the enrichment. Associations are shown individually for each organism and factor: organisms are indicated as small nodes attached to the nodes of the factors. Factors are named alphabetically from A to H; organisms are human in vitro (1), rat in vitro (2) and rat in vivo (3).

Table 1. An example retrieval result shows notable similarity to the query both by toxic and therapeutic properties

Figure 2. All model organisms are informative of the human population-level risk of toxicity. The figure shows how much information the retrieved similar drugs give about the DILI concern, DILI label and ATC level four class, of the query drug. The figure shows the top-10 mean average precision (y-axis) for each organism (x-axis) when used for the retrieval. Retrieval based on differential expression data gives above-random results for each organism using both the correlation and rank-based similarity measure. For the randomized results, shaded areas indicate the 95% confidence intervals.
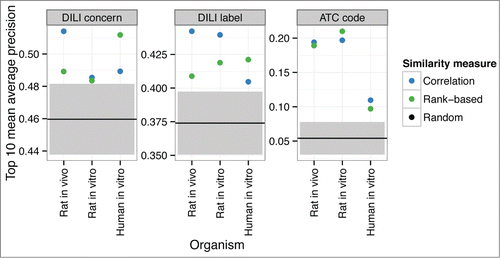
Figure 2. All model organisms are informative of the human population-level risk of toxicity. The figure shows how much information the retrieved similar drugs give about the DILI concern, DILI label and ATC level four class, of the query drug. The figure shows the top-10 mean average precision (y-axis) for each organism (x-axis) when used for the retrieval. Retrieval based on differential expression data gives above-random results for each organism using both the correlation and rank-based similarity measure. For the randomized results, shaded areas indicate the 95% confidence intervals.

Figure 3. GFA-based cross-organism approach leads to a higher performance in the retrieval of similar compounds to a human in vitro query. The figure shows the top-k mean average precision as a function of the number k of retrieved highest-ranking samples. GFA utilizes the cross-organism associations learned from the database while the other methods rely on the human in vitro data only. For the randomized results, shaded areas indicate the 95% confidence intervals.
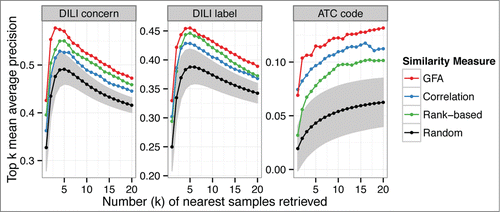
Figure 3. GFA-based cross-organism approach leads to a higher performance in the retrieval of similar compounds to a human in vitro query. The figure shows the top-k mean average precision as a function of the number k of retrieved highest-ranking samples. GFA utilizes the cross-organism associations learned from the database while the other methods rely on the human in vitro data only. For the randomized results, shaded areas indicate the 95% confidence intervals.