
 ?Mathematical formulae have been encoded as MathML and are displayed in this HTML version using MathJax in order to improve their display. Uncheck the box to turn MathJax off. This feature requires Javascript. Click on a formula to zoom.
ABSTRACT
Objective
The Children’s Hope Scale (CHS) is a widely used six-item instrument for assessing hope in children. The CHS is thought to contain two dimensions—agency thinking (ability to initiate and sustain action towards goals) and pathways thinking (capacity to find a means to carry out goals)—but there is debate whether the scale is unidimensional rather than bidimensional and the factor structure has yet to be established in Australian children.
Method
N = 171,052 Australian students (8–18 years of age; 0.3% gender diverse, 48.4% male and 51.3% females) completed the CHS as part of a larger survey examining resilience. Exploratory and confirmatory factor analyses were conducted, and internal consistency was assessed with Cronbach’s alpha.
Results
Bifactor modelling indicated a single-factor structure for the CHS, and the scale demonstrated good internal consistency (Cronbach’s α = .86) and was sensitive to age and gender differences.
Conclusions
Our results suggest that the CHS is unidimensional and supports its use for the measurement of hope in children and adolescents aged 8–18 years of age.
Key Points
What is already known about this topic
(1) Hope is a powerful protective factor in children.
(2) The Children’s Hope Scale (CHS) is widely used to assess hope in older children and adolescents.
(3) There is debate as to whether the CHS is a unidimensional or two-dimensional scale.
What this topic adds
(1) The CHS is a unidimensional scale.
(2) The CHS can be reliably used in children as young as 8 years of age.
(3) It is validated for use in Australian children.
Introduction
Hope and the expectation of a positive future is a powerful protective factor. In children, hope predicts positive development (Edwards et al., Citation2007; Snyder, Citation2002), quality-of-life (Martins et al., Citation2018), psychological wellbeing (Jovanović, Citation2013; Merkaš & Brajša-Žganec, Citation2011; Snyder et al., Citation1997) and academic achievement (Dixson & Stevens, Citation2018; Gilman et al., Citation2006). In their seminal model, Snyder et al. (Citation1991) suggest that hope is a positive motivational state involving one’s ability to generate pathways towards their desired goals (pathways thinking) and the motivation necessary to move towards one’s goals (agency thinking). Snyder (Citation2002) further suggests that while these two components are additive, reciprocal, and positively correlated, they cannot be considered synonymous and are two separate domains. To assess these domains, Snyder (Citation1995) developed the Children’s Hope Scale (CHS), consisting of two subscales with three items each assessing pathway thinking and agency thinking. However, and despite theoretical support, not all psychometric studies report a two-factor solution, raising doubts as to Snyder’s two-dimensional model of hope.
A two-dimensional versus a unidimensional model of hope has several advantages. First, it promises a more nuanced understanding of the concept of hope. Second, it allows for the relationship between dimensions and their unique contributions to the overall construct to be explored. Finally, individual scales might be differentially sensitive to developmental change and external factors and thereby permit the better targeting of interventions: e.g., a child might show improvement in agency thinking but not in pathway thinking, suggesting that interventions could be more effectively targeted towards developing problem-solving skills rather than motivational aspects. Conversely, a two-dimensional model does involve increased complexity, if scales are highly correlated then it does raise the question as to whether two distinct factors truly exist and, finally, because of increased complexity it may yield inconsistent results across different populations (for a discussion on unidimensional versus multidimensional scales see Irribarra & Arneson, Citation2023; Slocum-Gori & Zumbo, Citation2011).
Sixteen (English language) studies were identified that have examined the factor structure of the CHS (see ). Most studies report that a two-factor solution is optimal. However, 10 studies report two-factor solutions but with different item loadings to those suggested by Snyder and colleagues (Edwards et al., Citation2007; Guse et al., Citation2016, Haroz et al., Citation2017; Lei et al., Citation2019; Merkaš & Brajša-Žganec, Citation2011, Lin et al. Citation2023; Metzler et al., Citation2022; Nazam & Husain, Citation2021; Pulido-Martos et al., Citation2014; Shadlow et al., Citation2015), two studies report unsatisfactory two-factor solution goodness of fits (Jovanović, Citation2013; Valle et al., Citation2004) and three studies report two-factor solutions but with item cross-loadings (Haroz et al., Citation2017; Metzler et al., Citation2022; Pulido-Martos et al., Citation2014). In addition, several of the studies supporting a two-factor solution have forced a two-factor solution when testing the model fit (Edwards et al., Citation2007; Guse et al., Citation2016; Jovanović, Citation2013; Marques et al., Citation2009; Pulido-Martos et al., Citation2014; Shadlow et al., Citation2015; Valle et al., Citation2004) while two studies report that the CHS subscales were highly correlated (r > .90) indicating a high proportion of shared variance (Lei et al., Citation2019; Savahl et al., Citation2016). Taken together, these findings have led some authors to recommend that CHS items be treated as a unitary measure (Guse et al., Citation2016; Metzler et al., Citation2022; Savahl et al., Citation2016). In support of this position, six studies report a single-factor solution. However, of these, several forced a single-factor solution (Lei et al., Citation2019; Merkaš & Brajša-Žganec, Citation2011), three did not force a solution but report either item cross loadings (Metzler et al., Citation2022) or four rather than six-item solutions (Dew-Reeves et al., Citation2012; Lei et al., Citation2019), while a single study found that a one-factor solution best fitted Chinese whereas a two-factor solution best fitted US data (Yang et al., Citation2021). Consistent with the latter findings, cross-cultural differences in either the number of factors and/or item loadings have also been reported in other studies (e.g., Guse et al., Citation2016, Haroz et al., Citation2017; Metzler et al., Citation2022; Nazam & Husain, Citation2021; Pulido-Martos et al., Citation2014). Whether a single or two-factor structure best fits the factor structure of the CHS in Australian children is unknown.
Table 1. Recommended factor-structure of Children’s Hope Scale (CHS).
Demographic factors are typically not reported to affect CHS scores. For example, CHS scores are reported neither to change over childhood (e.g., Snyder et al., Citation1997; Valle et al., Citation2006), nor differ according to gender (e.g., Edwards et al., Citation2007; Jovanović, Citation2013; Marques et al., Citation2009). Nevertheless, an age by gender interaction has been reported with a steeper decline in CHS scores reported in post-adolescence girls compared boys (Bernardo, Citation2015). The findings for socioeconomic status (SES) have also been mixed with lower SES associated with lower CHS scores in some (e.g., Lei et al., Citation2019, Savahl et al., Citation2015; Yin et al., Citation2019) but not all studies (e.g., Guse & Vermaak, Citation2011; Valle et al., Citation2004). Given the mixed findings, this points to the need for gender, age and SES to be examined as covariates in any investigation involving the analyses of CHS scores.
In sum, the aim of the current study was to examine the factor structure of the CHS in a large sample of Australian children. It is hypothesised (1) based on the strong relationship between pathway thinking and agency thinking and the findings when a factor structure solution is not forced that the CHS has a single-factor solution. It is further hypothesised that CHS scores will be lower for children from (2) low SES cohorts and will (3) demonstrate a steeper decline with age in females compared to males.
Materials and methods
Participants
This study is based on archival data provided by Resilient Youth Australia which included responses to an omnibus questionnaire assessing psychological wellbeing administered to Australian school students between 2012 and 2018 aged 7–19 years attending grades 3–12. Participating schools and children were anonymised. The questionnaire was administered to 664 government (aka state/public) and non-government (aka private/independent/faith-based) schools located in metropolitan and regional areas of Australia (Australian Capital Territory = 0.03%, New South Wales = 1.2%, Northern Territory = 0.5%, Queensland = 18.1%, South Australia = 6.7%, Tasmania = 3.2%, Victoria = 69.3%, Western Australia = 1.0%).
From an initial sample of 262,301 the following children were excluded from analyses: due to small numbers children from the 2012 survey (N = 266), children ≤7 years (N = 86) and ≥19 years (N = 188), data from schools with <10 students (N = 196), specialist and non-traditional distance education schools (N = 1,747), non-school groups (e.g., scouts N = 792), and cases missing age, SES or gender (N = 3,117). Also, to avoid a child possibly contributing more than once to the analysis, the dataset was restricted to the school grade which did not advance in subsequent years (e.g., if a school provided data for both grade 4 in 2015 and grade 5 in 2016, then the 2016 grade 5 data was excluded; N = 84,943). Student postcode was used to estimate socioeconomic status (SES) based on the Socioeconomic Index for Areas with higher scores indicating higher SES (SEIFA: 1= low SES to 10 = high SES) (Australian Bureau of Statistics, Citation2018). To examine the impact of age, the sample was divided into pre-adolescent (8–11 years), early adolescent (12–14 years) and late adolescent (15–18 years) children. The final dataset with complete CHS and demographic data was available for 171,052 children.
The survey was delivered electronically via an online application and was administered during class time under teacher supervision. The use of archival data for this study was approved by the University of South Australia ethics committee (#204389). School principals approved the survey.
Measures
Children’s Hope Scale
The CHS is a six-item self-report questionnaire assessing hopeful thinking in children and adolescents rated on a 6pt scale (1 = none of the time, 2 = a little of the time, 3 = some of the time, 4 = a lot of the time, 5 = most of the time, 6 = all of the time). The CHS is thought to generate two subscales: agency (“I think I am doing pretty well”, “I am doing just as well as other kids my age”, and “I think the things I have done in the past will help me in the future”) and pathways (“I can think of many ways to get the things in life that are most important to me”, “When I have a problem, I can come up with lots of ways to solve it”, and “Even when others want to quit, I know that I can find ways to solve the problem”). It can also be used to generate a total score, with higher scores indicating high hopefulness. The CHS has been validated in children aged up to 19 years with good convergent validity with measures of happiness (Pulido-Martos et al., Citation2014), satisfaction with life (Edwards et al., Citation2007) and self-worth (Snyder et al., Citation1997). It is also reported to have good internal consistency and test–retest reliability (Valle et al., Citation2004). Estimates of internal reliability (Cronbach’s α) for the CHS range from .71 to .89, with a median of .80 (see ).
Statistical analyses
Data were analysed using STATA 15.1 (StataCorp LLC, USA) and R Studio (2022.02.3, © 2009–2022 RStudio, PBC). Exploratory factor analysis (EFA) and confirmatory factor analysis (CFA) were conducted to examine the dimensionality of the construct of hope and identify the best model fit. Best-practice guidelines suggest that a two-step analytic strategy comprising EFA followed by CFA on a different sample provides a robust approach to scale validation (Worthington & Whittaker, Citation2006). This approach allows for examination of a scale’s factor structure in a new population and where theory is challenged, yet also allows for in-depth exploration of item behaviour in relation to multiple hypothesised models (Loehlin, Citation2004). This two-step strategy has been employed by Snyder et al. (Citation1997) in the development of the CHS, as well as by other authors testing the CHS in different populations (e.g., see Metzler et al., Citation2022).
Preliminary screening revealed that the distribution of all the hope items were normal with no significant skew or kurtosis.
The factor structure of the CHS was initially evaluated using exploratory factor analysis (EFA) using principal axis extraction and promax oblique rotation. The number of factors was determined using an eigenvalue greater than 1.00 (Hayton et al., Citation2004), and using parallel analysis (identifying factors in the dataset with eigenvalues higher than those generated in a simulated dataset) (Çokluk & Koçak, Citation2016; Dinno, Citation2009). Parallel analysis permits for the estimation of factor retention based on simulated data with a comparable size and number of variables to research dataset and therefore does not rely on a generic threshold value for the eigenvalue and provides a more accurate estimate of the number of factors to be retained. Factor loadings and Cronbach are reported for the dataset overall and for age (pre, early, and late adolescent children) and gender (male, female, gender diverse) subgroups.
Confirmatory factor analysis (CFA) using maximum-likelihood estimation was used to examine a single-factor model (Model a), the two-factor structure originally proposed by Snyder et al. (Citation1997) (Model b), and a bifactor model, with a general factor and the two orthogonal latent factors proposed by Snyder et al. (Model c). Model fit was assessed using goodness-of-fit indices including model χ2, comparative fit index (CFI), Root Mean Square Error of Approximation (RMSEA), and the Standardised Root Mean Square Residual (SRMR). The model is considered to be a good fit if CFI > 0.95, and RMSEA and SRMR < 0.08 (Browne & Cudeck, Citation1992). For the bifactor model, reliability was assessed using McDonald’s omega, which quantifies the sum of the squared loadings on the general factor and on all of the factors (McNeish, Citation2018; Viladrich et al., Citation2017). The sums of the squared loadings are used to calculate the explained common variance of the general factor.
Measurement invariance in the different age and gender groupings within the single-actor model (a) was investigated using multigroup factor analysis. In the first step, a configural approach was taken where a separate model was conducted for each age group and, likewise, gender. In the second step, a metric model was conducted specifying equal factor loading and allowing for different intercepts. In the third step, a scalar model was conducted specifying equal factor loadings and intercepts across groups. As recommended, given the large sample size the models were compared using the thresholds obtained from the change in model fit indices (Van de Schoot et al., Citation2012). The R-package psycModel was used to calculate measurement invariance.
Analysis of Covariance (ANCOVA) was used to examine differences in mean CHS scores across age and gender groups, controlling for SES (SEIFA score) with eta-squared effect sizes (η2) reported and Tukey post-hoc tests. A power analysis was conducted using Sample Size Calculator (Citation2022). Based on Valle et al. (Citation2004) total CHS values in US students, it was estimated for the ANCOVA analyses that 35 participants would be required to achieve sufficient power (0.80) at a significance level of α = 0.05 to detect a half a standard deviation difference in CHS scores.
Results
The demographic details and mean (SD) CHS values are reported in . The average age of the sample was just over 12 years, and the mean SEIFA score fell between the sixth and seventh deciles (1 = lowest decile, 10 = highest decile). Thirty-eight percent of participants were pre-adolescents, with 41% early- and 21% late-adolescents. Nearly half of participants identified as male (48%), with 51% identifying as female, and 585 participants who identified as gender diverse (~0.3%). Average age was higher among gender diverse participants. Average CHS ratings were close to 4 (indicating that the positive statements relating to hope described them, “a lot of the time”).
Table 2. Mean (SD) demographics and Children’s Hope Scale (CHS) values according to age and gender.
Factor structure
Interitem correlations ranged from r = 0.46 to 0.57 (). EFA using the eigenvalue threshold of 1.0 and Horn’s parallel analysis (adjusted eigenvalue = 3.50, estimated bias = 0.008) suggested retention of one component. Item loadings ranged from 0.68 to 0.73, and the internal consistency for the scale was robust ( = 0.86). Loadings and
values were relatively consistent across age and gender groups ().
Table 3. Children’s Hope Scale (CHS) inter-item correlations.
Table 4. Internal consistency (Cronbach's alpha) of the unidimensional Children’s Hope Scale (CHS) scale and factor loadings of CHS items according to age and gender.
From the CFA, the single-factor model (a) was associated with significant standardised beta values between 0.69 and 0.73 across the six variables (, ). The two-factor correlated model (b) was associated with similar significant standardised beta values. The correlation between factors in two-factor model (b) was very strong (r = 0.96, , ). The bifactor model (c) showed larger, significant standardised beta values for the global latent factor (Hope) relative to the other two latent factors (Agency and Pathways). The general factor explained 91% of the common variance (, ). All of the model χ2 were significant with consistently good model fit indices for CFI (>0.95) and SRMR (<0.08). RMSEA was significant for the Single Factor and Two-Factor Correlated, but not the Bifactor model ().
Figure 1. Confirmatory factor analysis models with standardised weights (factor loadings) for (a) the single factor model, (b) two-factor correlated model based on Snyder et al. (Citation1997) model, and (c) bifactor model.
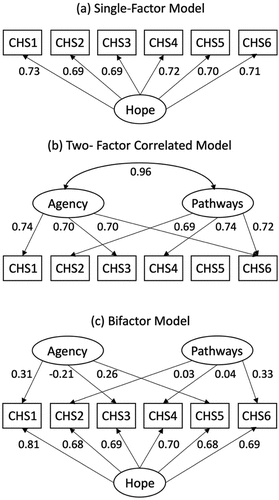
Table 5. Standardised and unstandardised coefficients for confirmatory factor analyses of Children’s Hope Scale models.
Table 6. Summary statistics for confirmatory factor analyses of Children’s Hope Scale models.
Measurement invariance and sensitivity within the single factor Model
For age group and for gender there were significant differences between the metric and configural models, and between the scalar and metric models (p < 0.01). Comparison of model fit indices supported good to excellent measurement metric-invariance and scalar-invariance for Age Group (). For gender, measurement metric-invariance was acceptable to excellent, and scalar-invariance was good to excellent ().
Table 7. Measurement invariance testing for the Children’s Hope-Scale single-factor model for age group and gender.
CHS values tended to increase with SES background: mean (SD) SES 1 (Low) = 3.9 (1.1), 2 = 3.9 (1.0), 3 = 3.9 (1.1), 4 = 3.9 (1.0), 5 = 4.0 (1.0), 6 = 3.9 (1.0), 7 = 4.01 (1.0), 8 = 4.0 (1.0), 9 = 4.1 (1.0) and 10 (High) = 4.2 (0.9). Controlling for SEIFA index (F1, 168550 = 1222.0, p < .001), there were significant effects of age group (F2, 168550 = 1476.0, p < .001, post-hoc: pre > early > late adolescent), and gender (F2, 168550 = 138.6, p < .001, post-hoc: male > female > diverse). The effect size was trivial-small for SEIFA (η2 = 0.007), small for age group (η2 = 0.017), and trivial for gender (η2 = 0.002).
Mean CHS ratings varied by half a point, and standard deviations were approximately one point on the 6-point scale ().
Discussion
The primary aim of this study was to validate the factor structure of the CHS in Australian children. In a large sample of 171,052 children, we found that a one rather than a two-factor solution was the best model fit, thus supporting our first hypothesis. The effect of SES, age and gender on CHS scores were also explored which revealed significant but only small group differences. Consistent with previous studies (Lei et al., Citation2019, Savahl et al., Citation2015; Yin et al., Citation2019), CHS scores were lowest in children from low SES backgrounds supporting our second hypothesis. We also found that CHS scores were highest in pre followed by early and then late adolescent children and higher in male followed by female and then gender diverse children. These trends support previous findings (Bernardo, Citation2015) and our third hypothesis that CHS demonstrates a steeper slope with age in female compared to male children. However, due to the relatively small sample of children identifying as gender diverse, and the fact that they identified as gender diverse at a later age, it is noted that we are unable to isolate the effects of gender from age in the gender diverse group. It is further noted that while significant the SES, age and gender effect sizes were trivial-small.
Several groups have examined one- and two-factor solutions and compared CHS model fits. In the present study, a one-factor solution was the most parsimonious with similar internal consistency values for pre (.83), early (.87) and late (.87) adolescent children thus supporting the use of the CHS in Australian children as young as 8 years. The unidimensional factor structure is consistent with the findings of groups which have tested unconstrained factor solutions or examined factor invariance when undertaking factor analyses in US (Dew-Reeves et al., Citation2012), Croatian (Merkaš & Brajša-Žganec, Citation2011), South Sudanese (Metzler et al., Citation2022), Afrikaan (Savahl et al., Citation2015) and Chinese (Lei et al., Citation2019; Yang et al., Citation2021) children. The very high correlation (r = 0.96) observed between the agency and pathway subscale scores further suggests that the CHS is measuring a single construct. The suitability of a one-factor model indicates that children in this sample may conceptualise hope as a unidimensional concept, rather than discriminating between agency and pathways thinking. In similar studies where the factors were found to be highly correlated and proposed to be indistinguishable from one another, the authors recommended the use of the total CHS score (e.g., Pulido-Martos et al., Citation2014; Savahl et al., Citation2016).
A unidimensional model also raises questions as to the theoretical underpinnings of Snyder’s (1997) two-dimensional model of hope in children. In addition to the psychometric limitations, several authors have criticised the two-dimensional model of hope on theoretical grounds. Aspinwall and Leaf (Citation2002) suggest that Snyder’s model may overemphasise the importance of personal agency, while Carver and Scheier (Citation2002) suggest that Snyder’s theory of hope overlaps with theories of optimism and, moreover, inspection of the CHS items suggests that they measure optimism and self-worth rather than distinct agency and pathways components. More recently, Kern et al. (Citation2020) have suggested that hope theory be expanded and further developed by analysing how the lived experience of hope in young people is informed and thereby takes into consideration contextual and dynamic influences on thriving. Rose (Citation2022) in their review of measurement structures of hope emphasises that some populations may perceive hope holistically, with no differentiation between agency and pathways thinking, which may explain why hope and as a consequence the CHS factor structure may differ between collectivist and individualistic cultures and why a unidimensional model is reported more often in children from collectivist cultures (e.g., see Lei et al., Citation2019; Savahl et al., Citation2016; Yang et al., Citation2021).
Multigroup Factor Analyses revealed that the level of measurement invariance across age and gender groups was tenable. Specifically, comparison of the change in fit indices for age revealed that they ranged from good to excellent while those for gender ranged from acceptable to excellent measurement invariance. Examination of age revealed that CHS scores were highest in pre-adolescent children, followed by a small decline in early adolescence, particularly in females – an interaction that is consistent with previous literature (Bernardo, Citation2015; Heaven & Ciarrochi, Citation2008). An explanation for the trend is unclear in females, but Hendricks-Ferguson (Citation2006) suggest that gender-based experiences and stereotypes faced by girls may underlie the post-adolescent fall in hope. The age-by-gender interaction for hope in females mirrors a similar trend reported more generally for psychological wellbeing (Campbell et al., Citation2021; Wade et al., Citation2002). As previously noted, while significant the age and gender differences were very small in magnitude and therefore need to be treated with caution. A similar conclusion can be made when examining Venning et al. (Citation2009) findings for Snyder’s Adult Hope Scale which was administered to 3,913 Australian teenagers aged 13–17 years. Venning and colleagues report a significant main effect for hope with age but not gender and no significant age by gender interaction; however, the effect size for age in that study were also trivial-small in magnitude. Moreover, and broadly similar to the present findings that hope falls in late adolescent females, inspection of the values reported by Venning and colleagues also indicate a fall in hope values after 15 years in females, whereas for males values continued to increase and then plateaued at 17 years.
This is one of the first studies to explore hope in gender diverse children. We found that gender diverse children had the lowest CHS scores. Consistent with the latter finding, psychological wellbeing is typically lower in gender diverse children compared to cisgender children, particularly following puberty (Clark et al., Citation2014; Connolly et al., Citation2016).
The study has several potential limitations. First, the majority of participating schools were located in Victoria, and as such, the sample might not be representative of all Australian children and adolescents. Second, it was a sample of convenience and not a randomised study. Finally, it was a cross-sectional study with all the biases attendant to that methodology. Despite these limitations, the strength of the present study is that included a large number of Australian children from 634 different schools and 3,479 suburbs from metropolitan and regional areas with varied socio-economic backgrounds.
In summary, the current study presents a large-scale investigation of the CHS across three age cohorts, establishing it as a suitable measure of hopeful thinking in Australian children and adolescents aged 8–18 years. Contrary to the proposed two-factor structure for the CHS, our findings support a single-factor model in Australian children. It is proposed that the unidimensional model has sufficient psychometric properties to support its use as a critical tool to measure hope in clinical practice and Australian schools.
Disclosure statement
No potential conflict of interest was reported by the author(s).
Data availability statement
The data that support the findings of this study are available from https://resilientyouth.org/. Restrictions apply to the availability of these data, which were used under licence for this study.
Additional information
Funding
References
- Aspinwall, L., & Leaf, S. (2002). In search of the unique aspects of hope: pinning our hopes on positive emotions, future-oriented thinking, hard times, and other people. Psychological Inquiry, 13(4), 276–10. https://doi.org/10.1207/S15327965PLI1304_02
- Australian Bureau of Statistics. (2018). Socio-economic indexes for areas (SEIFA) 2016. https://www.abs.gov.au/ausstats/[email protected]/mf/2033.0.55.001
- Bernardo, A. B. (2015). Hope in early adolescence: Measuring internal and external locus-of-hope. Child Indicators Research, 8(3), 699–715. https://doi.org/10.1007/s12187-014-9254-6
- Browne, M. W., & Cudeck, R. (1992). Alternative ways of assessing model fit. Clinical & Diagnostic Laboratory Immunology, 7(2), 161–167. https://doi.org/10.1177/0049124192021002005
- Campbell, O. L., Bann, D., & Patalay, P. (2021). The gender gap in adolescent mental health: A cross-national investigation of 566,829 adolescents across 73 countries. SSM-Population Health, 13, 100742. https://doi.org/10.1016/j.ssmph.2021.100742
- Carver, C. S., & Scheier, M. F. (2002). Optimism. In C. R. Snyder & S. J. Lopez (Eds.), Handbook of positive psychology (pp. 231–243). Oxford University Press.
- Clark, T. C., Lucassen, M. F. G., Bullen, P., Denny, S. J., Fleming, T. M., Robinson, E. M., & Rossen, F. V. (2014). The health and well-being of transgender high school students: Results from the New Zealand Adolescent health Survey (Youth’12). Journal of Adolescent Health, 55(1), 93–99. https://doi.org/10.1016/j.jadohealth.2013.11.008
- Çokluk, Ö., & Koçak, D. (2016). Using Horn’s parallel analysis method in exploratory factor analysis for determining the number of factors. Educational Sciences: Theory & Practice, 16(2), 537–551. https://doi.org/10.12738/estp.2016.2.0328
- Connolly, M. D., Zervos, M. J., Barone, C. J., Johnson, C. C., & Joseph, C. L. M. (2016). The mental health of transgender youth: Advances in understanding. Journal of Adolescent Health, 59(5), 489–495. https://doi.org/10.1016/j.jadohealth.2016.06.012
- Dew-Reeves, S. E., Athay, M. M., & Kelley, S. D. (2012). Validation and use of the Children’s Hope Scale-revised PTPB edition (CHS-PTPB): High initial youth hope and elevated baseline symptomatology predict poor treatment outcomes. Administration and Policy in Mental Health and Mental Health Services Research, 39(1–2), 60–70. https://doi.org/10.1007/s10488-012-0411-2
- Dinno, A. (2009). Implementing Horn’s parallel analysis for principal component analysis and factor analysis. The Stata Journal: Promoting Communications on Statistics and Stata, 9(2), 291–298. https://doi.org/10.1177/1536867X0900900207
- Dixson, D. D., & Stevens, D. (2018). A potential avenue for academic success: Hope predicts an achievement-oriented psychosocial profile in African American adolescents. Journal of Black Psychology, 44(6), 532–561. https://doi.org/10.1177/0095798418805644
- Edwards, L. M., Ong, A. D., & Lopez, S. J. (2007). Hope measurement in Mexican American youth. Hispanic Journal of Behavioral Sciences, 29(2), 225–241. https://doi.org/10.1177/0739986307299692
- Gilman, R., Dooley, J., & Florell, D. (2006). Relative levels of hope and their relationship with academic and psychological indicators among adolescents. Journal of Social and Clinical Psychology, 25(2), 166–178. https://doi.org/10.1521/jscp.2006.25.2.166
- Guse, T., de Bruin, G. P., & Kok, M. (2016). Validation of the Children’s Hope Scale in a sample of South African adolescents. Child Indicators Research, 9(3), 757–770. https://doi.org/10.1007/s12187-015-9345-z
- Guse, T., & Vermaak, Y. (2011). Hope, psychosocial well-being and socioeconomic status among a group of South African adolescents. Journal of Psychology in Africa, 21(4), 527–533. https://doi.org/10.1080/14330237.2011.10820493
- Haroz, E. E., Jordans, M., de Jong, J., Gross, A., Bass, J., & Tol, W. (2017). Measuring hope among children affected by armed conflict: Cross-cultural construct validity of the Children’s Hope Scale. Assessment, 24(4), 528–539. https://doi.org/10.1177/1073191115612924
- Hayton, J. C., Allen, D. G., & Scarpello, V. (2004). Factor retention decisions in exploratory factor analysis: A tutorial on parallel analysis. Organizational Research Methods, 7(2), 191–205. https://doi.org/10.1177/1094428104263675
- Heaven, P., & Ciarrochi, J. (2008). Parental styles, gender and the development of hope and self‐esteem. European Journal of Personality, 22(8), 707–724. https://doi.org/10.1002/per.699
- Hendricks-Ferguson, V. (2006). Relationships of age and gender to hope and spiritual well-being among adolescents with cancer. Journal of Pediatric Oncology Nursing, 23(4), 189–199. https://doi.org/10.1177/1043454206289757
- Irribarra, D. T., & Arneson, A. E. (2023). The challenge of defining and interpreting dimensionality in educational and psychological assessments. Measurement, 221, 113430. https://doi.org/10.1016/j.measurement.2023.113430
- Jovanović, V. (2013). Evaluation of the Children’s Hope Scale in Serbian adolescents: Dimensionality, measurement invariance across gender, convergent and incremental validity. Child Indicators Research, 6(4), 797–811. https://doi.org/10.1007/s12187-013-9195-5
- Kern, M. L., Williams, P., Spong, C., Colla, R., Sharma, K., Downie, A., Taylor, J. A., Sharp, S., Siokou, C., & Oades, L. G. (2020). Systems informed positive psychology. Journal of Positive Psychology, 15(6), 705–715. https://doi.org/10.1080/17439760.2019.1639799
- Lei, H., Wang, Z., Peng, Z., Yuan, Y., & Li, Z. (2019). Hope across socioeconomic status: Examining measurement invariance of the Children’s Hope Scale across socioeconomic status groups. Frontiers in Psychology, 10, 2593. https://doi.org/10.3389/fpsyg.2019.02593
- Lin, H., Cox, R. B., Jr., Sahbaz, S., Washburn, I. J., Larzelere, R. E., & Greder, K. A. (2023). Hope for Latino immigrant youth: A longitudinal test of Snyder’s Children’s Hope Scale. Family Relations, 72(3), 697–718. https://doi.org/10.1111/fare.12651
- Loehlin, J. C. (2004). Latent variable models: An introduction to factor, path, and structural equation analysis. Psychology Press.
- Marques, S. C., Pais-Ribeiro, J. L., & Lopez, S. J. (2009). Validation of a Portuguese version of the Children’s Hope Scale. School Psychology International, 30(5), 538–551. https://doi.org/10.1177/0143034309107069
- Martins, A. R., Crespo, C., Salvador, Á., Santos, S., Carona, C., & Canavarro, M. C. (2018). Does hope matter? Associations among self-reported hope, anxiety, and health-related quality of life in children and adolescents with cancer. Journal of Clinical Psychology in Medical Settings, 25(1), 93–103. https://doi.org/10.1007/s10880-018-9547-x
- McNeish, D. (2018). Thanks coefficient alpha, we’ll take it from here. Psychological Methods, 23(3), 412. https://doi.org/10.1037/met0000144
- Merkaš, M., & Brajša-Žganec, A. (2011). Children with different levels of hope: Are there differences in their self-esteem, life satisfaction, social support, and family cohesion? Child Indicators Research, 4(3), 499–514. https://doi.org/10.1007/s12187-011-9105-7
- Metzler, J., Zhang, Y., Saw, T., Leu, C.-S., & Landers, C. (2022). Measuring hope: Psychometric properties of the Children’s Hope Scale among South Sudanese refugee children. Child Psychiatry and Human Development, 17(2), 1–7. https://doi.org/10.1007/s10578-022-01327-6
- Nazam, F., & Husain, A. (2021). Psychometric revalidation of Children’s Hope Scale among Indian adolescents. Asia-Pacific Social Science Review, 21(1), 188–194.
- Pulido-Martos, M., Jiménez-Moral, J. A., Lopez-Zafra, E., & Ruiz, J. R. (2014). An adaptation of the Children’s Hope Scale in a sample of Spanish adolescents. Child Indicators Research, 7(2), 267–278. https://doi.org/10.1007/s12187-013-9223-5
- Rose, S. (2022). Measurement structures of hope: A review of single-factor and two-factor models across hope scales. Current Opinion in Psychology, 48, 101488. https://doi.org/10.1016/j.copsyc.2022.101488
- Sample Size Calculator, C. (2022). Sample size calculator. https://clincalc.com/stats/samplesize.aspx
- Savahl, S., Casas, F., & Adams, S. (2016). Validation of the Children’s Hope Scale amongst a sample of adolescents in the Western Cape Region of South Africa. Child Indicators Research, 9(3), 701–713. https://doi.org/10.1007/s12187-015-9334-2
- Shadlow, J. O., Boles, R. E., Roberts, M. C., & Winston, L. (2015). Native American children and their reports of hope: Construct validation of the Children’s Hope Scale. Journal of Child and Family Studies, 24(6), 1707–1714. https://doi.org/10.1007/s10826-014-9974-8
- Slocum-Gori, S. L., & Zumbo, B. D. (2011). Assessing the unidimensionality of psychological scales: Using multiple criteria from factor analysis. Social Indicators Research, 102(3), 443–461. https://doi.org/10.1007/s11205-010-9682-8
- Snyder, C. R. (1995). Conceptualizing, measuring, and nurturing hope. Journal of Counseling and Development, 73(3), 355–360. https://doi.org/10.1002/j.1556-6676.1995.tb01764.x
- Snyder, C. R. (2002). Hope theory: Rainbows in the mind. Psychological Inquiry, 13(4), 249–275. https://doi.org/10.1207/S15327965PLI1304_01
- Snyder, C. R., Harris, C., Anderson, J. R., Holleran, S. A., Irving, L. M., Sigmon, S. T., Yoshinobu, L., Gibb, J., Langelle, C., & Harney, P. (1991). The will and the ways: Development and validation of an individual-differences measure of hope. Journal of Personality and Social Psychology, 60(4), 570–585. https://doi.org/10.1037/0022-3514.60.4.570
- Snyder, C. R., Hoza, B., Pelham, W. E., Rapoff, M., Ware, L., Danovsky, M., Highberger, L., Ribinstein, H., & Stahl, K. J. (1997). The development and validation of the Children’s Hope Scale. Journal of Pediatric Psychology, 22(3), 399–421. https://doi.org/10.1093/jpepsy/22.3.399
- Valle, M. F., Huebner, E. S., & Suldo, S. M. (2004). Further evaluation of the Children’s Hope Scale. Journal of Psychoeducational Assessment, 22(4), 320–337. https://doi.org/10.1177/073428290402200403
- Valle, M. F., Huebner, E. S., & Suldo, S. M. (2006). An analysis of hope as a psychological strength. Journal of School Psychology, 44(5), 393–406. https://doi.org/10.1016/j.jsp.2006.03.005
- Van de Schoot, R., Lugtig, P., & Hox, J. (2012). A checklist for testing measurement invariance. European Journal of Developmental Psychology, 9(4), 486–492. https://doi.org/10.1080/17405629.2012.686740
- Venning, A. J., Eliott, J., Kettler, L., & Wilson, A. (2009). Normative data for the hope scale using Australian adolescents. Australian Journal of Psychology, 61(2), 100–106. https://doi.org/10.1080/00049530802054360
- Viladrich, C., Angulo-Brunet, A., & Doval, E. (2017). A journey around alpha and omega to estimate internal consistency reliability. Annals of Psychology, 33(3), 755–782. https://doi.org/10.6018/analesps.33.3.268401
- Wade, T. J., Cairney, J., & Pevalin, D. J. (2002). Emergence of gender differences in depression during adolescence: National panel results from three countries. Journal of the American Academy of Child and Adolescent Psychiatry, 41(2), 190–198. https://doi.org/10.1097/00004583-200202000-00013
- Worthington, R. L., & Whittaker, T. A. (2006). Scale development research: A content analysis and recommendations for best practices. The Counseling Psychologist, 34(6), 806–838. https://doi.org/10.1177/0011000006288127
- Yang, Q., Ling, Y., Huebner, E. S., Zeng, Y., & Liu, C. (2021). Assessing the measurement invariance of the Children’s Hope Scale in Chinese and American adolescents. Journal of Personality Assessment, 103(2), 195–203. https://doi.org/10.1080/00223891.2019.1693387
- Yin, X., Li, Z., Yuan, Y., & Wang, Z. (2019). Developmental trajectory of hope among late-adolescents: Population heterogeneity and the impact of gender and family socioeconomic status. Journal of Adolescence, 72(1), 124–131. https://doi.org/10.1016/j.adolescence.2019.03.00