
 ?Mathematical formulae have been encoded as MathML and are displayed in this HTML version using MathJax in order to improve their display. Uncheck the box to turn MathJax off. This feature requires Javascript. Click on a formula to zoom.
Abstract
Here, we present a retrospective study on honey bee brood diseases in the USA. The Bee Disease Diagnostic Laboratory (BDDL) in the USDA-ARS Beltsville Bee Research Laboratory received a total of 4790 brood samples between 2015 and 2022 from U.S. State Apiary Inspectors and beekeepers. Samples from 49 states were analyzed by microscopy for the presence and prevalence of two bacteria, Melissococcus plutonius and Paenibacillus larvae, causing European foulbrood (EFB) and American foulbrood (AFB) diseases, respectively. Samples that tested positive for AFB were cultured and subjected to antibiotic susceptibility tests via the agar disc diffusion method to determine their resistance to tetracycline (Terramycin®) and tylosin (Tylan®) antibiotics. A comprehensive data analysis was conducted at multiple levels, including state, month, year, nationwide, and climate region. Among the 49 states examined, EFB was identified in 44 states, while AFB was found in 31 states. Infection levels vary across states, ranging from 0% to 63.6% for EFB and from 0% to 54.8% for AFB. The national average of EFB (19.2%) was significantly (p < 0.001) higher than AFB (8.6%). Contrary to AFB, significant yearly increases (p < 0.001) were identified for EFB from 2015 to 2022. Furthermore, significant monthly variations were recorded for both brood diseases, with the highest occurrence of EFB observed from April to July. States with the lowest infection rates of both diseases were NV, ND, MS, AK, and AZ. The South U.S. climate region, which comprises six states, had the highest and lowest EFB and ABF infections, respectively. On a nationwide scale, the AFB resistance to tetracycline (38%) was significantly (p < 0.001) higher than the resistance to tylosin (27%).
Introduction
The decline in honey bee (Apis mellifera L.) populations has raised concerns about the future of pollination and food production (Watanabe, Citation1994; Biesmeijer et al., Citation2006). Honey bee colonies both in the USA and globally, face a myriad of challenges, including diseases, pests, and environmental stressors, such as pesticide exposure, loss of habitat, insufficient forage, and the impacts of climate change, all of which adversely affect their performance and survival (Chen et al., Citation2008; Goulson et al., Citation2015; Alburaki et al., Citation2017). In the United States alone, the value of pollination services rendered by honey bees is estimated at approximately US$17 billion annually, while the global figure reaches an impressive US$215 billion (Calderone, Citation2012; Smith et al., Citation2013). However, the sustainability of these invaluable services is under threat, as evidenced by long-term declines in honey bee colony populations. Specifically, reports indicate a worrying decrease of 25% in European honey bee colonies and an even more concerning 60% reduction in U.S. colonies (Potts et al., Citation2010; Smith et al., Citation2013). Among the challenges, diseases present a specific and significant threat to bee health. In the United States, beekeepers have identified a complex web of factors responsible for the majority of honey bee colony losses. These factors include infestations by Varroa mites, various diseases, starvation, queen failure, and adverse weather events. However, pinpointing the exact contribution of diseases to these losses presents a significant challenge. This difficulty arises largely because rigorous health surveillance is often not conducted within these colonies before their decline. Without such detailed health assessments, understanding the specific impacts of diseases on colony health and survival remains elusive, complicating efforts to address and mitigate these losses effectively (Smith et al., Citation2013). A recent investigation has shed light on a concerning issue: the low genetic diversity within honey bee populations across the United States (Alburaki et al., Citation2023). This limited genetic variation could potentially heighten the susceptibility of honey bees to diseases, amplifying the economic impact and losses associated with colony decline.
Honey bee colonies are susceptible to multiple bacterial and fungal brood diseases, including American foulbrood (AFB), European foulbrood (EFB), Chalkbrood, and Stonebrood (ABC, Citation2020). Among these, AFB, caused by a gram-positive, spore-forming bacterium Paenibacillus larvae is regarded as the most serious honey bee bacterial disease worldwide (Peters et al., Citation2006; Fünfhaus et al., Citation2019; Zabrodski et al., Citation2020). AFB is highly contagious and can spread rapidly through a colony. Infected brood cells become dark and sunken and emit a foul odor. The bacteria can be transmitted through adult bees via swarming, drifting, foraging activity, beekeeper-contaminated equipment, or exchange of hive equipment and materials between colonies or apiaries (Lindström et al., Citation2008). Bacterial spores can remain viable in honey and wax for many years, making it challenging to eradicate (Haseman, Citation1961; Schuch et al., Citation2001). EFB, however, is caused by the bacterium Melissococcus plutonius, also affects bee brood (Forsgren, Citation2010). Infected EFB larvae exhibit discoloration, twisting and may die before reaching maturity. Unlike AFB, EFB is less contagious and does not produce spores that can survive in honey or wax for extended periods. Nonetheless, the bacterial transmission routes of EFB are similar to those described for AFB (Erban et al., Citation2017). In the USA, treatment for AFB typically involves the administration of antibiotics, such as tetracycline (Terramycin®), a broad-spectrum antibiotic (Kochansky et al., Citation2001) and tylosin (Tylan®), an antibiotic of the macrolide class (Elzen et al., Citation2002). It is important to note that absence of clinical symptoms does not preclude the absence of AFB, as colonies may still contain significant spore density (Fries et al., Citation2006). EFB treatment may involve the use of antibiotics as well as other drug-free options (Budge et al., Citation2010; Gahtori et al., Citation2011; Vezeteu et al., Citation2017). Antibiotic treatment is only applied when clinical signs of the disease are observed on larvae and must be administered under the guidance of a veterinarian. It’s crucial to avoid the overuse or misuse of antibiotics as this can contribute to antibiotic resistance and other adverse effects on bee health (Evans, Citation2003). Antibiotic residues have been identified in honey, which also carries potential implications for human health (Lopez et al., Citation2008). A recent study demonstrated that exposure to field-realistic concentrations of tylosin impact honey bee microbiota and increase honey bees’ susceptibility to pathogens (Powell et al., Citation2021). To prevent brood diseases, it is generally advisable to maintain healthy and strong colonies through good beekeeping practices, such as regular hive inspections, proper nutrition, and the maintenance of a clean and hygienic hive environment.
Diagnosis of both AFB and EFB is traditionally conducted by identification of typical clinical symptoms of the diseases by beekeepers and inspectors, microscopical analysis of diseased brood, and culture of P. larvae in the case of AFB (de Graaf et al., Citation2006). The Bee Disease Diagnostic Service at the USDA-ARS Bee Research Laboratory (Beltsville, MD) was formed in 1891, with a focus on the diagnosis of AFB disease. Since its inception, this service has provided a free-of-charge disease diagnostic for beekeepers and state and federal agencies across the USA. In this study, we extracted diagnostic data from the Bee Disease Diagnosis database spanning from 2015 to 2022. This study presents an extensive epidemiological evaluation of the prevalence, spread, and antibiotic resistance patterns of brood diseases in bee populations across various US states over an eight-year timeframe. Our analysis, based on samples obtained from colonies exhibiting symptoms, reveals significant geographical and temporal fluctuations in the occurrence and prevalence of both American and European foulbrood diseases.
Materials and methods
Honey bee brood samples
All brood samples analyzed in this study originated from symptomatic colonies. Samples were sent to the USDA-ARS Beltsville Bee Research laboratory either by State Apiary Inspectors or beekeepers. Samples to be tested were sent in the form of 2 × 2 inch sections from the suspected diseased brood area, smears made with cotton swabs from the suspected diseased cells and, in rare occasions, full brood frames. Brood samples were visually examined in the laboratory for brood disease symptoms, and infected cells were subsampled using sterile cotton swabs. Individual swabs of symptomatic brood were transferred to sterile tubes containing 5 mL of distilled water to generate brood cell suspensions. One single suspension was generated for each analyzed sample.
Microscopical identification of brood diseases
One drop of the suspension was placed on a glass microscope slide using a sterile cotton swab using the hanging drop method (Shimanuki & Knox, Citation2000; Milbrath et al., Citation2021) and placed under a heat lamp until dried. The fixed sample was stained with one drop of carbol fuchsin stain for 10 s (Milbrath et al., Citation2021). This stain was composed of 0.3 g of basic fuchsin (90% dye content), 10 mL ethyl alcohol (95%), 5 g phenol, and 95 mL distilled water. Excess stain was gently washed from the cover slide, and the latter was placed on a standard microscope slide coated with a thin layer of microscope immersion oil. Slides were examined using a compound microscope with an immersion oil objective at 1000 X magnification (Shimanuki & Knox, Citation1988). Paenibacillus larvae and Melissococcus plutonius were identified by spore and cell shape, respectively, and other characteristics described previously (Hornitzky & Wilson, Citation1989; Shimanuki & Knox, Citation2000).
Cultivation of Paenibacillus larvae
Vegetative growth of P. larvae was conducted on Difco brain heart infusion (BHI) medium fortified with 0.1 mg thiamine hydrochloride per liter of medium (BHIT). The pH of the medium was adjusted to 6.6 using hydrochloric acid (Gochnauer, Citation1973; Shimanuki & Knox, Citation2000). The medium was autoclaved at 121 °C for 5 min, and approximately 14 mL was poured into each sterile Petri dish and left to cool at room temperature. To ensure the purity of the culture, spore suspensions obtained in previous steps were heat shocked at 80 °C for 15 min to eliminate non-spore-forming bacteria, and 0.2 mL of the spore suspension was uniformly dispensed on the BHIT medium using a sterile cotton swab. Antibiotic discs were subsequently placed in the Petri dishes using the disc diffusion method (Shimanuki & Knox, Citation2000; de Graaf et al., Citation2013) as described further. Only samples that tested positive for P. larvae spore during the microscopical visualization of the suspension were subjected to antibiotic-sensitive testing.
AFB antibiotic sensitivity test
Resistance of Paenibacillus larvae to antibiotics was determined using the disc diffusion method (Shimanuki & Knox, Citation2000; de Graaf et al., Citation2013). In this study, AFB resistance to antibiotics was tested against two different antibiotics: 1) Tetracycline (Terramycin®) and 2) Tylosin (Tylan®). A single disc of 5 µg tetracycline (Becton, Dickinson and Company, Franklin Lakes, NJ) and 30 µg Tylan (Mast Group Ltd., Bootle, UK) was placed in the center of the Petri dish containing P. larvae spore suspension and then incubated at 34 °C for 72 h. The sensitivity of P. larvae to the antibiotics was determined by measuring the diameter size (mm) of the inhibition zone within the culture.
Calculation of AFB antibiotic resistance
Since the standard Petri dish’s total diameter is equal to 84 mm, we considered that 42 mm inhibition would represent a 50% susceptibility of the bacterial culture to the antibiotic. Thus, the percentage of resistance was calculated based on the following equation: when (R) is the resistance (%) and (
) is the inhibition zone in (mm). The percentage of AFB resistance to tetracycline was calculated and categorized as follows: 1) < 30 mm inhibition (> 65% resistance), resistant, 2) 30–50 mm inhibition (40–65% resistance), intermediary resistant, and 3) > 50 mm inhibition (< 40% resistance), susceptible (Shimanuki & Knox, Citation2000). Considering the significant lack of literature pertaining to P. larvae’s resistance to tylosin; a recently approved antibiotic to treat AFB, we simply assigned two categories of resistance for tylosin: 1) > 50% resistance (Resistant), 2) < 50% resistance (Susceptible).
Brood diseases per U.S. climate region
Data related to brood disease prevalence and AFB antibiotic resistance were analyzed based on their geographical occurrence in particular climate regions of the USA. The U.S. official classification of states per climate region was retained in this study, provided by the National Centers for Environmental Information (Karl & Koss, Citation1984). The nine U.S. climate regions were as follows: 1) Northeast, 2) Northern Rockies and Plains (NRP), 3) Northwest, 4) Ohio Valley, 5) Southeast, 6) Southwest, 7) South, 8) Upper Midwest, and 9) West. The nominal state per climate region is detailed in Table S1.
Data analysis
The data analyzed in this study, which covered the period from 2015 to 2022, was retrieved from the Bee Disease Diagnostic Laboratory (BDDL) database at the USDA-ARS Bee Research Laboratory. Geographical mapping of honey bee diseases and pathogens was conducted using the Tableau Public platform (https://www.tableau.com). All analyses were performed using R Statistical Software R (R Core Team, Citation2020) through RStudio (RStudio Team, Citation2019) version 2022.07.0.
Figures were generated utilizing “ggplot2” (Wickham, Citation2016), “doby”, and “plyr” (Wickham, Citation2011) packages. For bar plot graphs, error bars represent the standard error (SE), while boxplots (box and whisker plots) display the median, first and third quartiles, and both maximum and minimum values of variables. All datasets were tested for normality using the Shapiro test before conducting statistical analyses.
The Kruskal–Wallis rank test, a non-parametric method, was employed to analyze data that did not adhere to a normal distribution, at a 95% confidence interval and with three levels of significance (p < 0.05; p < 0.01; p < 0.001). This was particularly relevant for data concerning antibiotic resistance, which deviated from a normal distribution pattern. The statistical evaluation was conducted on an annual basis and by climate region, utilizing the Kruskal–Wallis test. For each analysis, details such as degrees of freedom, Chi-square values, and the number of observations were provided for every subfigure. When necessary, adjustments for multiple comparisons and p values were made using the Benjamini–Hochberg procedure. Statistically significant differences between box plots were denoted by distinct alphabetical letters.
Conversely, the prevalence of brood diseases, when analyzed monthly, yearly, and by climate region, conformed to a normal distribution. This subset of the data was examined using ANOVA, adhering to the same confidence interval and levels of significance as those specified for the Kruskal–Wallis test. For data that was normally distributed, pairwise comparisons were carried out employing the post hoc Tukey HSD test.
The prevalence of brood diseases and AFB resistance to antibiotics were analyzed and presented across various dimensions, including by month, year, state, nationwide, and climate regions. Linear regression analysis was conducted to study the relationships between AFB resistance to antibiotics throughout the years. Additionally, heatmaps were generated using the “pheatmap” package to illustrate the overall national average of brood disease prevalence (EFB and AFB) and AFB resistance to antibiotics by climate region.
Results
Brood samples and state distribution
During its activity between 2015 and 2022, the BDDL received a total of 4790 brood samples from 49 U.S. states. As shown in Figure S1 and Table S1, the number of service requests from the State Apiary Inspectors and beekeepers varied from state to state. The six states with the largest sample size were OH (n = 748), IL (576), NY (529), MA (368), PA (246), and VT (244). Conversely, NE, SD, AK, AZ, NV, MS, and ND had five samples or fewer (Figure S1 and Table S1).
Prevalence of foulbrood diseases by state
Regarding AFB and EFB diseases, P. larvae and M. plutonius causing AFB and EFB, respectively, were present in multiple U.S. states and years. In terms of prevalence, EFB was identified in all U.S. states except for AK, AZ, MS, ND, NE, and NV (Figure S2(a) and Table S1). It should be noted that these states had low sample representation, ranging from 1 to 5 samples. States with EFB infection rates not exceeding 10% of their total analyzed samples were TN (4.2%), WV (4.3%), CT (5.6%), CA (5.9%), ID (7.7%), and MT (9.5%), Figure S2(a) and Table S1. The highest EFB infections exceeding 40% infestation were recorded in IL (42.2%), RI (50%), AR (55%), and DE (63.6%), Figure S2 and Table S1. RI percentage should be carefully viewed considering the low samples received from this state (n = 8), Table S1.
AFB was not identified in 17 states, namely: AK, AR, AZ, CT, DC, FL, GA, KS, KY, MO, MS, NC, ND, NM, NV, OK, and TN (Figure S2(a) and Table S1). States with the highest AFB prevalence which exceeded 40% of the samples infected by P. larvae, were NY (54.8%) and PA (43.5%) (Figure S2(a) and Table S1). States with the lowest AFB infection rate (1–5%) were WA (2%), MD (2.8%), VA (2.9%), MI (2.9%), IL (3.5%), CO (4.2%), WV (4.3%), and OR (4.9%) (Figure S2(a) and Table S1).
When considering both AFB and EFB together, the correlation matrix reflected by a heatmap analysis showed the lowest prevalence in NV, ND, MS, AK, and AZ while States with both diseases were NY, PA, DE, RI, ME, and SD showed the highest intensity. Other states showed a mix of both diseases at various rates and intensity (Figure S2(b)).
Seasonal and yearly progress of foulbrood diseases
Nationwide, both AFB and EFB infections showed significant monthly variations (F = 70, df = 11, p < 0.001), with EFB peaking in the spring months (April–July) and AFB having a less pronounced seasonal pattern (). The highest EFB infections were recorded in the spring months from April to July, with lower infection rates observed between October to March (). On the other hand, AFB infection showed less oscillation compared to EFB with the highest infection recorded between June and October (). EFB significantly exceeded AFB infection from April to July only (p < 0.001). Significantly higher AFB infections compared to EFB were only recorded in November, December, February, and March, .
Figure 1. Average infection level of AFB and EFB displayed by month (a), year (b), and nationwide (c). ANOVA and post hoc Tukey HSD tests were conducted at three levels of significance: p < 0.05*, p < 0.01**, and p < 0.001***. Both EFB and AFB varied significantly (p < 0.001) per month. Only EFB varied significantly (p < 0.001) per year. Error bars of the bar plots represent the standard error (SE).
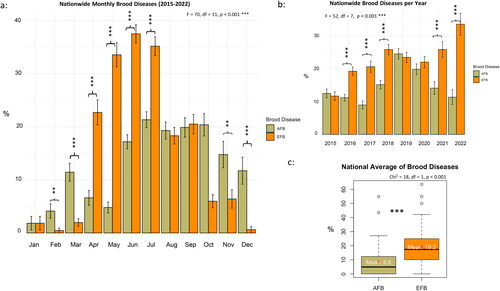
EFB varied significantly (F = 52, df = 7, p < 0.001) among years with the highest infection (> 30%) recorded in 2022 (). AFB remained steady with no significant differences (p = 0.5) among year with the highest infection (> 20%) recorded in 2019 (). EFB was significantly (p < 0.001) higher than AFB in 2016, 2017, 2018, 2021, and 2022 (). Overall, EFB had a higher national average infection (19.2%) than AFB (8.6%) (Chi2 = 18, df = 1, p < 0.001) (, Table S1).
Foulbrood diseases per climate region
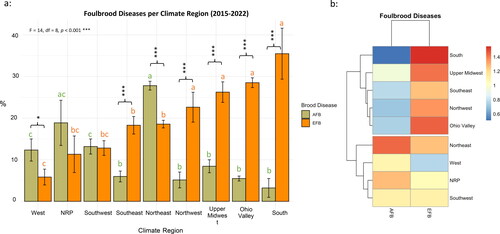
The prevalence of both brood diseases (EFB and AFB) varied significantly (F = 14, df = 8, p < 0.001) across different climate regions (). EFB infection ranged between (6–35.5%) and AFB between (3–28%). The highest infection of EFB was recorded in the South region (35.5%), and the lowest in the West region (6%) (). Contrary to EFB, the lowest AFB infection was recorded in the South (3%), with no statistical differences in AFB loads between South, Ohio Valley, Upper Midwest, Northwest, and Southeast regions (). AFB infection significantly (p < 0.001) exceeded EFB in a single climate region, which was in the Northeast. No statistical differences between EFB and AFB infections were recorded in two climate regions: NRP and Southwest (). Similarly, no statistical differences were recorded for EFB levels among four climate regions: Northwest, Upper Midwest, Ohio Valley, and South (). When both diseases are considered together, the heatmap dendrogram clustered the climate regions into two main categories: 1) Regions with stark contrasts between EFB and AFB (South, Upper Midwest, Southeast, Northwest, and Ohio Valley) and 2) Regions with relatively similar infections of both diseases (Northeast, West, NRP, and Southwest) ().
Figure 2. (a) Overall brood disease (AFB and EFB) infections displayed by U.S. Climate Region. State assignment to Climate Regions is available in Table S1. Bar plots with different alphabetic letters within each brood disease category are significantly different. (b) Heatmap is generated using overall averages of AFB and EFB per climate region and shows intensity and relationship of brood diseases among climate regions. Error bars represent the standard error (SE). ANOVA and post hoc Tukey HSD tests revealed significantly (p < 0.001) brood disease variations among climate regions.
AFB resistance to antibiotics
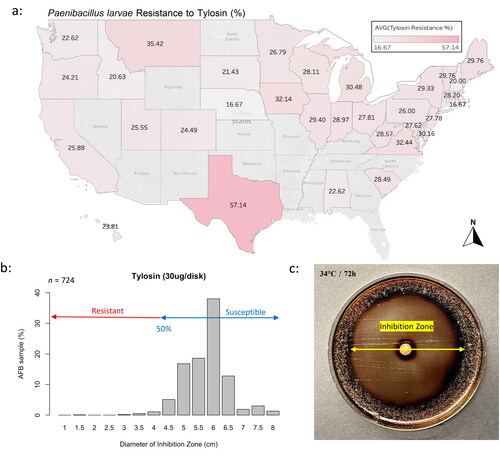
The resistance of the AFB-causing bacterium, P. larvae, to two antibiotics, tetracycline, and tylosin, exhibited variation across different states. The resistance to tetracycline ranged from 14.29% in AL to 80.95% in NJ ( and Table S2) while tylosin resistance ranged from 16.67% in RI to 57.14% in TX ( and Table S2). The radius of the inhibition zone (mm) by tetracycline across P. larvae populations ranged mainly between 50 and 75 mm (). For tylosin, the zone of inhibition caused by the antibiotic was mainly between 45 and 65 mm (). Nationally, there was a significant increase (Chi2 = 33, df = 7, p < 0.001) in the resistance to tetracycline in 2021 compared to previous years, with no positive correlation between year and resistance recorded (p = 0.3) (Figure S3(a)). Similarly, the resistance to tylosin plateaued from 2015 to 2019 followed by a significant increase (Chi2 = 40, df = 7, p < 0.001) in 2020 and 2021 then a lower trend in 2022, Figure S3(b). The overall national resistance of P. larvae to tetracycline was significantly (Chi2 = 14, df = 1, p < 0.001) higher (38%) compared to its resistance to tylosin (27%) (Figure S4(a) and Table S2). Nationwide (n = 724), a positive significant (p < 0.001) correlation (R = 0.27) in the level of resistance to both antibiotics was identified, Figure S4(b).
Figure 3. Overall average state resistance of AFB to tetracycline (a). Categorization of the cultured AFB samples (%) by expressed inhibition zones (cm) for tetracycline (b). Graphic display of P. larvae’s colonies cultured in a Petri dish with the inhibition zone caused by tetracycline (c). Medium was subsequently stained with Iodine Tincture for better visualization.
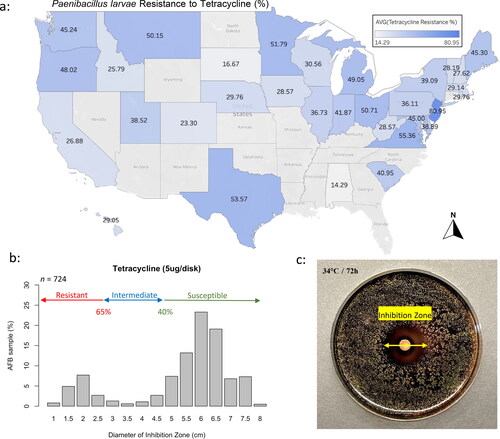
Figure 4. Overall average state resistance of AFB to tylosin (a). Categorization of the cultured AFB samples (%) by expressed inhibition zones (cm) for tylosin (b). Graphic display of P. larvae’s colonies cultured in a Petri dish with the inhibition zone caused by tylosin (c). Medium was subsequently stained with Iodine Tincture for better visualization.
Regarding antibiotic resistance among climate regions, significant differences were observed for tetracycline only (Chi2 = 23, df = 8, p < 0.01) (Figure S5(a)). P. larvae in Ohio Valley and NRP regions exhibited the highest resistance to tetracycline, with significantly higher levels than both West and Northeast isolates (Figure S5(a)). No significant differences (Chi2 = 18, df = 8, p = 0.5) among regions were recorded for tylosin resistance (Figure S5(b)). Heatmap analyses revealed the highest resistance to both antibiotics in the South region, followed by the NRP region (Figure S5(c)). These findings provide insights into the seasonal and regional dynamics of foulbrood diseases and the resistance of AFB-causing bacteria to antibiotics.
Discussion
Foulbrood disease, particularly AFB, remains a major threat and cause of honey bee death in the United States and worldwide, and a significant expense for honey bee management and regulation (Ellis & Munn, Citation2005). Despite the importance and implication of brood diseases for honey bee health and performance, little is known about the scope and temporal distribution of clinical cases and spread of the antibiotic resistance in the bee population across a wide geographic region. While the infection level of AFB remained relatively constant over an eight-year period, our results show a statistically significant (p < 0.001) upward trend in EFB infections, peaking in 2022. Our dataset also demonstrates a significantly higher prevalence of EFB infection in symptomatic colonies when compared to AFB. This finding may offer some solace to beekeepers, despite the resilient, and easily transmissible nature of P. larvae spores and the high virulence associated with P. larvae. P. larvae spores can be activated under favorable conditions, which include a combination of temperature and humidity that supports their germination and growth. In Brazil, AFB spores were prevalent in honey, royal jelly, and pollen samples (Teixeira et al., Citation2018). Similarly, 40% of honey samples (n = 122) analyzed from Italy contained P. larvae spores (Ricchiuti et al., Citation2019). While spore prevalence in hive products may not necessarily be translated to active bee brood infections, it certainly infers potential future infections in honey bee colonies. A recent study from North Africa conducted on 100 worker bees of Apis mellifera intermissa reported a range of 5–32% AFB prevalence among five Algerian regions (Noureddine & Nizar, Citation2021). Similarly, in South Africa, 32% prevalence of P. larvae was reported in a total of 71 samples of brood, honey, and wax sampled randomly, based on genetic markers (Hristov et al., Citation2023). In US states, AFB prevalence ranged between 0 and 55% with a national mean of 8.6%.
The incidence of EFB has been linked to stress factors such as pesticide exposure, climate change, and inadequate nutrition. Honey bees experiencing stress conditions are more vulnerable to EFB (Floyd et al., Citation2020; Milbrath et al., Citation2021; Thebeau et al., Citation2023). The elevated prevalence of EFB infection observed in our study is indicative of the heightened stress level impacting U.S. honey bee populations.
On a monthly basis, AFB infections show significant increases during the beekeeping season from June to October, while EFB spike earlier, starting in April. Both brood diseases decreased in Fall and Winter seasons due to lower contamination efficiency and regression in brood rearing. Our data is in agreement with previous literature documenting increased EFB incidences in honey bee colonies used for commercial pollination of blueberry in Canada in early spring (Guarna et al., Citation2019). Like P. larvae, the causative agent of EFB, M. plutonius, remains widely prevalent, and was identified in over 30% of the honey bee colonies in Canada between 2014 and 2017 (Thebeau et al., Citation2022). The early spring surge in EFB cases within honey bee colonies can frequently be attributed to a shortage of young nurse bees available to care for a rapidly expanding population of larvae, particularly when there is a scarcity of nectar and pollen resources (Kane & Faux, Citation2021). Hence, EFB infection can result in a substantial decrease in the adult honey bee population, weaken the colony, reduce overall productivity, and ultimately lead to colony failure (Ellis & Munn, Citation2005; Forsgren, Citation2010). Consequently, the increased colony losses stemming from spring EFB infections can exert substantial economic pressures on beekeeping operations, particularly considering the heightened demand for bee colonies during the pollination season.
Concerning the resistance of AFB to antibiotics, the patterns of inhibition zones found in our samples seem to be largely in agreement with those found in a previous study conducted on 33 P. larvae isolates from North America (Krongdang et al., Citation2017). The presence of two distinct groups of inhibition zone is apparent for tetracycline, in which some of P. larvae isolates clustered in the resistant zone while most of the samples were located at the susceptibility end, . Despite using a different culture media compared to the one used in this study (BHIT), we documented similar patterns described in Krongdang et al.’s investigation. On the other hand, tylosin inhibition zones showed a more symmetrical distribution with most samples clustering in the susceptibility zone, . Such finding clearly suggests that a potential group of P. larvae had developed resistance to tetracycline, which has been used for decades, while no such effect was recorded in the case of tylosin. Moreover, this suggestion is reinforced by higher overall resistance to tetracycline (38%) compared to tylosin (27%), Figure S4(a). Further investigation is needed to determine if variations of AFB resistance to antibiotics recorded in this study among states and climate regions are due to the presence of different P. larvae strains.
In conclusion, our data shows that longitudinal studies are critical for assessing the impacts of honey bee management, nutrition, and climate on bee diseases. For two key honey bee brood disease agents, we show distinct patterns of seasonal and geographic prevalence. Since we have no evidence for different management styles, these differences likely reflect a mix of climate and forage impacts on brood disease. They could also reflect different levels of diligence in monitoring brood diseases by state authorities, i.e. states sending higher numbers of AFB samples could reflect a more aggressive bee regulatory landscape.
TableS1.docx
Download MS Word (28.7 KB)FigS5.pdf
Download PDF (510.1 KB)FigS4.pdf
Download PDF (326.7 KB)FigS2.pdf
Download PDF (431.5 KB)FigS3.pdf
Download PDF (538.8 KB)TableS2.docx
Download MS Word (29.2 KB)FigS1.pdf
Download PDF (594.1 KB)Acknowledgments
We thank State Apiary Inspectors and beekeepers who sent samples for analysis across the USA.
Disclosure statement
No potential conflict of interest was reported by the author(s).
Additional information
Funding
References
- ABC. (2020). The ABC & XYZ of bee culture: An encyclopedia pertaining to the scientific and practical culture of honey bees. A.I. Root Company.
- Alburaki, M., Madella, S., Lopez, J., Bouga, M., Chen, Y., & vanEngelsdorp, D. (2023). Honey bee populations of the USA display restrictions in their mtDNA haplotype diversity. Frontiers in Genetics, 13, 1092121. https://doi.org/10.3389/fgene.2022.1092121
- Alburaki, M., Steckel, S. J., Chen, D., McDermott, E., Weiss, M., Skinner, J. A., Kelly, H., Lorenz, G., Tarpy, D. R., Meikle, W. G., Adamczyk, J., & Stewart, S. D. (2017). Landscape and pesticide effects on honey bees: Forager survival and expression of acetylcholinesterase and brain oxidative genes. Apidologie, 48(4), 556–571. https://doi.org/10.1007/s13592-017-0497-3
- Biesmeijer, J. C., Roberts, S. P. M., Reemer, M., Ohlemüller, R., Edwards, M., Peeters, T., Schaffers, A. P., Potts, S. G., Kleukers, R., Thomas, C. D., Settele, J., & Kunin, W. E. (2006). Parallel declines in pollinators and insect-pollinated plants in Britain and the Netherlands. Science (New York, N.Y.), 313(5785), 351–354. https://doi.org/10.1126/science.1127863
- Budge, G. E., Barrett, B., Jones, B., Pietravalle, S., Marris, G., Chantawannakul, P., Thwaites, R., Hall, J., Cuthbertson, A. G. S., & Brown, M. A. (2010). The occurrence of Melissococcus plutonius in healthy colonies of Apis mellifera and the efficacy of European foulbrood control measures. Journal of Invertebrate Pathology, 105(2), 164–170. https://doi.org/10.1016/j.jip.2010.06.004
- Calderone, N. W. (2012). Insect pollinated crops, insect pollinators and US agriculture: Trend analysis of aggregate data for the period 1992–2009. PloS One, 7(5), e37235. https://doi.org/10.1371/journal.pone.0037235
- Chen, Y., Evans, J. D., Smith, I. B., & Pettis, J. S. (2008). Nosema ceranae is a long-present and wide-spread microsporidian infection of the European honey bee (Apis mellifera) in the United States. Journal of Invertebrate Pathology, 97(2), 186–188. https://doi.org/10.1016/j.jip.2007.07.010
- de Graaf, D. C., Alippi, A. M., Antúnez, K., Aronstein, K. A., Budge, G., De Koker, D., De Smet, L., Dingman, D. W., Evans, J. D., Foster, L. J., Fünfhaus, A., Garcia-Gonzalez, E., Gregore, A., Human, H., Murray, K. D., Nguyen, B. K., Poppinga, L., Spivak, M., van Engelsdorp, D., Wilkins, S., & Genersch, E. (2013). Standard methods for American foulbrood research. Journal of Apicultural Research, 52(1), 1–28. https://doi.org/10.3896/IBRA.1.52.1.11
- de Graaf, D. C., Alippi, A. M., Brown, M., Evans, J. D., Feldlaufer, M., Gregorc, A., Hornitzky, M., Pernal, S. F., Schuch, D. M. T., Titera, D., Tomkies, V., & Ritter, W. (2006). Diagnosis of American foulbrood in honey bees: A synthesis and proposed analytical protocols. Letters in Applied Microbiology, 43(6), 583–590. https://doi.org/10.1111/j.1472-765X.2006.02057.x
- Ellis, J. D., & Munn, P. A. (2005). The worldwide health status of honey bees. Bee World, 86(4), 88–101. https://doi.org/10.1080/0005772X.2005.11417323
- Elzen, P., Westervelt, D., Causey, D., Rivera, R., Baxter, J., & Feldlaufer, M. (2002). Control of oxytetracycline-resistant American foulbrood with tylosin and its toxicity to honey bees (Apis mellifera). Journal of Apicultural Research, 41(3–4), 97–100. https://doi.org/10.1080/00218839.2002.11101075
- Erban, T., Ledvinka, O., Kamler, M., Hortova, B., Nesvorna, M., Tyl, J., Titera, D., Markovic, M., & Hubert, J. (2017). Bacterial community associated with worker honey bees (Apis mellifera) affected by European foulbrood. PeerJ, 5, e3816. https://doi.org/10.7717/peerj.3816
- Evans, J. D. (2003). Diverse origins of tetracycline resistance in the honey bee bacterial pathogen Paenibacillus larvae. Journal of Invertebrate Pathology, 83(1), 46–50. https://doi.org/10.1016/s0022-2011(03)00039-9
- Floyd, A. S., Mott, B. M., Maes, P., Copeland, D. C., McFrederick, Q. S., & Anderson, K. E. (2020). Microbial Ecology of European Foul Brood Disease in the Honey Bee (Apis mellifera): Towards a Microbiome Understanding of Disease Susceptibility. Insects, 11(9), 555. https://doi.org/10.3390/insects11090555
- Forsgren, E. (2010). European foulbrood in honey bees. Journal of Invertebrate Pathology, 103 Suppl 1, S5–S9. https://doi.org/10.1016/j.jip.2009.06.016
- Fries, I., Lindström, A., & Korpela, S. (2006). Vertical transmission of American foulbrood (Paenibacillus larvae) in honey bees (Apis mellifera). Veterinary Microbiology, 114(3-4), 269–274. https://doi.org/10.1016/j.vetmic.2005.11.068
- Fünfhaus, A., Göbel, J., Ebeling, J., Knispel, H., & Genersch, E. (2019). Questions, problems, and solutions in the diagnosis of American foulbrood – a German perspective. Berliner Und Munchener Tierarztliche Wochenschrift, 132, 26–34. https://doi.org/10.2376/0005-9366-18023
- Gahtori, D., Chaturvedi, P., & Singh, S. (2011). Using bryophytes as a tool to cure European foulbrood disease of honey bee: An eco-friendly approach. Current Science, 101, 420–423. https://www.jstor.org/stable/24078521.
- Gochnauer, T. A. (1973). Growth, protease formation, and sporulation of Bacillus larvae in aerated broth culture. Journal of Invertebrate Pathology, 22(2), 251–257. https://doi.org/10.1016/0022-2011(73)90142-0
- Goulson, D., Nicholls, E., Botías, C., & Rotheray, E. L. (2015). Bee declines driven by combined Stress from parasites, pesticides, and lack of flowers. Science, 347(6229), 1255957. https://doi.org/10.1126/science.1255957
- Guarna, M., Higo, H., Foster, L., Pernal, S., & Veiga, P. W. (2019). Bee health and blueberry pollination. HiveLights, 32, 14. https://bchoneyproducers.ca/wp-content/uploads/2019/04/Higo-Common-Health-Bees-in-Blueberry-Pollination.pdf
- Haseman, L. (1961). How long can spores of American foulbrood live. The American Bee Journal, 101, 298–299.
- Hornitzky, M. A. Z., & Wilson, S. C. (1989). A system for the diagnosis of the major bacterial brood diseases of honey bees. Journal of Apicultural Research, 28(4), 191–195. https://doi.org/10.1080/00218839.1989.11101183
- Hristov, Y. V., Le Roux, J. J., Allsopp, M. H., & Wossler, T. C. (2023). Identity and distribution of American foulbrood (Paenibacillus larvae) in South Africa. Journal of Apicultural Research, 62(2), 303–310. https://doi.org/10.1080/00218839.2021.1887635
- Kane, T. R., & Faux, C. M. (2021). Honey bee medicine for the veterinary practitioner. John Wiley & Sons.
- Karl, T., & Koss, W. J. (1984). Regional and national monthly, seasonal, and annual temperature weighted by area, 1895–1983. Historical climatology series; 4-3 (p. 38). National Climatic Data Center. https://repository.library.noaa.gov/view/noaa/10238/noaa_10238_DS1.pdf.
- Kochansky, J., Knox, D. A., Feldlaufer, M., & Pettis, J. S. (2001). Screening alternative antibiotics against oxytetracycline-susceptible and -resistant Paenibacillus larvae. Apidologie, 32(3), 215–222. https://doi.org/10.1051/apido:2001123
- Krongdang, S., Evans, J. D., Pettis, J. S., & Chantawannakul, P. (2017). Multilocus sequence typing, biochemical and antibiotic resistance characterizations reveal diversity of North American strains of the honey bee pathogen Paenibacillus larvae. PLoS One, 12(5), e0176831. https://doi.org/10.1371/journal.pone.0176831
- Lindström, A., Korpela, S., & Fries, I. (2008). Horizontal transmission of Paenibacillus larvae spores between honey bee (Apis mellifera) colonies through robbing. Apidologie, 39(5), 515–522. https://doi.org/10.1051/apido:2008032
- Lopez, M. I., Pettis, J. S., Smith, I. B., & Chu, P. S. (2008). Multiclass determination and confirmation of antibiotic residues in honey using LC-MS/MS. Journal of Agricultural and Food Chemistry, 56(5), 1553–1559. https://doi.org/10.1021/jf073236w
- Milbrath, M. O., Fowler, P. D., Abban, S. K., Lopez, D., & Evans, J. D. (2021). Validation of diagnostic methods for European foulbrood on commercial honey bee colonies in the United States. Journal of Insect Science (Online), 21(6), 6. https://doi.org/10.1093/jisesa/ieab075
- Noureddine, A., & Nizar, H. (2021). Prévalence et répartition de la bactérie Paenibacillus larvae (Agent causal de la Loque américaine) au niveau de quelques ruchers de la région centre d‘Algérie. Nature & Technology, 13(1), 85–95.
- Peters, M., Kilwinski, J., Beringhoff, A., Reckling, D., & Genersch, E. (2006). American foulbrood of the honey bee: Occurrence and distribution of different genotypes of Paenibacillus larvae in the administrative district of Arnsberg (North Rhine-Westphalia). Journal of Veterinary Medicine. B, Infectious Diseases and Veterinary Public Health, 53(2), 100–104. https://doi.org/10.1111/j.1439-0450.2006.00920.x
- Potts, S. G., Roberts, S. P. M., Dean, R., Marris, G., Brown, M. A., Jones, R., Neumann, P., & Settele, J. (2010). Declines of managed honey bees and beekeepers in Europe. Journal of Apicultural Research, 49(1), 15–22. https://doi.org/10.3896/IBRA.1.49.1.02
- Powell, J. E., Carver, Z., Leonard, S. P., & Moran, N. A. (2021). Field-realistic tylosin exposure impacts honey bee microbiota and pathogen susceptibility, which is ameliorated by native gut probiotics. Microbiology Spectrum, 9(1), e0010321. https://doi.org/10.1128/Spectrum.00103-21
- R Core Team. (2020). R: A language and environment for statistical computing. R Foundation for Statistical Computing. https://www.R-project.org/.
- RStudio Team. (2019). RStudio: Integrated development for R. RStudio, Inc. http://www.rstudio.com/.
- Ricchiuti, L., Rossi, F., Del Matto, I., Iannitto, G., del Riccio, A. L., Petrone, D., Ruberto, G., Cersini, A., Di Domenico, M., & Cammà, C. (2019). A study in the Abruzzo region on the presence of Paenibacillus larvae spores in honeys indicated underestimation of American foulbrood prevalence in Italy. Journal of Apicultural Research, 58(3), 416–419. https://doi.org/10.1080/00218839.2018.1541651
- Schuch, D. M. T., Madden, R. H., & Sattler, A. (2001). An improved method for the detection and presumptive identification of Paenibacillus larvae subsp larvae spores in honey. Journal of Apicultural Research, 40(2), 59–64. https://doi.org/10.1080/00218839.2001.11101052
- Shimanuki, H., & Knox, D. A. (1988). Improved method for the detection of Bacillus-Larvae spores in honey. American Bee Journal, 128, 353–354. https://www.ars.usda.gov/is/np/honeybeediseases/honeybeediseases.pdf
- Shimanuki, H., & Knox, D. A. (2000). Diagnosis of honey bee diseases. U.S. department of agriculture, agriculture handbook No, AH-690 (p. 61). US Government Printing Office.
- Smith, K. M., Loh, E. H., Rostal, M. K., Zambrana-Torrelio, C. M., Mendiola, L., & Daszak, P. (2013). Pathogens, pests, and economics: Drivers of honey bee colony declines and losses. EcoHealth, 10(4), 434–445. https://doi.org/10.1007/s10393-013-0870-2
- Teixeira, É. W., Guimarães-Cestaro, L., Alves, M. L. T. M. F., Message, D., Martins, M. F., Luz, C. F. P. d., & Serrão, J. E. (2018). Spores of Paenibacillus larvae, Ascosphaera apis, Nosema ceranae and Nosema apis in bee products supervised by the Brazilian Federal Inspection Service. Revista Brasileira de Entomologia, 62(3), 188–194. https://doi.org/10.1016/j.rbe.2018.04.001
- Thebeau, J. M., Cloet, A., Liebe, D., Masood, F., Kozii, I. V., Klein, C. D., Zabrodski, M. W., Biganski, S., Moshynskyy, I., Sobchishin, L., Wilson, G., Guarna, M. M., Gerbrandt, E. M., Ruzzini, A., Simko, E., & Wood, S. C. (2023). Are fungicides a driver of European foulbrood disease in honey bee colonies pollinating blueberries? Frontiers in Ecology and Evolution, 11, 1073775. https://doi.org/10.3389/fevo.2023.1073775
- Thebeau, J. M., Liebe, D., Masood, F., Kozii, I. V., Klein, C. D., Zabrodski, M. W., Moshynskyy, I., Sobchishin, L., Wilson, G., Guarna, M. M., Gerbrandt, E. M., Simko, E., & Wood, S. C. (2022). Investigation of Melissococcus plutonius isolates from 3 outbreaks of European foulbrood disease in commercial beekeeping operations in western Canada. Canadian Veterinary Journal, 63(9), 935–942. https://pubmed.ncbi.nlm.nih.gov/36060490/
- Vezeteu, T. V., Bobiş, O., Moritz, R. F. A., & Buttstedt, A. (2017). Food to some, poison to others - honey bee royal jelly and its growth inhibiting effect on European Foulbrood bacteria. MicrobiologyOpen, 6(1), e00397. https://doi.org/10.1002/mbo3.397
- Watanabe, M. E. (1994). Pollination worries rise as honey bees decline. Science, 265(5176), 1170–1170. https://doi.org/10.1126/science.265.5176.1170
- Wickham, H. (2011). The split-apply-combine strategy for data analysis. Journal of Statistical Software, 40(1), 1–29. http://www.jstatsoft.org/v40/i01/. https://doi.org/10.18637/jss.v040.i01
- Wickham, H. (2016). ggplot2: Elegant graphics for data analysis. Springer-Verlag New York. https://ggplot2.tidyverse.org.
- Zabrodski, M. W., Wilson, G., Moshynskyy, I., Wentzell, A., Wood, S. C., Klein, C. D., Kozii, I. V., de Mattos, I. M., Epp, T., & Simko, E. (2020). Investigation of clinical outbreaks of American foulbrood in honey bee operations in Saskatchewan. The Canadian Veterinary Journal = La Revue Veterinaire Canadienne, 61(10), 1055–1059. https://pubmed.ncbi.nlm.nih.gov/33012819/