
 ?Mathematical formulae have been encoded as MathML and are displayed in this HTML version using MathJax in order to improve their display. Uncheck the box to turn MathJax off. This feature requires Javascript. Click on a formula to zoom.
Abstract
Spontaneous focusing on quantitative relations (SFOR) is related to the development of rational number knowledge and predicts future mathematical knowledge. However, scarce evidence exists on whether and how SFOR tendency can be supported with classroom instruction. In this quasi-experimental study, 306 5th grade students participated in one of two four-lesson interventions. We investigated the relative effectiveness of both interventions on students’ SFOR tendency and their knowledge of multiplicative relations and fractions. Students in the Spot the Relations intervention (n = 142) completed activities that supported their ability to recognize and describe multiplicative relations in their everyday surroundings. Students in the Fraction Estimation Game intervention (n = 164) trained with digital game-based number line estimation tasks that supported their fraction knowledge. The results revealed that students in the first group showed larger gains in their multiplicative relations knowledge and SFOR tendency, whereas those in the second group showed larger gains in their fraction knowledge from pre- to posttest. Although SFOR tendency was supported by both interventions over time, the effect was larger for Spot the Relations, which used instructional practices that supported students’ multiplicative knowledge and mathematical language and made multiplicative relations relevant and observable parts of the world.
Introduction
The everyday world is rich in mathematical features; however, these are not equally apparent to everyone (Hannula & Lehtinen, Citation2005). For the past two decades, there has been a growing amount of empirical research on young children’s spontaneous mathematical focusing tendencies (for recent reviews, see, e.g., McMullen, Chan, et al., 2019; Verschaffel et al., Citation2020). Although most of these studies originally focused on spontaneous focusing on numerosity (SFON), the line of research has since expanded to other spontaneous mathematical focusing tendencies, such as spontaneous focusing on Arabic number symbols (Rathé et al., Citation2019), patterns (Wijns et al., Citation2020), numerical order (Harju et al., Citation2022), and quantitative relations, namely, spontaneous focusing on quantitative relations (SFOR; McMullen et al., Citation2014). The present study focuses on SFOR tendency with multiplicative relations, including fractions.
Knowledge of multiplicative relations is not only part of formal schooling but is also relevant in students’ everyday lives (Lehtinen & Hannula, Citation2006; Nunes et al., Citation1993; Nunes & Bryant, Citation2015). It is also considered vital in contemporary societies (National Mathematics Advisory Panel, Citation2008; Siemon et al., Citation2005). In addition, the well-documented struggles of students when dealing with fractions (Jordan et al., Citation2013; Ni & Zhou, Citation2005; Siegler et al., Citation2011) highlight the importance of learning how to apply their multiplicative relations knowledge in novel and everyday contexts.
SFOR refers to spontaneous (i.e., undirected) focusing of attention on quantitative relations and the use of these relations in situations that are not explicitly mathematical, such as noticing and describing that there are two times more bananas than oranges on the table, without external guidance to do so (McMullen et al., Citation2014). McMullen et al. (Citation2016) showed that individual differences in SFOR tendency measured across different tasks were not entirely explained by students’ ability to recognize and describe the multiplicative relations in a task when explicitly asked to do so. SFOR tendency is related to the development of rational number knowledge, even after controlling for certain variables, such as mathematics achievement, nonverbal intelligence, multiplicative reasoning, and arithmetic fluency (McMullen et al., Citation2016; Van Hoof et al., Citation2016). In addition, SFOR tendency predicts algebra knowledge 3 years later, even after controlling for nonverbal intelligence and rational number knowledge (McMullen et al., Citation2017). Altogether, existing research suggests that SFOR tendency is a distinct feature of mathematical knowledge that is related and relevant to the development of rational number knowledge (McMullen et al., Citation2016; Van Hoof et al., Citation2016).
A higher spontaneous mathematical focusing tendency (e.g., high SFOR tendency) has been theorized to also support individuals’ self-initiated practice with related mathematical skills (e.g., multiplicative relations and fractions) outside the mathematics classroom (Lehtinen et al., Citation2017). This kind of self-initiated practice is proposed to support the learning of domain-specific mathematical skills and knowledge in the classroom. This iterative developmental relationship also suggests that SFOR tendency is an important outcome for mathematics instruction (McMullen et al., Citation2017). While spontaneous mathematical focusing tendencies can be supported with interventions (Braham et al., Citation2018; Hannula et al., Citation2005; Hannula-Sormunen et al., Citation2020; Määttä et al., Citation2022; McMullen, Hannula-Sormunen, et al., Citation2019), it remains unclear which instructional practices and mathematical skills, when supported, would best support students’ SFOR tendency. Thus, the present study examines the relative effectiveness of two different instructional practices in supporting students’ SFOR tendency and their knowledge of multiplicative relations and fractions, which are considered important contributors to SFOR development.
SFOR tendency and factors related to its development
Any particular instance of focusing on a particular mathematical feature in an everyday situation is dependent on several factors (Hannula & Lehtinen, Citation2005; McMullen et al., Citation2019). Why is it that in some situations, one directs attention to the multiplicative relation, whereas another might not? Aside from an individual’s SFOR tendency, other factors, such as requisite domain-specific skills and knowledge and contextual influences (e.g., perceptual salience of the multiplicative relation), may play a role (McMullen et al., Citation2019).
Domain-specific skills and knowledge are required for an individual to observe and describe multiplicative relations. Those with high levels of domain-specific mathematical skills and knowledge appear to be more likely to spontaneously focus on multiplicative relations in their everyday lives (McMullen et al., Citation2017). Likewise, having low requisite skills may hinder the likelihood of an individual spontaneously focusing on multiplicative relations in a particular situation. This suggests that supporting students’ multiplicative relations and fraction knowledge are potential ways to enhance their SFOR tendency.
Along with knowledge and skills of multiplicative relations and fractions, SFOR tendency is expected to be supported by strong mathematical language skills. In general knowledge of mathematical language, vocabulary is viewed as an important aim of mathematics instruction, as it may have a direct impact on mathematical development (Hornburg et al., Citation2018; Riccomini et al., Citation2015). Interventions focused on mathematical language have been found to support not only mathematical language skills but also mathematical knowledge (Purpura et al., Citation2017). Mathematical language has played a role in previous interventions on spontaneous mathematical focusing tendencies (Braham et al., Citation2018 Hannula et al., Citation2005; Hannula-Sormunen et al., Citation2020; Määttä et al., Citation2022) because the interventions aimed to support young children’s or students’ ability to use precise mathematical language or actions when they describe mathematical features of their surroundings or use them as part of their own actions. Instructional practices that target supporting students’ ability to describe multiplicative relations may support their SFOR tendency by teaching them more fluent and mathematically precise ways to describe multiplicative relations in their surroundings. Altogether, supporting multiplicative relations knowledge while also including mathematical language support is expected to enhance students’ SFOR tendency.
Contextual factors play a role in whether mathematical features are salient, perceived to be relevant, and ultimately noticed in certain situations (Lehtinen & Hannula, Citation2006; Lobato et al., Citation2012). Previous attempts to promote spontaneous mathematical focusing tendencies aimed to make the target of focus more apparent in everyday situations. This has been achieved by manipulating perceptual saliency of sets of everyday items, by using deliberate variation of mathematical target aspect, and by altering social goals with activities that support students’ ability to notice whether mathematical features of one’s surroundings are relevant, observable, and can be described or used in one’s own action (Hannula-Sormunen et al., Citation2020; Määttä et al., Citation2022). This notion suggests that providing support for making multiplicative relations more salient in everyday situations would, in turn, support students’ SFOR tendency. In Finland students start to learn fractions in 3rd grade and are expected to have the ability to apply their multiplicative relation and fraction knowledge in novel contexts and tasks by 5th grade. Nonetheless, there are substantial individual differences in SFOR tendency in 5th graders (McMullen et al., Citation2016), which may be malleable through explicit intervention.
Two learning environments aimed at supporting SFOR tendency
To investigate instructional practices by which SFOR tendency can be effectively improved, we compared the effects of two different classroom interventions that aimed to promote different factors of SFOR tendency in 5th grade students.
First, the aim of the Spot the Relations intervention was to support students’ ability to recognize and describe multiplicative relations and make them more salient, relevant, and explicit targets of focusing in students’ everyday lives. By embedding the requisite domain-specific skills and knowledge about multiplicative relations, describing multiplicative relations found by using precise mathematical language, and recognizing multiplicative relations from everyday contexts, Spot the Relations is expected to support SFOR tendency via multiple factors. Previous interventions using similar lesson activities and following same instructional principles was found to promote SFOR tendency of 6th grade students (McMullen et al., Citation2019) and support fraction knowledge development of 4th grade students more than business-as-usual fraction instruction (Määttä et al., Citation2022).
The second type of instruction introduced in this study, the Fraction Estimation Game intervention, used a game-based learning environment based on number line estimation (Greipl et al., Citation2021; Kiili et al., Citation2018; McMullen et al., Citation2023). The mental number line is an important tool for reasoning about fractions (Braithwaite & Siegler, Citation2018; Siegler et al., Citation2011). Previous research has demonstrated that the use of number line estimation as a core game mechanic is an effective and engaging instructional approach in game-based learning of rational number knowledge for 4th-grade students (Kiili et al., Citation2018). The Fraction Estimation Game version used in the current study focused on supporting the development of both procedural and conceptual fraction knowledge without any explicit goal of using mathematical language to describe fractions or increasing the salience of mathematics in everyday contexts.
Notably, the Fraction Learning Game is not simply an active control condition in the current study, as rational number knowledge, particularly fraction magnitude knowledge, is a known predictor of the development of SFOR tendency (McMullen et al., Citation2017). Thus, both the promoting either noticing and describing multiplicative relations or estimation of rational number magnitudes may therefore lead to enhanced SFOR tendency. By comparing the effects of the two interventions on SFOR tendency, we will be able to both examine, whether (a) providing explicit support for students' ability to recognize and describe quantitative relations in everyday situations or (b) providing support for estimation of fraction knowledge in a game-based learning environment leads to larger improvements in SFOR tendency.
Moreover, previous intervention studies with SFOR -related activities have only been compared with business-as-usual classroom fraction instruction (Määttä et al., Citation2022; McMullen, Hannula-Sormunen, et al., Citation2019). Therefore, one potential cause for the positive effects of the interventions may be novelty effects of carrying out activities that are outside the bounds of typical mathematics instruction. Thus, in the current study, we compare the effects of the Spot the Relations intervention to an active comparison condition (in this case the Fraction Estimation Game) to clarify if this is the case.
The present study
Previous research has suggested that SFOR tendency is an important feature of mathematical knowledge (McMullen et al., Citation2016), and supporting its development should be the aim of instructional practices in classrooms. In this regard, the present study compares the relative effectiveness of two interventions, Spot the Relations and Fraction Estimation Game, in supporting SFOR tendency and knowledge of multiplicative relations and fractions. The core differences between these interventions are that Spot the Relations (a) more broadly focuses on recognition and describing of multiplicative relations rather than just fractions, and (b) emphasizes mathematical language and contextual factors in its instruction. In contrast, Fraction Estimation Game is more precisely targeted toward fraction magnitude knowledge by practicing number line estimation tasks. The present study expands on the study of McMullen, Hannula-Sormunen, et al. (Citation2019) by comparing Spot the Relations with Fraction Estimation Game to negate the potential novelty effect of the intervention on students. Moreover, given the positive iterative relation between fraction knowledge and SFOR tendency, if Fraction Estimation Game has the expected positive impact on fraction knowledge, it may also contribute to an increase in SFOR tendency. Thus, based on a preregistered analysis plan (https://osf.io/86xkud), we ask whether either intervention is more effective in promoting students’ SFOR tendency and their knowledge of multiplicative relations and fractions in the following ways:
Multiplicative relations knowledge
Määttä et al. (Citation2022) suggested that a similar instruction as Spot the Relations supported students’ ability to recognize and describe multiplicative relations compared with the business-as-usual fraction group. Although Fraction Estimation Game is also expected to support students’ learning of multiplicative relations in the form of fractions, it is not expected to provide more support to their mathematical language or ability to describe multiplicative relations compared with Spot the Relations activities. Thus, we hypothesize that Spot the Relations is more effective in supporting students’ multiplicative relations knowledge.
Fraction knowledge
Fraction games based on number line estimation tasks have been shown to enhance students’ rational number knowledge compared with a business-as-usual group (Kiili et al., Citation2018), whereas a similar intervention as Spot the Relations (Määttä et al., Citation2022) revealed that training supports students’ fraction learning at the same pace as the business-as-usual group, with potentially stronger positive effects over time. However, Fraction Estimation Game focuses on fraction knowledge; therefore, it is expected to support students’ fraction knowledge more strongly than Spot the Relations. Hence, we hypothesize that the Fraction Estimation Game intervention is more effective in supporting students’ fraction knowledge.
SFOR tendency
The iterative relationship between requisite domain-specific mathematical skills and knowledge with SFOR tendency suggests that both interventions in the present study should also support SFOR tendency. However, whereas Fraction Estimation Game focuses on knowledge of fractions, Spot the Relations focuses more broadly on multiplicative relations. Moreover, the latter not only aims to support students’ multiplicative relations knowledge but also emphasizes their mathematical language and attempts to make multiplicative relations relevant and observable parts of the world. Therefore, we hypothesize that the Spot the Relations intervention will be more effective in supporting students’ SFOR tendency.
Methods
Participants
Fifth-grade students (N = 494) from 20 classrooms and seven schools took part in a quasi-experimental intervention study during Spring 2020 and 2021. First, in Spring 2020, the Spot the Relations intervention took place in 12 classrooms in seven schools (n = 291). The same schools were contacted again in Spring 2021, and new students from 5th-grade classrooms were asked to take part in the Fraction Estimation Game intervention. Four of the schools were willing to join, bringing the total to eight classrooms and 203 students participating in the Fraction Estimation Game intervention in Spring 2021. All the schools were located in the same municipality area in the same municipality area in Southern Finland.
Consent forms in Finnish and English with a description of the study were sent to students’ homes. A total of 125 students did not fill out the permission form (Fraction Estimation Game group n = 35). One student in each year did not give permission to take part in the study. Students who did not consent to take part in the study or did not fill out the form were excluded. Five students who gave consent were not present on any of the tests and were therefore excluded from the analysis. One of the classrooms (21 students) in the Spot the Relations intervention was forced to undergo distance learning before the posttest and was also removed from the analysis. The ethical guidelines of the University of Turku and the Finnish National Board on Research Integrity (TENK) were followed. Ethical board approval was granted by University of Helsinki Ethical review board in humanities and social and behavioral sciences (approval number 20/2018).
Sample size rationale
Our preregistration plan stated that if the two intervention groups differed in their pretest knowledge, we would examine whether similar prior knowledge between groups could be achieved by excluding classrooms from the Spot the Relations group, as this was drawn from a larger pool of participants. In line with our preregistered analysis plan, two classrooms in the Spot the Relations group were excluded from the final analysis due to imbalanced pretest scores between the two groups. These two classrooms were from a school that did not participate in the Fraction Estimation Game intervention. Full information on the exclusion procedure can be found at osf.io (https://osf.io/86xku). The final sample size and background data for the study are listed in . A total of 306 students from six different schools and 17 classrooms were included in the analysis. One classroom in the Fraction Estimation Game group was a combination classroom with two teachers.
Table 1. Background data of the participants included in the analysis.
Power analysis was conducted prior to the study with the parameters of effect size (d = 0.3), power (>0.8), and significance level (<0.05) revealing a need for a total sample size of 190 students. When considering the nested nature of the data (classrooms within schools), a power analysis of a two-level hierarchical design with covariates having an effect size of d = 0.5 based on Brezovszky et al. (Citation2019), power > 0.8, correlations within clusters Rw2 = 0.5, and among clusters Rs2 = 0.8, as well as intraclass correlations (ICCs) = .1 (Yang Hansen et al., Citation2014) revealed the need for eight classrooms per condition (Hedges & Rhoads, Citation2010).
Design
Both interventions followed the same schedule, starting with the professional development of the teacher, followed by a pretest, four 45-minute intervention lessons, and a posttest. Altogether, the interventions lasted for approximately two weeks, with no other mathematics lessons taking place between the tests. The classroom teacher taught the lessons in both groups.
Professional development of the teachers
All participating teachers were trained to present all lessons in a professional development session. The first author met all of the teachers in a 1-hour face-to-face session (Spot the Relations) or online (Fraction Estimation Game). The professional development session took place one week prior to the intervention.
Spot the relations intervention
Introduction lesson (Lesson 1)
The first lesson introduced students to the idea that multiplicative relations can be found everywhere. The first lesson used a PowerPoint presentation, including example pictures and ways in which the pictures could be described using exact mathematical language, such as “two times more” or “one-third.” The teachers were instructed to go through the PowerPoint using methods that would best support students’ thinking, engagement, and learning (i.e., teacher-led discussions, pair or group discussions, and the think-pair-share method). The students were encouraged to share their ideas and thoughts with one another. Multiplicative relations found in the presentation were encouraged to be considered from the classroom perspective (i.e., student points out that in the example picture, one-third of the apples are green, “Is there something in the classroom that is one-third?”).
Spot the relations card game (Lesson 2)
The aim of Lesson 2 was to further support students’ ability to recognize and describe multiplicative relations by playing the Spot the Relations card games with a deck of 32 photo cards (). The photo cards were chosen so that they contained at least one easily apparent representation of multiplicative relations, namely, half, one-third, one-fourth, or one-fifth. The photos were chosen by the research group from a pool of pictures, and for each chosen picture, at least one “apparent” multiplicative relation was found. The teachers were instructed to point out that, alongside fractions, it is possible to use multiplicative relation expressions when describing a card, thereby bridging the gap between both representations of multiplicative relations. Notably, there were theoretically infinite amounts of multiplicative features in the photos; thus, it was possible for the students to find all kinds of multiplicative relations from the cards.
Figure 1. Spot the relations card deck.
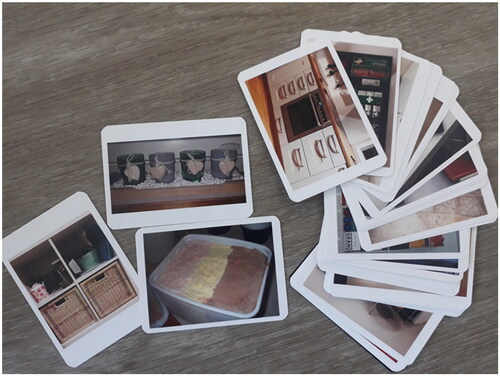
The lesson starts with the teacher presenting the deck of cards to the entire class and demonstrating the first game to be played. The teacher places the cards face down on the table and introduced the Spot the Relations memory game. The first student is asked to flip two cards face up. The aim was to find the same multiplicative relation from two cards. If the student manages to find the same multiplicative relation from both cards (e.g., half of the glasses are green on the top picture, and half of the slots are filled with boxes on the left picture in ), the student would take the pair of cards as a point. A bonus point could be earned if the student could find the same multiplicative relation from the classroom that was used to pair the cards. If the same multiplicative relation from the cards is not found, the cards are returned face down on the table. After the demonstration, the students are divided into pairs by the classroom teacher, and each pair is given a deck of cards. The pairs of students are then prompted to play the game. The teachers were instructed to highlight the idea that the games were not meant to be competitive and that it was more important to examine the cards and classroom in order to recognize and then share their findings with one another.
The instructions for the other two games were given in case the memory game became too repetitive. The first game is a cooperative “How many multiplicative relations can be found?” game, in which the first 10 cards are placed face up on the table. Then, each pair is asked to draw one more card from the deck and find all the cards on the table that have the same multiplicative relation as the drawn card. The second game, the “Game of speed,” requires students to place the deck of cards between other students to the table. Students then turn one card face up at a time. If, at any point, either student recognizes and describes the same multiplicative relation from the cards on the table, they must say “Yep.” A point is awarded if both students can find the same multiplicative relation from the cards. At the end of the lesson, the students are given a homework sheet, in which they have to write down at least three multiplicative relations that they can find from their homes.
Mathematical scavenger hunts (Lessons 3 and 4)
Lesson 3 and Lesson 4 used the same idea behind the scavenger hunt activities featured in previous intervention studies based on SFOR (Määttä et al., Citation2022; McMullen, Hannula-Sormunen, et al., Citation2019). The aim of the lesson was to support students’ ability to recognize and describe multiplicative relations found in the school and share their findings. Lesson 3 begins with the teacher presenting the tasks and aims of the lesson by going through a few sample tasks similar to the actual scavenger hunt tasks (). Then, the teacher divides the students’ into pairs, after which they are asked to solve scavenger hunt tasks in the classroom and then around the school. At the end of the lesson, the students are given a second homework sheet, in which they must describe the multiplicative relations they find on their journey home ().
Figure 2. Scavenger hunt sheet used in lesson 3 (translated). Note. The first five tasks were to be found in the classroom, followed by 13 similar tasks from within the entire school.
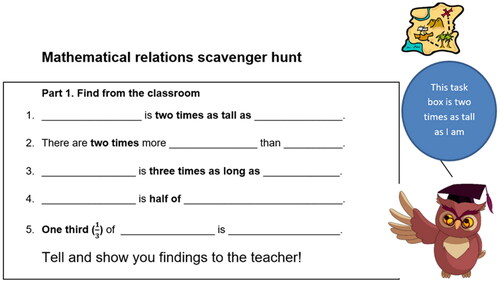
Figure 3. Home work sheet handed to the students at the end of the third lesson (translated).

In Lesson 4, the students must first share their homework findings in pairs. After this, the pairs are asked to select two of their answers from the first scavenger hunt. The answers are modified so that one of the multiplicative relations in the answer is deleted. For example, one of the pairs may have found that for Task 5, “One-third of the pencils on the teacher’s desk is blue” (). By deleting either the first or the latter part of the answer, the pairs are able to create new tasks for the other groups to solve. In turn, they are asked to solve their classmates’ puzzles about the multiplicative relations they found around the school.
Fraction estimation game intervention
The Fraction Estimation Game intervention was based on interacting and estimating values within the number line (Greipl et al., Citation2021; Kiili et al., Citation2018; Ninaus et al., Citation2017). In the game, the player controls a dog avatar with arrow keys and tries to estimate location of a hidden bone by estimating the magnitudes of the given target fractions. The location of the bone on the number line is determined by the target number (). The game includes basic number line estimation tasks in which players estimate the position of a target number on a number line (e.g., “Where does 2/6 go on a number line ranging from 0 to 1?”). The tasks also include unbounded number line estimation tasks (e.g., Cohen & Blanc-Goldhammer, Citation2011; McMullen et al., Citation2023), in which players estimate the position of a target number based on two numbers, but the endpoint of the number line is hidden from the player (e.g., “Where does 3/4 go on a number line starting from 0,” “Location of 1/2 is shown on the number line”) ().
Figure 4. Screenshots of the gameplay tasks.
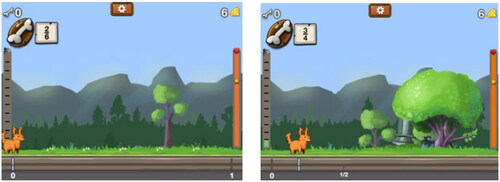
Some of the tasks include graphical dividers (e.g., flowers) designed to assist players in partitioning the number line into units. Furthermore, some tasks include enemies who can move on the number line by jumping with a specific pattern (e.g., jumps of 1/4). If a player recognizes a pattern, he/she could utilize the pattern in his or her estimation. Furthermore, the game includes several feedback channels. On the one hand, if a player’s estimation accuracy is high enough (i.e., interpreted as a correct answer), the player earns points in the form of bones, and the dog becomes happy. On the other hand, if the estimation accuracy is too low, the player loses energy, and the dog becomes sad. After a correct answer or two incorrect answers, the position of the correct answer is shown on the number line. Further, after completing a game level, delayed feedback is shown in the form of 1–3 stars. The number of earned stars depends on a player’s performance at each level.
Overall, the tasks incorporated into the games aimed to support the development of both procedural and conceptual fraction knowledge. Game-level difficulty adaptation was used to support the students’ learning by matching their skill levels to the tasks. Learning analytics provided teachers with more ways to identify students’ struggles so that they could, in turn, provide help during the games.
Game levels and adaptation
At the start of each lesson, students log in to play the game on a computer using their individual game codes. The students first complete 14 tutorial tasks, through which they are introduced to the cover story of a cat that has been hiding bones in the ground and become familiar with the game mechanics and interface. The main game consists of 18 levels, each containing eight estimation tasks, resulting in a total of 144 fraction number line estimation tasks, as shown in . During the lessons, the students proceed through the levels at their own pace. Each of the two consecutive levels is paired so that they have equivalent contents, and the difficulty of the second level is adapted based on the estimation accuracy on the first level of the pair (Koskinen et al., Citation2023). Thus, all students have fixed difficulties on odd-numbered levels (levels 1, 3…17) and adapted difficulties on even-numbered levels. The contents of the tasks at each level are presented in .
Table 2. Structure and content of the game levels.
Each player is given a maximum of two attempts in each task to overcome an estimation accuracy threshold before the game automatically advances to the next task. In the fixed difficulty levels, the threshold for correct estimation accuracy is over 90%.Footnote1 The difficulty for the adapted levels is then determined based on a student’s average estimation accuracy on the previous fixed difficulty level tasks (). If difficulty is adjusted for the adapted level, the student receives a message stating that on this level, the ground where the bones are hidden is very hard (increased accuracy requirement) or that the ground is very soft on (lowered accuracy requirement), but that the student should still try to be as accurate as possible. The possible adaptation for any adaptation level is always determined by the previous fixed level, and the adaptation does not carry over to the next pair of levels, as the content of the levels varies (see ).
Table 3. Adaptation of the required estimation accuracy.
Role of the teacher in the fraction estimation game intervention
The use of this game aims to be a natural implementation of game-based learning on a normal school day. The teachers were instructed to allow their students to start playing and progress in the game at their own pace. The teachers were allowed the possibility of using learning analytics, through which they could, for example, follow how students progressed in the game and provide help if someone became stuck in specific fraction tasks. The teachers were also instructed to help students in case they asked for help or to reactively help a student in need (e.g., by noticing someone struggling based on learning analytics data). The students were allowed to occasionally discuss and resolve tasks together, but the teachers were instructed to keep the main focus on individual progress and playing the game.
Fidelity of interventions
The fidelity and social validity of the interventions was measured using a questionnaire that all the participating teachers answered after every lesson in addition to the game data in case of the game intervention (see full translated questionnaire, Appendix C). This tool was used to determine whether the main aims of the lessons were carried out and to gather feedback about the lessons. The questionnaires were slightly different for the interventions, including a combination of multiple-choice questions and open questions. The translated questionnaire forms can be viewed in osf.io (https://osf.io/3gcux/).
The fidelity of the Spot the Relations intervention was first evaluated in terms of teachers’ perceived success of each lesson on a three-point Likert scale (i.e. “We played card games.” few (1)/part (2)/most (3) students succeeded). On average, the lessons were scored at 2.33 (Lesson 1), 2.75 (Lesson 2), 2.88 (Lessons 3) and 2.25 (Lesson 4). After the first question, the same three questions were repeated for each lesson: “How many students…(1) …do you think had difficulties recognizing and describing multiplicative relations precisely, mathematically? (2) …do you notice recognizing more multiplicative relations than before? (3) …flexibly recognized many multiplicative relations during the lesson?” The final question asked the teachers to write down what they found to be successful during the lesson and give ideas on how to further improve the lesson plans. Based on the teachers’ answers, it was determined that the lessons followed the given study procedure.
The fidelity of the Fraction Estimation Game intervention was evaluated by looking at game data to determine to what extent the students were playing the game. In the game group, 144 out of 164 students (88%) played all of the 18 levels included in the game (mean = 17.38, standard deviation = 1.95). The fewest number of levels played was 7, suggesting relatively high motivation thorough the gaming lessons. Additionally, the teachers filled out a questionnaire regarding the perceived usefulness of the learning analytics. All but one of the teachers reported using the learning analytics for all lessons. One teacher reported using the learning analytics only during the third and fourth lesson. All but one teacher reported recognizing that a student had difficulties in at least one of the lessons from the learning analytics. All teachers reported that they supported students after difficulties were recognized based on the learning analytics. The final question in the questionnaire asked whether the teachers thought learning analytics was useful. Learning analytics were rated as increasingly useful after every lesson; the lesson averages for Lessons 1–4 were 3.44, 3.67, 3.88, and 4.13, respectively (six-point Likert scale 1 = completely disagree to 6 = completely agree). Based on the game data and teachers’ answers, it was determined that the sessions sufficiently followed the given study procedure.
Testing procedure and measurements
The students were first tested on their SFOR tendency, followed by testing on their knowledge of multiplicative relations and fractions on the next day. Pre- and posttests were conducted prior to and after the intervention lessons.
To ensure the spontaneous nature of the task, SFOR tendency was measured during mother tongue lessons without mentioning that the task was mathematical in nature or that it was part of an ongoing mathematics study (Hannula & Lehtinen, Citation2005). To further ensure that students did not associate the test with mathematics or the ongoing study, the SFOR tendency tests were conducted by the classroom teacher the day before the multiplicative relations and fraction knowledge tests. The SFOR tendency paper-and-pencil writing task lasted 12 min. The tasks were presented in the same order for all students on both tests.
The students’ knowledge of multiplicative relations and fractions was measured during a 45-minute mathematics lesson using a computer-based test environment. The Spot the Relations group’s mathematics lesson pretest was administered by the researcher. However, the researchers were not allowed to conduct the posttests in school due to COVID-19-related restrictions. Therefore, the Spot the Relations group posttest and both mathematics tests for the Fraction Estimation Game group were administered by the classroom teachers after receiving verbal and written instructions from the researchers on how to run the test.
SFOR tendency
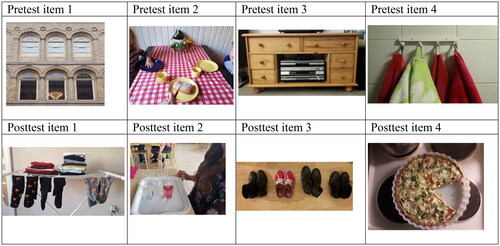
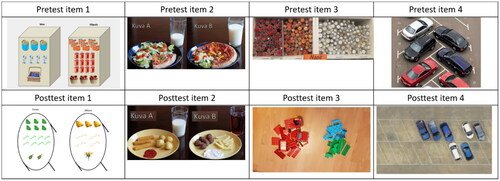
A photo description task was used in the pre- and posttests to measure students’ SFOR tendency (Määttä et al., Citation2022). This task was completed using a paper-and-pencil mother tongue lesson. The classroom teachers told their students a background story in which the teachers mixed up photo albums and needed the students’ help to sort out the photos that were to be left in the album. After the instruction, the students were presented with four photos. They were then instructed to “Describe the picture” and “Write as precise a description as you can.” They had 3 min to write about each photo, after which they were allowed to finish their current sentence before the teacher showed the next photo. After testing 14 pictures in a separate pilot study, two sets of four real-life photos were selected as the items for the pre- and posttests for the present study ().
Figure 5. SFOR tendency task items. Note. Copyrights of the photos: first author (pretest item 3 and posttest items 1 and 3), last author (pretest items 1 and 2 and posttest item 2), and fourth author (pretest item 4 and posttest item 4)
The students’ answers were coded and given points based on the number of SFOR descriptions they provided. A description was decided to be SFOR if it fit one of three SFOR categories: multiplicative relation, part–whole, or fraction. Each description that fit any of the three categories was given one point. The descriptions were not required to be mathematically correct in relation to the picture to gain a point (i.e., describing that something is half when it is one-third). There was no theoretical number of maximum points for the task, as the students’ answers might contain many SFOR descriptions within the same item.
A description was given a multiplicative relation point if it contained a description of a multiplicative relation between at least two objects or terms, including descriptions such as “two times more” and descriptions of multiplication or division, such as “Two of the drawers are two times larger than the smaller drawers.” A part–whole point was given for descriptions that referred to a whole set when describing part of that whole set. No part–whole point was given for only describing the whole set or part of the set separately. Furthermore, the description had to link the whole set and part of the set: “There are four similar objects, out of which one is green and the rest are red.” A fraction point was given to a description if it contained a fraction in numerical or written form: “Two-fourths of the cups are made of glass, and the rest are made of plastic”
The reliability analysis of the coding was done using a random group comprising 20% of the students’ answers from the Spot the Relations group. Two coders (first and fourth authors) agreed on 91% of the SFOR descriptions, and the remaining 9% of the descriptions where they disagreed were discussed. The category rules of SFOR were then clarified, after which the first author completed the rest of the coding.
The Cronbach’s alpha values for the photo description task were .36 and .78 in the pre- and posttests, respectively. Deleting any of the SFOR tendency items could not have improved these values. Due to the low alpha value in the pretest, we separately calculated the test–retest reliability for the SFOR tendency measure for the Spot the Relations and Fraction Estimation Game groups. For the former, Spearman’s p was 0.09 (sig = .35) and for the latter, Spearman’s p was .0.33 (sig < .001). Given the relatively low instances of SFOR tendency on the pretest, which most likely led to the low alpha values, along with the consistency of the measure on the posttest, we argue that the evidence for the inclusion of the pretest as a covariate in the analysis is sufficient to warrant proceeding.
Multiplicative relations knowledge
The students’ ability to recognize and describe multiplicative relations was measured using a multiplicative relations picture description task (McMullen et al., Citation2016; Määttä et al., Citation2022; McMullen, Hannula-Sormunen, et al., Citation2019). They were presented with four items at 90 s per item (). The test took place in their mathematics lessons using a computer-based test platform.
Figure 6. Multiplicative relations task items. Note. Copyrights of the photos: second author (pretest item 3), Andrey Khronelok/BigStockPhoto (pretest and posttest item 4), and last author (posttest item 3).
The first item consisted of a teleportation task in which three rows of items were teleported from Earth to other planets (a magician transforming items at posttest). The items eventually changed in multiple ways in terms of their color, shape, and consistent multiplicative relations (tripled in the pretest and halved in the posttest). The students were asked to “Compare how the items changed mathematically.” The second item included a picture of two meals with different proportions of food and drinks. The students were instructed to “Compare the meals mathematically in as many ways as you can.” The third item included a picture of different colored buttons on a shelf (two piles of different-colored Lego pieces on the posttest). Here, the students were instructed to “Compare the buttons (Lego pieces) mathematically in as many ways as you can.’ The fourth item included a picture of a car park using different pictures on the pre- and posttests. The students were instructed to “Compare the cars shown in the picture mathematically in as many ways as you can.”
The students were given points based on the same coding scheme used for the SFOR tendency tasks. Similarly, there was no theoretical maximum points for the items, except for item 1, wherein the maximum was three points as there were three rows of items. The Cronbach’s alpha values for the multiplicative relations task were .66 and .74 in the pre- and posttests, respectively. Deleting pretest item 1 from the multiplicative relations task could elevate the Cronbach’s alpha to .697. However, the item was left in the analysis since removing it would not exceed the pre-registered threshold of 0.7.
Fraction knowledge
The students’ fraction knowledge was measured using three tasks. The fraction tasks were presented after the multiplicative relations tasks within the same test platform.
The number line estimation task was used to measure the students’ fraction magnitude knowledge. Both tests have a total of eight items with the first four on the 0–1 number lines followed by four items on the 0–5 number lines. Each item is presented separately and is timed for 30 s. Before the first item, students completed a practice task with instruction and a value of on the 0–1 number line. The target numbers (items) in the pretest were
and
The target numbers in the posttest were
and
The items in the pre- and posttests were matched to have similar magnitudes with the same amount of fractions below and over 1 and the amount of mixed fractions. Percent absolute error (PAE), referring to the distance between the students’ estimated value and the correct value divided by the total length of the number line, was used to calculate the accuracy of the task (Siegler et al., Citation2009). The Cronbach’s alpha values for the number line estimation task’s PAE were .596 and .663 in the pre- and posttests, respectively.
The fraction ordering task was used to measure the students’ fraction magnitude knowledge (Schneider & Siegler, Citation2010; Van Hoof et al., Citation2015). The ordering task presented students with three to four fractions, after which they were asked to order them from smallest to largest. Both tests had six items, and the students had 2 min for the first three items and 2 min for the last three. The items in the pretest were as follows: A)
B)
C) 3
D)
E)
and F)
The items in the posttest included the following: A)
B)
C)
D)
E)
and F)
One point was given for each correct answer, resulting in a maximum of 6 points. The Cronbach’s alpha values for the fraction ordering task were .805 and .823 in the pre- and posttests, respectively.
The fraction calculation task was used to measure the students’ basic fraction arithmetic skills. Both tests had 8 fraction calculation items with 60 s of time allotted for the first four items and 120 s for the last four items. The items in the pretest were as follows: A) +
B)
+
C)
+
D)
+
E)
+
F)
+
G)
+
and H)
+
The items in the posttest included the following: A)
+
B)
+
C)
+
D)
+
E)
+
F)
+
G)
+
and H)
+
A student was given one point for each correct answer, resulting in a maximum of 8 points for the task. The Cronbach’s alpha values for the fraction calculation task were .919 and .916 in the pre- and posttests, respectively.
Notably, one preregistered fraction task was excluded from the analysis due to potential ambiguity in how the students interpreted the task. The interpretation of the presented results would not have changed whether the task had been included in the analysis.
Data analysis
The data were analyzed based on the preregistered analysis using IBM SPSS 25. The graphical figures were created using JASP version 0.14. Here, the task sum scores were calculated, and all scores differing over three standard deviations from the mean sum score were marked as outliers and transformed into mean scores +/−3 standard deviations (preregistered procedure). For example, the mean score for the SFOR pretests was 1.19 with a standard deviation of 1.51. Given that three students scored 6 points on the task, the scores were transformed to 5.72 (1.19 + 1.51*3). A total of 13 scores were adjusted: three scores were adjusted in the SFOR tendency pretest (highest score: 6, adjusted score: 5.72), three in the SFOR tendency posttest (highest score: 29, adjusted score: 12.07), three in the number line estimation pretest (highest PAE score: 4.26, adjusted score: 3.2), and four in the number line estimation posttest (highest PAE score: 3.65, adjusted score: 2.76). All the adjusted scores came from different students.
The composite fraction knowledge scores for the pre- and posttests were created by combining all three fraction tasks (number line estimation, fraction ordering, and fraction calculations). This follows the pre-registered protocol as the intervention did not target specific fraction skills (fraction scores are reported separately in Appendix A). First, the students’ item scores were summed at the task level, after which the sum scores were standardized. Standardization was conducted separately for the pre-and posttest tasks. The number line estimation PAE score was multiplied by −1 to obtain a higher score that could represent more accurate answers on the task. The standardized sum scores were then summed and divided by three, which was the number of tasks. This process ensured that equal weights were given to the different tasks.
Results
Descriptive statistics
lists the descriptive statistics for multiplicative relations knowledge, composite fraction knowledge, and SFOR tendency. Reliability was found to be sufficient (alpha = > .65) for all measures used in the analysis except for the SFOR tendency pretest (alpha = .36). Intraclass correlation coefficients (ICCs) of the measures revealed classroom effects that varied between 0.02 and 0.34.
Table 4. Means, standard deviations (in parentheses), percent of students with at least one point on the task (%), Cronbach’s alphas, and intraclass correlations (ICCs) of the three knowledge measures in the pre- and posttests for the spot the relations and fraction estimation game groups.
Due to the hierarchical nature of the data (randomization by classroom), two mixed effect models were compared when estimating the effects of the intervention on the three measured knowledge aspects. Model 1 was run with fixed effects using the intervention group as a fixed covariate and the pretest scores as covariates. For Model 2, random intercepts and slopes for classrooms were included, and the covariance type of the group and the pretest scores served as variance components. presents the −2 restricted logarithmic likelihood scores for both models. As can be seen, logarithmic likelihoods were lower for the second model in all three of the measures, indicating that Model 1 was found to be a better fit for estimating the variance of the scores for groups on posttest. Therefore, Model 1 was chosen as the model for the analysis.
Table 5. −2 Restricted logarithmic likelihood scores of the two models.
Intervention effects
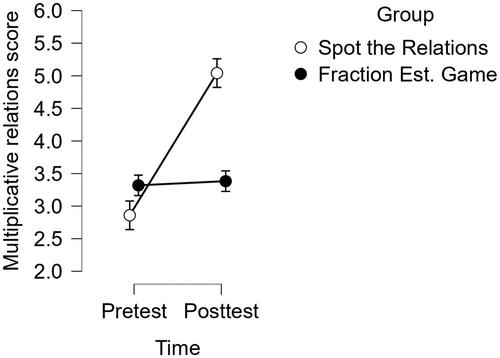
To compare the effects of the intervention on the Spot the Relations and Fraction Estimation Game groups’ ability to improve students’ multiplicative relations knowledge (research question (RQ) 1), we conducted a mixed linear model analysis using the posttest scores as the dependent variable, the intervention group as a fixed factor, and the pretest scores as covariates. The analysis revealed a statistically significant interaction effect from the pretest to the posttest: F(1, 259) = 32.400, p < .001, ηp2 = 0.11. indicates that the participants in the Spot the Relations group had a larger increase in their multiplicative relations knowledge task scores than those from the Fraction Estimation Game group. Therefore, the hypothesis for RQ1 was confirmed.
Figure 7. Means of the picture description task scores on the pre- and posttests for the spot the relations and fraction estimation game groups. Note. Error bars represent the plus/minus standard errors for the means.
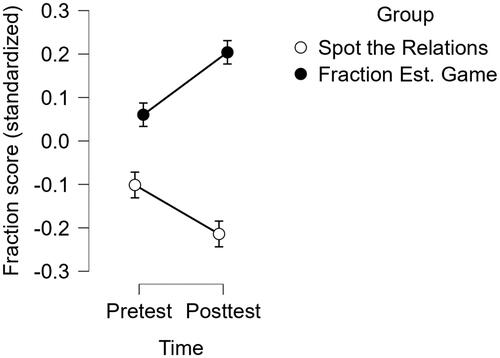
Next, the intervention effects between the groups were examined in terms of the students’ fraction knowledge (RQ 2). A mixed linear model analysis was conducted with the fraction knowledge scores. The analysis revealed a statistically significant interaction effect: F(1, 259) = 29.145, p < .001, ηp2 = 0.10. As seen in , students from the Fraction Estimation Game group showed greater improvement in the fraction tasks, thus confirming the hypothesis for RQ2.
Figure 8. Means of the fraction knowledge task scores (standardized) on the pre- and posttests for the spot the relations and fraction estimation game groups. Note. Error bars represent the plus/minus standard errors for the means.
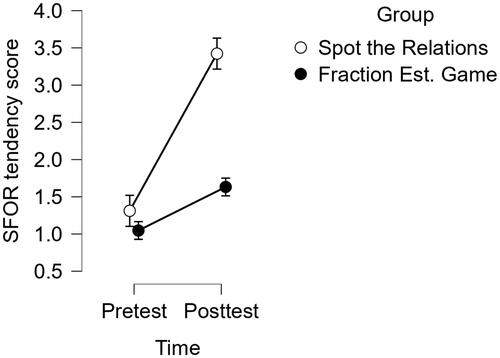
Finally, the intervention effects between groups on the SFOR tendency (RQ 3) were examined. A statistically significant interaction effect was found: F(1, 254) = 31.425, p < .001, ηp2 = 0.11. shows the development of SFOR tendency mean scores for the Spot the Relations and Fraction Estimation Game groups from pre- to posttest. The hypothesis for RQ3 is supported because the Spot the Relations group improved more in their SFOR tendency score than the Fraction Estimation Game group by the posttest. Furthermore, the paired samples t-test revealed that the Fraction Estimation Game group also improved their SFOR tendency over time (t(135) = 3.48, p < .001).
Figure 9. Means of the SFOR tendency task scores on the pre- and posttests for the spot the relations and fraction estimation game groups. Note. Error bars represent the plus/minus the standard errors of the means.
Discussion
The present study compared the effectiveness of two interventions, Spot the Relations and Fraction Estimation Game, in promoting students’ SFOR tendency and their knowledge of multiplicative relations and fractions. In line with our preregistered hypotheses, Spot the Relations was more effective in supporting students’ ability to recognize and describe multiplicative relations (measured multiplicative relations task), whereas the Fraction Estimation Game intervention was more effective in supporting fraction knowledge (fraction knowledge tasks).
We also hypothesized and confirmed that the Spot the Relations intervention was more effective in supporting students’ SFOR tendency. This may be explained by the differences in the instructional practices of the interventions. This finding provides more evidence that SFOR and other spontaneous mathematical focusing tendencies can indeed be supported by interventions (Braham et al., Citation2018; Hannula et al., Citation2005; Hannula-Sormunen et al., Citation2020; McMullen, Hannula-Sormunen, et al., Citation2019). Below, we discuss the theoretical and practical implications of the findings on SFOR tendency and mathematics instruction in general.
Implications for understanding the development of SFOR tendency
Even after years of instruction with multiplicative relations and fractions in formal mathematics lessons, there remain substantial individual differences in students’ SFOR tendency, and substantial amount of students do not spontaneously pay attention to multiplicative relations unless they are specifically guided to do so (McMullen et al., Citation2016). Numerous studies on spontaneous mathematical focusing tendencies have examined their role in the development of formal mathematical knowledge (for recent reviews, see, e.g., McMullen, Chan, et al., 2019; Verschaffel et al., Citation2020). In particular, such tendencies are expected to support the learning of formal mathematical knowledge through increased self-initiated practice with existing mathematical skills in and out of the classroom (Lehtinen et al., Citation2017). Thus, spontaneous mathematical focusing tendencies have been predicted to support the learning of related formal mathematical content. This prediction has been corroborated by studies showing strong longitudinal predictions between spontaneous focusing on numerosity and early mathematical development (Hannula-Sormunen, Citation2015) and between SFOR tendency and rational number development (McMullen et al., Citation2016). Prior experimental evidence of interventions targeting spontaneous mathematical focusing tendencies also shows improved early mathematical and numerical skills (Braham et al., Citation2018; Hannula et al., Citation2005; Hannula-Sormunen et al., Citation2020; McMullen, Hannula-Sormunen, et al., Citation2019) and possibly fraction knowledge (Määttä et al., Citation2022) over time.
However, thus far, there has been little examination of the factors that contribute the most strongly to the development of students’ spontaneous mathematical focusing tendencies themselves. A theoretical framework of factors that influence these tendencies suggests that there may be many possible influences, including prior knowledge of formal mathematics and environmental and social factors. While there is evidence that SFON and SFOR are malleable to instruction (Braham et al., Citation2018; Hannula et al., Citation2005; Hannula-Sormunen et al., Citation2020; McMullen et al., Citation2019), the present study makes a unique contribution to the literature by examining the potential aspects of formal knowledge that may most effectively support the development of the SFOR tendency.
Both prior knowledge of fractions and multiplicative relations have been shown to be related to SFOR tendency and its development. Knowledge of multiplicative relations, especially the ability to recognize and describe the multiplicative relation (including potentially fractional relation) using exact mathematical language, is required for any instance of SFOR. In addition, a more well-developed understanding of the different multiplicative and fractional concepts (e.g., determining exactly what constitutes a “half”) may increase the salience of these mathematical entities in any particular situation. However, the present study reveals that SFOR tendency may benefit most when embedding any instruction of mathematical concepts—be they developing specific mathematical language and vocabulary or formal representational knowledge—within the shared social context of making these concepts explicit targets of focusing. This result is in line with previous theories describing spontaneous mathematical focusing tendencies as being influenced by both formal and informal mathematical knowledge as well as contextual factors (McMullen, Hannula-Sormunen, et al., Citation2019).
Implications for mathematics instruction
Fundamental to our investigation of interventions to support SFOR tendency is the claim that spontaneous mathematical focusing tendencies should themselves be considered desired outcomes of mathematics instruction. This stems from previous evidence that spontaneous mathematical focusing tendencies (in general) and SFOR tendency (in particular) may play valuable roles in the development of mathematical knowledge, as well as from the perspective that the ability to recognize situations in everyday life in which mathematical knowledge is relevant, useful, or essential is itself a stated goal of many educational systems. In this way, even without evidence of the long-term effects of these interventions on students’ fraction knowledge, the present study may have implications for instructional practices in mathematics classrooms. The results of the study indicate that the different instructional practices used in the study not only supported different areas of mathematical knowledge, but also had transfer effects on students’ SFOR tendency. Notably, the results of the study provide further evidence that SFOR tendency is not a fixed feature of mathematical skills but something that can be supported by classroom instruction (McMullen, Hannula-Sormunen, et al., Citation2019).
The present results further inform us of practical ways to support the development of SFOR tendency with classroom instruction (Verschaffel et al., Citation2020). Spot the Relations being more effective in supporting SFOR tendency development could be due to the fact that it considers more factors related to SFOR tendency than the Fraction Estimation Game intervention (McMullen, Chan, et al., 2019). In particular, both interventions focused on factors regarding domain-specific skills and knowledge in their instruction, but only Spot the Relations also focused on mathematical language and contextual factors by making multiplicative relations explicit targets of focusing. The results were not explained by students writing longer answers in the posttest (see Appendix B for analysis), which could mean that some students’ descriptions became more elaborate and mathematically precise by the posttest (e.g., using multiplicative relations instead of numerosity or estimations).
Notably, the factors linked to SFOR tendency in this study (domain-specific skills and knowledge, mathematical language, and contextual factors) may not be the only factors that could be related to SFOR or other spontaneous mathematical focusing tendency development. Although the factors in the present study have gained the most attention so far in attempts to improve the spontaneous mathematical focusing tendencies of children and students (Braham et al., Citation2018; Hannula-Sormunen et al., Citation2020; Määttä et al., Citation2022; McMullen, Hannula-Sormunen, et al., Citation2019), there may be other factors (e.g., emotional, motivational, or anxiety-related) that may also play a role in spontaneous mathematical focusing. While it is possible that the Spot the Relations intervention also supported these more affective features of mathematical development, specific evidence of the relations between these factors and SFOR tendency could prove insightful.
Limitations and further directions
The present study has limitations that lead to new research questions for future studies. First, the professional development sessions for the teachers were delivered in person for the Spot the Relations intervention, but for the Fraction Estimation Game intervention, the sessions were forced to be delivered online. Similar changes took place in running the multiplicative relations and fraction test, as the Spot the Relations group mathematics lesson pretest was conducted by a researcher, but the posttest was administered by the classroom teachers. In comparison, in the Fraction Estimation Game intervention, both the pre- and posttests were administered by the teachers. Therefore, the level of instruction at the time of the pretest could differ between groups. Extra emphasis and guidance on how to run the tests were given to the Fraction Estimation Game group teachers during the teacher development session.
Overall, the study places great emphasis on the teachers involved, as they also delivered the intervention lessons. The tradeoff of such a naturalistic setting may bring real-world limitations, such as different teacher motivations and pedagogical approaches, which would not be applicable in more standardized laboratory settings or with the same researcher presenting the lessons. However, based on the fidelity and results of this study, the teachers were successful in adopting new instructional practices that supported students’ learning even with minimal instruction. Being able to present the lessons shows that such intervention activities could potentially be scaled to more teachers and even school curricula.
Second, although the 5th grade classrooms in the study interventions were from different calendar years, the classrooms were fairly similar regarding their prior knowledge, prior teacher experience, the amount of fractions studied prior to the interventions, and other background variables of the students. A completely randomized sample would offer more robust results regarding the interventions’ effects. Nevertheless, having the preregistration, reporting the ICCs, and controlling for the multilevel nature of the data suggest that the results of the present study are robust.
Finally, the present study used a measure of SFOR tendency that included real-life photos (Määttä et al., Citation2022). Compared to the SFOR tasks used in previous studies (McMullen et al., Citation2019; Van Hoof et al., Citation2016), we used open task instruction and real-life photos to provide a more open and naturalistic way of measuring SFOR tendency. A pilot study with the photo items was ran prior to the present study to determine if the items to be used were sufficiently equivalent for the repeated measures. However, the different context of the photos used within each test may have influenced students’ descriptions of the pictures, as the multiplicative relations might not be equally apparent or salient in every photo for all participants. This variance between the photos may have caused lower internal consistency in the pretest items. While only 54%, of the Spot the Relations group students wrote at least one SFOR description on the pretest, this increased to 85% in the posttest (Fraction Estimation Game group pretest: 48%, posttest: 60%). This indicates that many of the students who did not show evidence of SFOR tendency at the pretest did so at the posttest. The results also imply that although students were able to solve multiplicative relation and fraction tasks when guided to do so, they might not use such mathematical concepts spontaneously in nonmathematical contexts, which is the key attribute of spontaneous mathematical focusing tendency measures (Hannula & Lehtinen, Citation2005; McMullen et al., Citation2014).
The photo description task used in this study provides rich qualitative data from students’ written descriptions. While this study focused solely on SFOR descriptions, it could be useful to also examine other mathematical descriptions and their prevalence in different photos. A more in-depth analysis could reveal the potential interplay between different spontaneous mathematical focusing tendencies (i.e., whether students’ descriptions are mathematically more exact in some photos) and show contextual characteristics in the photos that are more likely to elicit certain types of descriptions.
Although the two interventions in the study had many components that were different, the two interventions were based on a theoretical account of the development of SFOR tendency. The main aim of the present study was to examine how targeting different aspects of mathematical knowledge affect the development of SFOR tendency. Thus, we chose to use these two interventions that have been found to be effective in supporting various mathematical skills and knowledge areas that are related to SFOR (Kiili et al., Citation2018; McMullen, Hannula-Sormunen, et al., Citation2019; Määttä et al., Citation2022). It is possible that the results of the present study could have been different if both interventions had similar dissemination methods (i.e. carried out digitally or non-digitally). Furthermore, the current study did not examine whether students’ motivation was similar across intervention groups. These should be addressed in future studies. Nevertheless, the results allow for more specific studies on the activities by which to best support SFOR tendency and other mathematical knowledge areas in the future using more strictly controlled experimental designs.
Conclusion
The results of the present study further validate the findings of previous studies on SFOR and game-based interventions on students’ mathematical knowledge (Kiili et al., Citation2018; Määttä et al., Citation2022; McMullen, Hannula-Sormunen, et al., Citation2019) while also providing new knowledge about the interplay among SFOR tendency, mathematics learning, and classroom instruction. The results reveal that employing activities that make multiplicative relations explicit targets of focusing in the classroom not only increases their ability to do so when asked in multiplicative relations tasks but also supports their SFOR tendency. Notably, the Fraction Estimation Game training also supported students’ SFOR tendency over time. The present study is one of the first pieces of evidence regarding the relationship between the co-development of spontaneous mathematical focusing tendencies and formal mathematical knowledge (Määttä et al., Citation2022; McMullen, Chan, et al., 2019), especially in terms of how formal mathematical knowledge may impact spontaneous mathematical focusing. However, further studies are required to reveal the exact mechanism and gain further evidence of the suggested self-initiated practice (Lehtinen et al., Citation2017) regarding the development of spontaneous mathematical focusing tendencies and formal mathematical knowledge.
Furthermore, the present study demonstrates that the interventions presented are applicable in 5th-grade classrooms, and the teachers were able to adopt these new instructional practices despite relatively short instruction. The activities were found to support various areas of mathematical knowledge. Thus, such activities should be utilized in classrooms to support the broad development of students’ SFOR tendency and domain-specific mathematical knowledge and skills, ultimately giving them tools that are useful both in mathematics classrooms and in novel situations and everyday life.
Disclosure statement
No potential conflict of interest was reported by the author(s).
Notes
1 Estimation accuracy was calculated based on percent absolute accuracy (100 – ((|Participant’s Answer–Correct Answer|)/Numerical Range * 100)) (e.g., Fazio et al., Citation2016).
References
- Braham, E. J., Libertus, M. E., & McCrink, K. (2018). Children’s spontaneous focus on number before and after guided parent-child interactions in a children’s museum. Developmental Psychology, 54(8), 1492–1498. https://doi.org/10.1037/dev0000534
- Braithwaite, D. W., & Siegler, R. S. (2018). Developmental changes in the whole number bias. Developmental Science, 21(2), 1–13. https://doi.org/10.1111/desc.12541
- Brezovszky, B., McMullen, J., Veermans, K., Hannula-Sormunen, M. M., Rodríguez-Aflecht, G., Pongsakdi, N., Laakkonen, E., & Lehtinen, E. (2019). Effects of a mathematics game-based learning environment on primary school students’ adaptive number knowledge. Computers & Education, 128(2017), 63–74. https://doi.org/10.1016/j.compedu.2018.09.011
- Cohen, D. J., & Blanc-Goldhammer, D. (2011). Numerical bias in bounded and unbounded number line tasks. Psychonomic Bulletin & Review, 18(2), 331–338. https://doi.org/10.3758/s13423-011-0059-z
- Fazio, L. K., DeWolf, M., & Siegler, R. S. (2016). Strategy use and strategy choice in fraction magnitude comparison. Journal of Experimental Psychology. Learning, Memory, and Cognition, 42(1), 1–16. https://doi.org/10.1037/xlm0000153
- Greipl, S., Klein, E., Lindstedt, A., Kiili, K., Moeller, K., Karnath, H.-O., Bahnmueller, J., Bloechle, J., & Ninaus, M. (2021). When the brain comes into play: Neurofunctional correlates of emotions and reward in game-based learning. Computers in Human Behavior, 125, 106946. https://doi.org/10.1016/j.chb.2021.106946
- Hannula, M. M., & Lehtinen, E. (2005). Spontaneous focusing on numerosity and mathematical skills of young children. Learning and Instruction, 15(3), 237–256. https://doi.org/10.1016/j.learninstruc.2005.04.005
- Hannula, M. M., Mattinen, A., & Lehtinen, E. (2005). Does social interaction influence 3-year-old children’s tendency to focus on numerosity? A quasi-experimental study in day care. In L. Verschaffel, E. De Corte, G. Kanselaar, & M. Valcke (Eds.), Powerful environments for promoting deep conceptual and strategic learning (pp. 63–80) Leuven University Press.
- Hannula-Sormunen, M. M. (2015). Spontaneous focusing on numerosity and its relation to counting and arithmetic. In A. Dowker & R. Cohen Kadosh (Eds.), Oxford handbook of mathematical cognition (pp. 275–290) Oxford university press. https://doi.org/10.1093/oxfordhb/9780199642342.013.018
- Hannula-Sormunen, M. M., Nanu, C. E., Luomaniemi, K., Heinonen, M., Sorariutta, A., Södervik, I., & Mattinen, A. (2020). Promoting spontaneous focusing on numerosity and cardinality-related skills at day care with one, two, how many and count, how many programs. Mathematical Thinking and Learning, 22(4), 312–331. https://doi.org/10.1080/10986065.2020.1818470
- Harju, H., Lehtinen, E., & Hannula-Sormunen, M. (2022). Focusing on numerical order in preschool predicts mathematical achievement six years later. In C. Fernández, S. Llinares, A. Gutiérrez, & N. Planas (Eds.), Proceedings of the 45th Conference of the International Group for the Psychology of Mathematics Education (Vol. 2, pp. 347–354). PME.
- Hedges, L. V., & Rhoads, C. (2010). Statistical power analysis. International Encyclopedia of Education, NCSER 2010-3006, 436–443. https://doi.org/10.1016/B978-0-08-044894-7.01356-7
- Hornburg, C. B., Schmitt, S. A., & Purpura, D. J. (2018). Relations between preschoolers’ mathematical language understanding and specific numeracy skills. Journal of Experimental Child Psychology, 176, 84–100. https://doi.org/10.1016/j.jecp.2018.07.005
- Jordan, N. C., Hansen, N., Fuchs, L. S., Siegler, R. S., Gersten, R., & Micklos, D. (2013). Developmental predictors of fraction concepts and procedures. Journal of Experimental Child Psychology, 116(1), 45–58. https://doi.org/10.1016/j.jecp.2013.02.001
- Kiili, K., Moeller, K., & Ninaus, M. (2018). Evaluating the effectiveness of a game-based rational number training – In-game metrics as learning indicators. Computers & Education, 120, 13–28. https://doi.org/10.1016/j.compedu.2018.01.012
- Koskinen, A., McMullen, J., Hannula-Sormunen, M., Ninaus, M., & Kiili, K. (2023). The strength and direction of the difficulty adaptation affect situational interest in game-based learning. Computers & Education, 194, 104694. https://doi.org/10.1016/j.compedu.2022.104694
- Lehtinen, E., & Hannula, M. M. (2006). Attentional processes, abstraction and transfer in early mathematical development. In Instructional psychology: Past, present and future trends. Fifteen essays in honour of Erik De Corte (Vol. 49, 39–55). Elsevier.
- Lehtinen, E., Hannula-Sormunen, M. M., McMullen, J., & Gruber, H. (2017). Cultivating mathematical skills: From drill-and-practice to deliberate practice. ZDM, 49(4), 625–636. https://doi.org/10.1007/s11858-017-0856-6
- Lobato, J., Rhodehamel, B., & Hohensee, C. (2012). “Noticing” as an alternative transfer of learning process. Journal of the Learning Sciences, 21(3), 433–482. https://doi.org/10.1080/10508406.2012.682189
- McMullen, J., Chan, J., Mazzocco, M. M. M., & Hannula-Sormunen, M. M. (2019). Spontaneous mathematical focusing tendencies in mathematical development and education. In Constructing number: Merging perspectives from psychology and mathematics education (pp. 69–86). Springer. https://doi.org/10.1007/978-3-030-00491-0_4
- McMullen, J., Hannula-Sormunen, M. M., Kainulainen, M., Kiili, K., & Lehtinen, E. (2019). Moving mathematics out of the classroom: Using mobile technology to enhance spontaneous focusing on quantitative relations. British Journal of Educational Technology, 50(2), 562–573. https://doi.org/10.1111/bjet.12601
- McMullen, J., Hannula-Sormunen, M. M., Laakkonen, E., & Lehtinen, E. (2016). Spontaneous focusing on quantitative relations as a predictor of the development of rational number conceptual knowledge. Journal of Educational Psychology, 108(6), 857–868. https://doi.org/10.1037/edu0000094
- McMullen, J., Hannula-Sormunen, M. M., & Lehtinen, E. (2014). Spontaneous focusing on quantitative relations in the development of children’s fraction knowledge. Cognition and Instruction, 32(2), 198–218. https://doi.org/10.1080/07370008.2014.887085
- McMullen, J., Hannula-Sormunen, M. M., & Lehtinen, E. (2017). Spontaneous focusing on quantitative relations as a predictor of rational number and algebra knowledge. Contemporary Educational Psychology, 51, 356–365. https://doi.org/10.1016/j.cedpsych.2017.09.007
- McMullen, J., Koskinen, A., Kärki, T., Lindstedt, A., Määttä, S., Halme, H., Lehtinen, E., Hannula-Sormunen, M. M., & Kiili, K. (2023). A game-based approach to promoting adaptive rational number knowledge. Mathematical Thinking and Learning, 1–17. https://doi.org/10.1080/10986065.2023.2177818
- Määttä, S., Hannula-Sormunen, M. M., Halme, H., & McMullen, J. (2022). Guiding students’ attention towards multiplicative relations around them: A classroom intervention. Journal of Numerical Cognition, 8(1), 36–52. https://doi.org/10.5964/jnc.6363
- National Mathematics Advisory Panel. (2008). Foundations for success: The final report of the National Mathematics Advisory Panel. U.S. Department of Education. https://files.eric.ed.gov/fulltext/ED500486.pdf
- Ni, Y., & Zhou, Y. D. (2005). Teaching and learning fraction and rational numbers: The origins and implications of whole number bias. Educational Psychologist, 40(1), 27–52. https://doi.org/10.1207/s15326985ep4001_3
- Ninaus, M., Kiili, K., McMullen, J., & Moeller, K. (2017). Assessing fraction knowledge by a digital game. Computers in Human Behavior, 70, 197–206. https://doi.org/10.1016/j.chb.2017.01.004
- Nunes, T., & Bryant, P. E. (2015). The development of mathematical reasoning. Handbook of Child Psychology and Developmental Science., 1–48 John Wiley & Sons, Inc. https://doi.org/10.1002/9781118963418.childpsy217
- Nunes, T., Schliemann, A. D., & Carraher, D. W. (1993). Street mathematics and school mathematics. Cambridge University Press.
- Purpura, D. J., Napoli, A. R., Wehrspann, E. A., & Gold, Z. S. (2017). Causal connections between mathematical language and mathematical knowledge: A dialogic reading intervention. Journal of Research on Educational Effectiveness, 10(1), 116–137. https://doi.org/10.1080/19345747.2016.1204639
- Rathé, S., Torbeyns, J., De Smedt, B., & Verschaffel, L. (2019). Spontaneous focusing on Arabic number symbols and its association with early mathematical competencies. Early Childhood Research Quarterly, 48, 111–121. https://doi.org/10.1016/j.ecresq.2019.01.011
- Riccomini, P. J., Smith, G. W., Hughes, E. M., & Fries, K. M. (2015). The language of mathematics: The importance of teaching and learning mathematical vocabulary. Reading & Writing Quarterly, 31(3), 235–252. https://doi.org/10.1080/10573569.2015.1030995
- Schneider, M., & Siegler, R. S. (2010). Representations of the magnitudes of fractions. Journal of Experimental Psychology. Human Perception and Performance, 36(5), 1227–1238. https://doi.org/10.1037/a0018170
- Siegler, R. S., Thompson, C. A., & Opfer, J. E. (2009). The logarithmic-to-linear shift: One learning sequence, many tasks, many time scales. Mind, Brain, and Education, 3(3), 143–150. https://doi.org/10.1111/j.1751-228X.2009.01064.x
- Siegler, R. S., Thompson, C. A., & Schneider, M. (2011). An integrated theory of whole number and fractions development. Cognitive Psychology, 62(4), 273–296. https://doi.org/10.1016/j.cogpsych.2011.03.001
- Siemon, D., Breed, M., Virgona, J. (2005). From additive to multiplicative thinking: The big challenge of the middle years [Paper presentation]. Proceedings of the 42nd Conference of the Mathematical Association of Victoria. Bundoora: The Mathematical Association of Victoria (pp. 278–286). Mav.
- Van Hoof, J., Degrande, T., McMullen, J., Hannula-Sormunen, M. M., Lehtinen, E., Verschaffel, L., & Van Dooren, W. (2016). The relation between learners’ spontaneous focusing on quantitative relations and their rational number knowledge. Studia Psychologica, 58(2), 156–170. https://doi.org/10.21909/sp.2016.02.714
- Van Hoof, J., Verschaffel, L., & Van Dooren, W. (2015). Inappropriately applying natural number properties in rational number tasks: Characterizing the development of the natural number bias through primary and secondary education. Educational Studies in Mathematics, 90(1), 39–56. https://doi.org/10.1007/s10649-015-9613-3
- Verschaffel, L., Rathé, S., Wijns, N., Degrande, T., van Dooren, W., De Smedt, B., & Torbeyns, J. (2020). Young children’s early mathematical competencies: The role of mathematical focusing tendencies. In M. Carlsen, I. Erfjord, & P. S. Hundeland (eds.), Mathematics Education in the Early Years. Springer, Cham. https://doi.org/10.1007/978-3-030-34776-5_2
- Wijns, N., De Smedt, B., Verschaffel, L., & Torbeyns, J. (2020). Are preschoolers who spontaneously create patterns better in mathematics? The British Journal of Educational Psychology, 90(3), 753–769. https://doi.org/10.1111/bjep.12329
- Yang Hansen, K., Gustafson, J. E., & Rosén, M. (2014). School performance differences and policy variations in Finland, Norway and Sweden. In K. Y. Hansen, J.-E. Gustafsson, M. Rosén, S. Sulkunen, K. Nissinen, P. Kupari, R. F. Ólafsson, J. K. Björnsson, L. S. Grønmo, L. Rønberg, & J. Mejding (Eds.), Northern lights on TIMSS and PIRLS (pp. 25–47). Nordic Council of Ministers.
Appendix A:
Fraction task sum scores and standard deviations (SD)
Appendix B:
Photo description task (SFOR tendency) word count analysis
The amount of words used by students in the photo description (SFOR tendency) task was examined to determine whether the results in the task could be due to Spot the Relations group writing longer descriptions in the posttest (). The mean numbers of words written by the Spot the Relations group wrote were 98.35 (standard deviation 36.2) in the pretest items and 94.86 (34.9) on the posttest items. The mean numbers of words written by the Fraction Estimation Game group were 92.95 (37.6) in the pretest items and 92.48 (42.2) in the posttest items. Independent samples t-test revealed that the means between the groups were not statistically significantly different at the time of the pretest (t = 1.200, df = 272, sig = .231) or at the posttest (t = 0.503, df = 271, sig = .615).
Table 6. Mean (standard deviations) of words used in the photo description (SFOR tendency) task items.
Appendix C
What happened during the lesson? Fill in right after the lesson. Spot the relations lesson 1.
Questionnaire (circle the most appropriate option)
We went through the topics in powerpoint:
All of the slides | approximately half of the slides | few slides
Observation:
How many students in your opinion had struggles at recognizing multiplicative relations and describe them precisely, mathematically?
Approximately ______ students.
How many students recognized more multiplicative relations than before the lesson?
Approximately ______ students.
How many flexibly recognized many different multiplicative relations during the lesson?
_____ students. Feedback:
Where did you succeed during the lesson? Do you have any suggestions on how to make the lesson better or was something unclear?
Students’ that were not present during the lesson (codes of the students).
_________________________________________________________________________
What happened during the lesson? Fill in right after the lesson. Spot the Relations lesson 2
Questionnaire (circle the most appropriate option)
We played Spot the Relations -card games:
Most of the students succeeded | part of the students succeeded | few of the students succeeded ……at playing the games
Observation:
How many students in your opinion had struggles at recognizing multiplicative relations and describe them precisely, mathematically?
Approximately ______ students.
How many students recognized more multiplicative relations than before the lesson?
Approximately ______ students.
How many flexibly recognized many different multiplicative relations during the lesson?_____ students.
Feedback:
Where did you succeed during the lesson? Do you have any suggestions on how to make the lesson better or was something unclear?
Students’ that were not present during the lesson (codes of the students).
_________________________________________________________________________
What happened during the lesson? Fill in right after the lesson. Spot the Relations lesson 3
Questionnaire (circle the most appropriate option)
Students found multiplicative relations during the scavenger hunt:
Most | approximately half | few …of the students found multiplicative relations during the scavenger hunt
Observation:
How many students in your opinion had struggles at recognizing multiplicative relations and describe them precisely, mathematically?
Approximately ______ students.
How many students recognized more multiplicative relations than before the lesson?
Approximately ______ students.
How many flexibly recognized many different multiplicative relations during the lesson?_____ students.
Feedback:
Where did you succeed during the lesson? Do you have any suggestions on how to make the lesson better or was something unclear?
Students’ that were not present during the lesson (codes of the students).
_________________________________________________________________________
What happened during the lesson? Fill in right after the lesson.Spot the Relations lesson 4
Questionnaire (circle the most appropriate option)
Students planned a new scavenger hunt for each other and solved each others scavenger hunts: Most of the students succeeded | Part of the students succeeded | Few of the students succeeded
Observation:
How many students in your opinion had struggles at recognizing multiplicative relations and describe them precisely, mathematically?
Approximately ______ students.
How many students recognized more multiplicative relations than before the lesson?
Approximately ______ students.
How many flexibly recognized many different multiplicative relations during the lesson?_____ students.
Feedback:
Where did you succeed during the lesson? Do you have any suggestions on how to make the lesson better or was something unclear?
Students’ that were not present during the lesson (codes of the students).
_________________________________________________________________________
Questionnaire: Game lesson 1 (Circle the most appropriate option)
I followed students’ progress on learning analytics view.
Yes | No
I recognized via learning analytics view that some student had difficulties.
Yes | No
After recognizing difficulties I helped the student.
Yes | No
There were technical difficulties during the game lesson.
Yes | No
The learning analytics was useful.
Completely disagree 1 2 3 4 5 6 Completely agree
[Free space to write open answer or feedback]
Questionnaire: Game lesson 2 (Circle the most appropriate option)
I followed students’ progress on learning analytics view.
Yes | No
I recognized via learning analytics view that some student had difficulties.
Yes | No
After recognizing difficulties I helped the student.
Yes | No
There were technical difficulties during the game lesson.
Yes | No
The learning analytics was useful.
Completely disagree 1 2 3 4 5 6 Completely agree
[Free space to write open answer or feedback]
Questionnaire: Game lesson 3 (Circle the most appropriate option)
I followed students’ progress on learning analytics view.
Yes | No
I recognized via learning analytics view that some student had difficulties.
Yes | No
After recognizing difficulties I helped the student.
Yes | No
There were technical difficulties during the game lesson.
Yes | No
I found “interest” ja “belief in own skills” -learning analytics view parts useful
Completely disagree 1 2 3 4 5 6 Completely agree
The learning analytics was useful.
Completely disagree 1 2 3 4 5 6 Completely agree
[Free space to write open answer or feedback]
Questionnaire: Game lesson 4 (Circle the most appropriate option)
I followed students’ progress on learning analytics view.
Yes | No
I recognized via learning analytics view that some student had difficulties.
Yes | No
After recognizing difficulties I helped the student.
Yes | No
There were technical difficulties during the game lesson.
Yes | No
I found “interest” ja “belief in own skills” -learning analytics view parts useful
Completely disagree 1 2 3 4 5 6 Completely agree
The learning analytics was useful.
Completely disagree 1 2 3 4 5 6 Completely agree
[Free space to write open answer or feedback]