
 ?Mathematical formulae have been encoded as MathML and are displayed in this HTML version using MathJax in order to improve their display. Uncheck the box to turn MathJax off. This feature requires Javascript. Click on a formula to zoom.
ABSTRACT
Growing concern over potential ecotoxicological problems caused by micropollutants (MPs) in water has led to the application of adsorptive and oxidative advanced treatment technologies at European wastewater treatment plants (WWTPs). Direct dosage of gaseous ozone via diffusers or pump-injection systems is the most common large-scale process applied in water and wastewater treatment. Studies point out that MP removal may take place via the direct, very selective reaction with the ozone molecule as well as the indirect reaction with the very reactive but nonselective hydroxyl radicals. Several process parameters and set-ups may affect the MPs elimination and inhibit or even cause the formation of transformation products (TPs) such as bromate. This work compares an alternative ozone application procedure (the so-called ‘ozone strong water’ dosing – OSW) with standard systems regarding MP elimination, ozone consumption, reaction time, and required plant space. A full-scale OSW system was installed and operated at the WWTP Duisburg-Vierlinden. A significant reduction in the time required to achieve the maximum possible elimination was observed for all six MPs investigated, with a hydraulic reaction time of 8 min. According to a theoretical calculation, the reactor volume could be reduced by two-thirds of the installed volume.
Introduction
Residual concentrations of a large variety of pharmaceuticals and chemicals threaten the well-being of aquatic ecosystems and deteriorate the quality of water bodies (Anjali and Shanthakumar Citation2019; Krishnan et al. Citation2021; Pistocchi et al. Citation2022; Schwarzenbach et al. Citation2006). Negative effects of these compounds, collectively called ‘micropollutants’ (MP), have been extensively investigated in recent years. Studies have shown adverse effects of various MP on aquatic organisms and/or human health even at very low concentration levels (in ng/L to µg/L) (Dopp et al. Citation2021; Kosek et al. Citation2020; Leusch et al. Citation2018; Li et al. Citation2019; Petrie, Barden and Kasprzyk-Hordern Citation2015). Despite the need to remove MPs from wastewater to avoid their negative ecological impacts, most of the conventional wastewater treatment plants (WWTPs) are generally not designed to achieve efficient elimination of MPs (Lei et al. Citation2023; Luo et al. Citation2014). Hence, the imperative for advanced treatment techniques, specifically oxidative and adsorptive treatments, has grown significantly (Harth et al. Citation2018; Krishnan et al. Citation2021; Saravanan et al. Citation2022).
Oxidative treatment processes have proven effective in substantially eliminating MPs in drinking water and wastewater treatment (Guo et al. Citation2021; Von Sonntag and Von Gunten Citation2012). In wastewater treatment, MP oxidation is mainly performed by directly adding gaseous ozone, commonly known as ozonation. The high oxidation potential of ozone enables it to undergo a direct selective reaction with inorganic and organic compounds, including MPs. This leads to a partial mineralization and MP degradation. Another set of techniques, known as advanced oxidation processes (AOPs), have been extensively studied, particularly at the laboratory scale, to assess their performance by the MPs elimination (Ameta et al. Citation2018; Mierzwa, Rodrigues and Teixeira Citation2018; Saravanan et al. Citation2022). AOPs encompass various technologies, commonly centered on the production of hydroxyl radicals, including catalytic processes (e.g., fenton) or the addition of H2O2 and ozone (i.e., peroxone process), for instance (Choi et al. Citation2022). These hydroxyl radicals possess an oxidation potential higher than ozone, resulting in highly reactive but nonselective oxidizing species capable of removing even ozone-resistant MPs in water (Dogruel et al. Citation2020). However, their application in full-scale is still under investigation.
During a conventional ozonation, natural organic matter (NOM) in the effluent reacts with ozone, catalyzing the formation of hydroxyl radicals through complex mechanisms where the ozone molecule decays in multiple reactions. The expected outcome includes the formation of different reactive oxygen species, but especially hydroxyl radical formation is expected (Mecha and Chollom Citation2020). Therefore, conventional ozonation processes can also be considered as advanced oxidation processes (AOPs) in the case of wastewater treatment (Cunha et al. Citation2022; Domingues et al. Citation2021). However, the detailed degradation process of MPs becomes more challenging with the formation of increasingly oxidative species.
Although understanding the reactions involved during the elimination of a specific MP is intricate and requires extensive studies, the main reaction pathways typically involve selective reactions with molecular ozone or nonselective, but highly reactive hydroxyl radicals formed in-situ (Patel et al. Citation2020; Von Gunten, Citation2003). The study of all reaction pathways and the species involved and formed is highly complex and normally not contemplated during the planning, operation or monitoring of an ozonation plant.
Challenges and considerations
The regulations on micropollutants in wastewater discharge vary across Europe, with the Urban Wastewater Treatment Directive and Drinking Water Directive mandating the water quality standards of the discharged wastewater based on the population and the sensitivity of the receiving waters (EU Citation2020/2184/2184; Kosek et al. Citation2020; Petrie, Barden and Kasprzyk-Hordern Citation2015). In the case of Germany, there are still no legally binding limit values for the discharge of most micropollutants into surface water, and the permissible concentration levels of various MPs differ in each region. In North Rhine-Westphalia, where this study was conducted, six substances regulate MP elimination in wastewater treatment plants (KOM-M.NRW Citation2016). In addition, an average elimination of 80% for the six MPs, known as indicator parameters, during the whole wastewater treatment is also suggested. Comparatively, Baden-Württemberg monitors seven MPs (KOMS Citation2020), and Switzerland specifies the analysis of 12 (UVEK Citation2016). Disparities in legislation hinder a comprehensive assessment of current risks, prevent the development of a unified analysis plan and lead to difficulties in comparing the efficacy of various technologies.
Despite the several benefits of ozone in the wastewater treatment, a full-scale application of ozonation processes for MP elimination is associated with several challenges, the primary ones being the high operational costs and the formation of transformation products. Ozone production in commercial ozone generators involves oxygen gas subjected to corona discharge, resulting in a part of the oxygen getting converted to ozone (10–15 wt. % ozone in O2/O3 mixture). Hence, during an ozonation process, the production of the required ozone gas requires a substantial supply of oxygen and energy, resulting in a significant requirement for energy and elevated operational costs when adopted for MP elimination in a typical WWTP (Arzate et al. Citation2019; Bilal et al. Citation2022; Wei et al. Citation2016). Due to the increased energy costs and possible environmental impacts of a high energy demanding process, it becomes imperative to minimize the energy consumption of an ozone plant.
Moreover, ozonation only achieves partial oxidation rather than mineralization of MPs, resulting in the formation of transformation products. Furthermore, ozone reactions with dissolved organic compounds, generally defined as dissolved organic carbon (DOC), lead to further production of TPs. TPs formation represents a major drawback of the ozonation processes due to its risks for biota and aquatic ecosystems (Bilal et al. Citation2022; Dopp et al. Citation2021; Fischbacher et al. Citation2015; Jahan, Li and Pagilla Citation2021; Pei et al. Citation2019). This issue must be addressed for widespread and safe application of oxidation processes, especially when potentially hazardous materials such as bromate (BrO3−) or nitrosamines are expected. To degrade the resulting TPs, a biological post-treatment immediately after ozonation is usually recommended (Böhler et al. Citation2017; KOM-M.NRW Citation2016). Besides its ability to remove organic components easily accessible to microorganisms, collectively analyzed as AOC (Assimilable Organic Carbon), this treatment can also partially or completely degrade toxic nitrosamines under aerobic conditions (Schindler et al. Citation2015). Nevertheless, bromate cannot be eliminated in the downstream biological treatment. Therefore, avoiding bromate formation is one of the biggest challenges in this domain and an important research question (Dopp et al. Citation2021; Jahan, Li and Pagilla Citation2021; Morrison et al. Citation2023).
Finally, an optimization of the relevant process parameters influencing ozonation applications is crucial for full-scale implementation, especially with regard to MP elimination, energy consumption, ozone dosage and the production of hazardous transformation products (Babcock et al. Citation2022; Jahan, Li and Pagilla Citation2021). While there has been research into identifying potential improvements for an enhanced performance of ozonation at the laboratory scale (Jahan, Li and Pagilla Citation2021; Morrison et al. Citation2023), full-scale studies are still rare.
Optimizing ozone injection
One of the requirements for better implementation of ozone-based technologies is their further optimization to reduce operational costs of the system. The injection technique through which ozone is added remains one of the critical factors for improvement. Typically, wastewater streams are treated during ozonation by injecting gaseous ozone using diffusers or pump injector (venturi) systems, both considered as standard technologies. In a standard ozonation technology, ozone gas is directly added to a large reaction basin that holds the water to be treated. Hence, in this scenario, the three process steps, i.e., mass transfer, mixing and reaction, are generally carried out simultaneously in the same reaction basin (Da Silva and Jardim Citation2006; Saravanan et al. Citation2022). Although the standard ozonation has a relatively simple operational design, one of its major drawbacks is the large size of the reaction basin required to achieve ozonation. This is because when a single reaction basin is used for all three process steps (mass transfer, mixing, and reaction), the reaction basin needs to be sized based on the slowest process step, i.e., the gas dissolution step (mass transfer). This is much slower compared to the reaction step, requiring large volumes to permit a residence time of almost 30 minutes. In addition, the system has other limitations, such as non-uniform dissolved ozone within the basin, leading to fluctuations in dissolved ozone concentration and challenges in controlling the ozone dosage based on the required extent of MP elimination. An excess of the ozone dosed during the treatment process increases the operational costs associated with ozonation and would have a relevant impact on the formation of transformation products. It is, hence, essential to achieve better control of the ozone dosage required for MPs elimination in the ozonation systems to reduce energy consumption in WWTPs and avoid the formation of ecotoxicological transformation products such as bromate (Jahan, Li and Pagilla Citation2021; Wei et al. Citation2016).
One alternative ozone dosing focused on improving the performance of ozonation systems is the ‘Ozone Strong Water’ (OSW) technology. The primary distinction between an OSW system and standard ozonation technologies involves separating the ozonation process steps into three delimited process units that can be optimized independently. In the first process unit (mass transfer step), gaseous ozone is injected and dissolved into a small part of the process water flow (referred to as ‘feed liquid’ in this discussion), including the use of elevated pressures (5 to 10 bar) and the reduction of the pH using carbon dioxide to increase the solubility and stability of ozone in the solution. Such an operational scheme for ozone dissolution generates a gas-free ozonated liquid with high concentrations of dissolved ozone. This gas-free ozonated liquid, called ‘Ozone Strong Water’ in this work, is then injected back into the remaining process of water flow through specially designed nozzles. These injection nozzles, combined with an inline static mixer, constitute the ‘mixing’ step, in which a uniform concentration of dissolved ozone is achieved within the process water. A homogeneous distribution of the dissolved ozone concentration in the process flow is achieved using a standard liquid-liquid inline static mixer downstream of the injection nozzles. Finally, the dissolved ozone reacts with the dissolved pollutants in an open tank (reaction tank), constituting the third and final steps of the ozonation process.
A comparison of the standard ozonation process performed in a single reactor () and the separated process steps of the OSW system () is shown in .
Figure 1. Block flow diagrams of studied ozone injection technologies: (a) conventional line; (b) OSW line. The main three process steps – mass transfer, mixing and reaction – are shown in each case. In the conventional line, these processes occur simultaneously in a reaction basin, while the OSW treatment line separates them in three independent units. During the mass transfer step, a highly concentrated dissolved ozone solution (OSW) is produced under pH adjustment with CO2 addition (down to 5). The mixture of the OSW with the process liquid occurs in a static mixer, while the reaction step takes place at the reaction basin already installed.
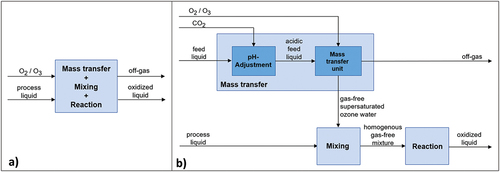
As shown in for an OSW system, the dissolution of ozone into water and its reaction with the target pollutant compounds occurs within separate process units. Since the mass transfer step constitutes the rate-limiting step in an ozonation process, an increase in the mass-transfer rate in an OSW system could lead to a reduction of the required reactor size compared to standard injection systems.
Aim of this study
This work evaluates the performance of a full-scale OSW system, focusing on MP elimination. Additionally, it compares the performance of the OSW injection plant with standard injection systems. The investigated technologies were installed and operated at the WWTP Duisburg-Vierlinden, Germany between December 2021 and June 2022. Data from previous studies conducted between 2011 and 2013 were also presented for comparison purposes (in part reported by Tuerk et al. (Citation2017)). The novel OSW system is expected to lead to an increased elimination of micropollutants with low specific ozone doses and a simultaneous reduction in the required reactor size compared to standard injection systems.
The analysis considered various parameters, such as the space required for a new installation, the elimination of key MPs (1H-benzotriazole, carbamazepine, clarithromycin, diclofenac, metoprolol, and sulfamethoxazole suggested by KOM-M.NRW (Citation2016) for WWTP evaluation), the reaction time needed for maximal elimination after the dosage of ozone, and the specific ozone dose required to achieve an average elimination of 80%. In this study, the achievement of the average elimination of 80% was reported by only considering the ozonation step. To the authors’ knowledge, this is the first study comparing three different ozone injection procedures (OSW, pump-injection, and diffuser systems) for MP elimination at full-scale at the same wastewater treatment plant.
Materials and methods
The performance of an OSW system for MP elimination was investigated through 13 campaigns between December 2021 and June 2022 at the WWTP Duisburg-Vierlinden in Germany. WWTP Duisburg-Vierlinden was originally designed for a population equivalent (PE) of 30,000. The wastewater influence has no relevant industrial or commercial discharges and, hence, low concentrations of micropollutants from industrial processes were expected in the effluent from the WWTP.
In order to implement an ozone-based tertiary treatment for MP removal, an ozonation plant was constructed at the WWTP Duisburg-Vierlinden in 2011 for the treatment of 400 m3/h of secondary clarifier effluent. The ozonation plant had two independent treatment lines capable of treating up to 200 m3/h of secondary effluent (process flow) per line. Two separate reaction basins, each with a volume of 67 m3 were incorporated into each treatment line. During the initial operational years (2011–2013), a preliminary study compared the effectiveness of diffusers and a pump injector system as ozone injection technologies while operating simultaneously. In 2014, the diffuser-based design was replaced with a second pump injector system, leading to the operation of both treatment lines with only pump injector systems. In 2021, an OSW pilot plant replaced the pump injector system of one treatment line during the duration of the actual study (2021–2022). A description of the various ozonation designs investigated in this work is included below.
Standard injection systems
A standard injection system utilizing a venturi injector design was used in one of the treatment lines with a nominal treatment capacity of 200 m3/h. The ozone was produced using a SMOevoPLUS 410 (XYLEM Water Solutions Deutschland GmbH, Langenhagen, Germany). The pump injector system consisted of high-pressure centrifugal pumps (Type SV 16, LOWARA Deutschland GmbH, flow rate 9–24 m3/h, nominal capacity 16 m3/h, Großostheim, Germany). Ozone concentration was measured in water only at the outlet using an Orbisphere sensore (Hach Lange GmbH, Berlin, Germany). The ozone dosage was maintained proportionally depending on the secondary effluent flow, by already calibrated characteristic curves. The reaction basin had a volume of 67 m3 with a water depth of 5 m, permitting a residence time of 30 minutes for the inlet flow. The ozone flow rate was variable and, depending on the DOC of the water to be treated, different specific ozone doses (gO3/gDOC) could be achieved.
Data from previous investigations conducted at the same WWTP were used for comparison purposes (Tuerk et al. Citation2017). Among these, ozone was dosed through the installed pump injector system (described above) as well as using diffusers. In this design, 14 ceramic disk diffusers (Type Aerocor, Xylem Water Solutions Nederland B.V., DOM-Diffuser with a diameter of 178 mm, Dordrecht, Netherlands) were used to bubble ozone gas directly into the reactor basin. The reactor basin had a volume of 67 m3 permitting a residence of 30 minutes for the water flow. During this previous study, clarithromycin was not part of the indicator parameters list suggested by KOM-M.NRW (Citation2016) and, therefore, this substance was not measured at that time.
Ozone strong water system
The OSW system was implemented at the WWTP Duisburg-Vierlinden by replacing the ozone generation and injection steps for one of the treatment lines during of the experimental study. The existing reactor with a volume of 67 m3 was still used as the reaction basin. The ozone-gas was produced using an ozone generator (XYLEM Water Solutions Deutschland GmbH, SMOevoPLUS 410, Langenhagen, Germany) with pure oxygen as feed gas. The ozone gas generated was dissolved into water using a two-step ozone dissolution process, consisting of two separate stainless-steel contactor columns at elevated pressures. The first contactor column (‘pretreatment column’) was maintained at a head-space pressure ranging between 1 and 3 barrelative, while the second contactor column (‘main contactor’) was at a head-pressure between 3 and 6 barrelative. The exposure time in each contactor could be set between 5 and 30 minutes. Ozone gas generated was added to the main contactor using a pump injector system, comprising of a pump (KSB SE&Co. KGaA, Etabloc ETB 050–032 with PumpDrive2 Eco) and a venturi-nozzle (KÖRTING Hannover AG, liquid-gas-jet compressor DN25/25/25). The off-gas of the second contactor was then injected via diffuser into the first contactor. The off-gas of the first contactor that is predominantly oxygen can either be released into the atmosphere after passing through a catalytic vent ozone destructor (AIR LIQUIDE Deutschland GmbH, VOD K-005) or used for aeration purposes without further compression.
The gas stream enters the OSW system into the main column, then flows into the pretreatment column and finally leaves the system through the pretreatment column. The flow of the liquid stream was maintained in a counter-current direction. A part of the process flow was pumped into the pretreatment column at a rate of 2–10 m3/h using a high-pressure pump (KSB SE&Co. KGaA, Etabloc ETB 050–032 with PumpDrive2 Eco) equipped with a Variable-Frequency Drive (VFD). A 300 μm filter was installed downstream to limit the concentration of suspended matter in the water being pumped into the column. Inside the pretreatment column, the water came into contact with the off-gas stream from the main column. The pre-ozonated water from the pretreatment column was then transferred by a second pump into the main column, where it comes into contact with fresh ozone gas added using a venturi nozzle. For the stabilization of the dissolved ozone during OSW production, the pH of the feed liquid is adjusted between pH 5 to 6 by addition of CO2 into the second contactor. In this way, gas-free ozone solutions with concentrations of up to 150 mg/L dissolved ozone were achieved in continuous operation. When using tap-water instead of secondary effluent as feed liquid in this unit, even concentrations of up to 200 mg/L dissolve ozone were achieved.
The ozone dosage in the process water was adjusted during the experiments by modifying the amount of ozone added into the process liquid through OSW injection. For maintaining a flow-proportional ozone dosage, the flow of the process liquid in the main pipe is monitored online (Promag P 300 DN 200, Endress+Hauser, Weil am Rhein, Germany). The dissolved ozone concentration of the gas-free OSW as well as its flow are continuously measured and controlled accordingly by a control valve (Promag P300 DN 50, SCHUBERT&SALZER Control Systems GmbH, GS 8231, Ingolstadt, Germany). Furthermore, a specially designed injector unit consisted of five injection nozzles (AIR LIQUIDE Deutschland GmbH, OW-VN-363, Düsseldorf, Germany), followed by an inline static mixer (STRIKO Verfahrenstechnik GmbH, DN200-4×0,5k-1.4571-Chain, WiehlBomig, Germany), is used for preventing degassing of ozone and oxygen during the injection of the OSW into the main pipe. Directly after the static mixer, the dissolved ozone concentration of the homogeneously mixed process liquid and the OSW was measured continuously using an ozone sensor (Orbisphere, Hach Lange GmbH, Berlin, Germany; membrane 2956A from 0 ppb to 50 ppm, transmitter 410C, sensor C1100), before the resulted flow is led into the reactor.
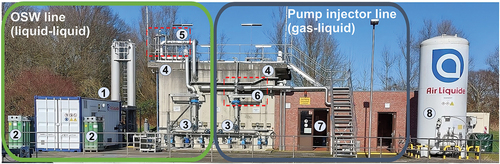
shows the ozonation step of the WWTP Duisburg-Vierlinden and the main sections of both treatment lines.
Figure 2. Ozonation as advanced treatment step of the WWTP Duisburg-Vierlinden, Wirtschaftsbetriebe Duisburg – aöR Germany. The plant is equipped with two independent treatment lines operating parallelly. In the picture, the OSW treatment line is depicted on the left side and the standard technology line on the right side. Numbers in the picture correspond to: 1) OSW production plant (ozone generator container and contactors), 2) CO2 supply, 3) the influent pipes to reactors, 4) independent reactor basins (left: OSW treatment, right: standard pump injection), 5) OSW injection using a static mixer, 6) ozone gas injection for the standard injection system, 7) ozone generator and equipment location of the pump injector system, and 8) O2 supply.
Sampling points and determination of specific ozone dose
A broad range of specific ozone doses, ranging from 0.1 to 1.6 gO3/gDOC, was investigated in this work for the pump injector system and the OSW system. To compare the performance of both ozonation approaches under similar operating conditions, wastewater samples were taken after the secondary clarifier (i.e., before ozone addition) and at the outlet of the reaction basin for both the standard injection and the ozone strong water treatment line. Various analytical methods were implemented to perform a basic characterization and to determine MP concentrations. In the OSW system, an additional sampling point downstream of the static mixer, but before the reaction basin, was also selected to assess the required contact time and the ozone consumption immediately after the injection of the OSW into the process water. The ozone reactions in this sample were stopped after different reaction times using a potassium iodide (KI) solution to analyze the extent of the ozone reaction and contact time required to achieve maximal MP elimination.
To calculate the specific ozone dose, the ozone concentration added to the process flow and the initial DOC before ozonation, both in g/L, must be determined. The initial DOC concentration in the feed liquid before the addition of ozone was measured using the standard DIN EN 1484 protocols. In the case of the treatment line employing standard ozonation, characteristic curves were already established on site and used to adjust the ozone dosage in response to the process of inlet flow. Using the standard technologies, ozone gas was injected into the same reaction basin where the reaction occurs. Hence, the amount of ozone added to the process could be estimated from the dissolved ozone concentration in the process liquid. The specific ozone dose, in gO3/gDOC, was calculated in the standard ozonation according to equation 1.
In the OSW system, ozone dissolution in the feed water was performed in a separate dissolution column, while the dosing (i.e., the addition of ozone strong water into the process water) was performed in a static mixer. The ozone dosage, in this case, could be estimated from the flowrates (in L/min) and the dissolved ozone concentration in the OSW (in g/L) and is given by equation 2.
The specific ozone dose in the case of OSW system could then be calculated following equation 3.
Analytical methods
The eliminations achieved for the selected six MPs were determined for the OSW line as well as for the reference line with a pump injection system measuring the MP concentrations according to DIN EN ISO 21,676 before and after the ozonation using a 50 × 2.1 mm, 2.7 µm Raptor ARC18 HPLC column (Restek Corporation, Bellefonte, PA, USA) and a QTRAP 6500+ tandem mass spectrometer (Sciex, Framingham, MA, USA).
Basis parameter such as temperature, pH-Value and conductivity were determined following the standards DIN EN ISO 10532, DIN EN ISO 10523, and DIN EN 27888, respectively. Bromide (Br−) and bromate (BrO3−) concentrations were analyzed using LC-ICP-MS (LC: ICS 5000+ IC, Thermo Fischer Scientific, Massachusetts, USA; column: IonPac AG7, 2 × 50 mm; mobile phase 50 mM HNO3; ICP-MS: iCAP Q Serie, Thermo Fischer Scientific, Waltham, MA, USA). Umu and MTT assays were conducted to assess the genotoxicity potential in the inlet and outlet flow of the ozonation step according to ISO 13829 and ISO 10992, respectively.
Contact time determination
A further key point for the future planning of new ozonation plants with an OSW injection system is the required contact time for reaction. Hence, the necessary reaction time for maximum elimination of the six MPs was analyzed by performing ozone depletion experiments on the OSW line directly in the plant. For this purpose, two 20 L samples of the ozonated water were collected directly after the static mixer into two separate bottles. In the first 20 L bottle, a complete ozone reaction was allowed to proceed completely. However, in the second 20 L sample, small volumes were collected at different time intervals: 10, 30, 60, 120, 240 and 480 s after mixing and adding potassium iodide (KI) solutions (CARL ROTH, purity ≥ 99%, CAS: 7681110). After sampling, the MP concentrations were determined in laboratory as explained before. A dilution factor was applied for those sample in which KI solution was added, leading to an upward shift of the lower detection limit (LOD) of the analytic method applied in this study.
The ozone consumption plays a major role in reactor design as well. The overall ozone consumption in the OSW system can be divided into two parts – immediate ozone consumption and residual ozone consumption. While the term ‘Immediate ozone consumption’ referred to the ozone that reacted immediately in the static mixer after the OSW injection, the term ‘Residual ozone consumption’ referred to ozone that reacted with the MPs in a separate reactor basin. Immediate ozone consumption was calculated by measuring the ozone concentration just after the mixing step (A: residual ozone concentration) and subtracting this value from the total ozone addition measured at the OSW line (B: specific ozone dose), both measured using two different ozone sensors (Orbisphere, Hach Lange GmbH, Berlin, Germany; membrane for A: 2956A from 0 ppb to 50 ppm and for B: 29552A from 0 ppb to 200 ppm, transmitter 410C, sensor C1100).
Results and discussion
Data from 13 sampling campaigns were collected during 7 months of operation. Due to the daily and seasonal fluctuations of variables such as the temperature of process water, flow rate and water composition, including DOC and initial MP concentration, the results in this work are presented as percent removal rates. The calculations were made as a ratio between the initial conditions at the inlet of the ozonation plant and the final value after the addition of ozone. This allowed a better comparison of the results over several tests and reduced the influence of parameter fluctuations on the test results. In addition, the DOC used for the calculation of the specific ozone doses is the one determined at the influence of the ozonation plant.
Comparison of obtained MP elimination
A comparison of the MP elimination of the three different ozonation designs – OSW system, standard diffuser, and standard pump injection is shown in . The plots combine the results from the actual study (OSW vs. standard pump injection) and the results from the previous study in 2017 (standard pump injection vs. standard diffuser). The data is presented in the figure with the legends “actual” and “previous study” added for better distinction between these two studies. From the plots, it could be seen that the ability of ozone to oxidize the MPs was clearly different for various MPs investigated in this study. When analyzing the elimination of the selected MPs, it was observed that weakly (1H-benzotriazole and metoprolol), moderately (sulfamethoxazole), and strongly (diclofenac, clarithromycin, and carbamazepine) oxidizable MPs differ in the specific ozone doses required to achieve 80% elimination. As mentioned, clarithromycin was not part of the key MPs list at the time in which the previous study was conducted and, hence, this substance was not measured in the samples taken in 2017.
Figure 3. Elimination achieved at different specific ozone doses for: the OSW injection and the pump-injector system by the actual study (yellow circles and blue triangles, respectively), and diffusers and pump-injector system at the previous study (orange diamonds and unfilled blue triangles, respectively). The eliminations achieved for each micropollutant are presented accordingly: (a) 1H-benzotriazole, (b) metoprolol, (c) sulfamethoxazole, and (d) diclofenac. The mean eliminations for all selected compounds (indicator parameters) were calculated as recommended by the KOM-M.NRW (Citation2016) and are presented separately in: (e) standard injection mechanisms and (f) OSW injection system.
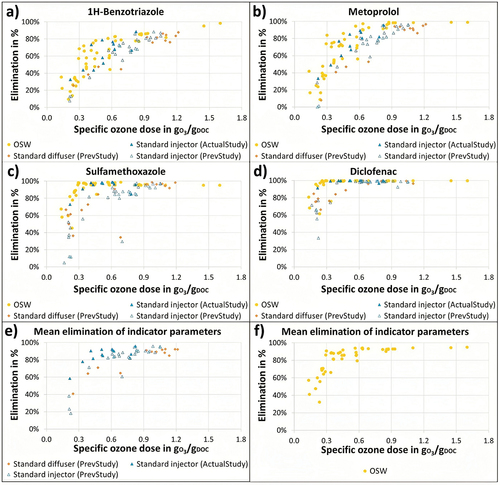
As observed in all the graphs, but particularly for 1H-benzotriazole and metoprolol (), comparable elimination rates were achieved using a wide range of ozone dosages for the OSW system and the standard pump injector system (for both actual and previous studies). The data from the standard diffuser system obtained during the previous study indicated a worse performance. However, this could not be confirmed in the actual investigation due to the modifications implemented at the WWTP Duisburg-Vierlinden in the preceding years.
For the weakly oxidizable substances, improvements between 0.3 and 0.5 gO3/gDOC were observed by the OSW line, where up to 40% difference of the elimination for the same specific ozone doses could be determined. In the case of the moderately oxidizable MP (sulfamethoxazole) (), a lower degree of improvement was observed in the specific ozone-dose requirement for MP elimination with the adoption of OSW technology. No significant change was observed for the other three strongly oxidizable MPs (diclofenac, clarithromycin, and carbamazepine). Hence, only the results for diclofenac are shown for illustrative and comparative purposes ().
In (for 1H-benzotriazole) and (for metoprolol), a significant variation could be observed across different data points for specific ozone doses ranging between 0.3 and 0.6 gO3/gDOC. This range of specific ozone doses in which a high dispersion of the data set was observed can be attributed to various factors, the first being the ozone dosing strategy currently in place in the standard pump injection treatment line. In the standard injection line, the addition of ozone into the process water was controlled proportional to the secondary effluent flow. Since the DOC concentration in the process water fluctuated significantly, a range of specific ozone doses was usually applied to the process water instead of a constant specific ozone dose. This would often lead to variations in the dissolved ozone concentration in the process liquid, typically ranging from 3 to 5 mgO3/L, but with a greater fraction of the overall samples anticipated to align with the ozone-specific doses linked to the “operational” ozone concentration. Considering that the measured DOC in the process water typically varies between 7 and 10 mgDOC/L, the specific ozone dose associated with the above-mentioned operational ozone concentration could be expected to range between 0.3 and 0.7 gO3/gDOC. In order to compare the OSW system with the standard pump injector design, it was necessary to implement similar operational conditions at the OSW treatment line, and a greater number of samples were taken in the range mentioned above. Another factor responsible for the observed fluctuations was the variations in the initial concentrations of the MPs during the study. For 1H-benzotriazol, the initial concentrations ranged from 2200 to 7100 ng/L, while the initial concentration of metoprolol in the process water varied between 350 and 2200 ng/L. These fluctuations in the initial concentration of the MPs significantly influenced the calculation of the achieved elimination and could not be avoided since it is impossible to maintain a stable MP concentration in the process water in a full-scale study like the current work.
The specific ozone dose required to achieve at least 80% removal can be determined by calculating the mean elimination for the six selected indicator parameters (). An analysis of the data from the previous study showed that a specific ozone dose of 0.74 gO3/gDOC (R2 = 0.9) would be required to achieve 80% removal of the MPs for the standard diffuser system. For the injector pump system, the actual study showed an improved elimination compared to the data set from 2017. Performing similar calculations on the data obtained in the current study, the pump injector system showed a specific ozone-dose requirement of 0.39 gO3/gDOC (R2 = 0.7). In the case of the OSW system, it was observed that the same level of elimination could be achieved with 0.3 gO3/gDOC (R2 = 0.8). This signifies approximately a 25% reduction in the ozone demand to achieve an 80% removal of MPs in an OSW design compared to a standard pump injector design. Since the formation of transformation products like bromate depends strongly on the residual ozone concentration, the reduction in ozone demand achieved with an OSW system could be expected to decrease the TPs formation during ozonation. In addition, a reduction in the ozone-dose requirement in an OSW system might also reduce the overall energy consumption in an ozonation plant. Such an economic calculation, however, would also need to consider the increase in the pumping costs associated with the OSW system due to the operation of the dissolution columns at a higher pressure. The energy requirement of the OSW technology will be assessed and discussed in future publications.
Moreover, the suggestion given by KOM-M.NRW (Citation2016) of an average removal of 80% for the six MPs refers to the elimination obtained by combining the conventional and advanced wastewater treatment. Since the previously presented results only consider the ozonation treatment step, a higher elimination than the one obtained could be expected. A further reduction of the required ozone-specific dose is, therefore, possible.
Reaction time and implications on the plant design
The reaction time required for the reaction of ozone with MPs was analyzed for the six selected MPs in the OSW treatment line. The maximum elimination observed for each MP during the reaction-time experiments was selected as the upper limit and, therefore, as the setpoint value. shows a plot of the MP elimination percentage for various reaction times, with the analysis performed for the three main groups of MPs (strongly oxidizable, moderately oxidizable, and weakly oxidizable), as explained in the previous sections.
Figure 4. Required reaction time to achieve maximal elimination using the OSW system for the substances: (a) 1Hbenzotriazole, (b) metoprolol, (c) sulfamethoxazole, and (d) diclofenac as well as for the corresponding (e) mean elimination values for all six MPs (indicator parameters). The elimination achieved at different reaction times are shown for two specific sampling campaigns where the ozone reaction was stopped in samples taken just after the mixing step of the OSW treatment line. The maximal eliminations were determined by allowing the ozone reaction to proceed entirely and are presented as reference lines (1st sampling campaign: blue; 2nd sampling campaign: orange). Samples were quenched with KI at different reaction times (1st sampling campaign: purple; 2nd sampling campaign: gray). The initial concentrations of each compound are given in the title of each graph as high relevant aspect during the calculation of the achieved elimination. The VOD abbreviation corresponds to the catalytic vent ozone destructor installed on each treatment line.
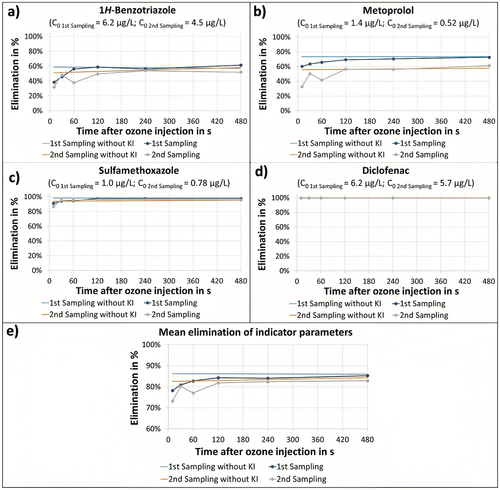
Regarding the immediate ozone consumption and the residual ozone, the obtained values during the first sampling were 0.24 gO3/gDOC and 0.17 gO3/gDOC, respectively, while for the second sampling were 0.15 gO3/gDOC and 0.09 gO3/gDOC. The sum of both values corresponds to the specific ozone dose. These data as well as DOC initial values are summarized for both sampling campaigns in .
Table 1. Basic parameter values and main treatment conditions for both sampling campaigns for the determination of the required reaction time to achieve maximal elimination using the ozone strong water system. The immediate ozone consumption, i.e., directly after injection of the OSW flow into the static mixer, was measured. The residual ozone available for the further reaction step was calculated by the difference between the specific ozone dose and the immediate ozone consumption related to DOC.
From the data presented in , the reaction time to achieve the maximal elimination at the OSW line was determined for all compounds. In the case of 1H-benzotriazole and sulfamethoxazole, such a maximum elimination occurred after 120 s (, respectively). Metoprolol was the most persistent MP, requiring a reaction time between 120 and 480 s (). Clarithromycin, carbamazepine, and diclofenac reached this level directly after adding OSW to the main flow, i.e., in the immediate reaction (). Furthermore, an average 80%-elimination for all six MPs was achieved after 120 s (). Therefore, a significant reduction in terms of reaction time could be achieved through the addition of the OSW system.
From the plots in , it could be observed that the immediate ozone reaction had a predominant influence on the elimination of MPs achieving high eliminations after the addition of OSW, even in the case of weakly oxidizable substances. For instance, diclofenac maximal elimination was achieved directly after the addition of ozone (). A significant reduction in reaction time could thus be achieved by adopting an OSW system for ozonation applications. The role of the residual ozone during the reaction cannot be fully determined from the presented data set, due to the formation of hydroxyl radicals during the immediate ozone reaction. Hydroxyl radical formation as well as the explicit role of residual ozone must be studied in future investigations.
The data presented in was also used to compare the size of the reactor basins required for an OSW system vs. a standard pump injector system. The standard pump injection line was installed and initially designed to provide a total hydraulic retention time of 30 min at an average influent flow of 135 m3/h. The original reactor design did not include MP elimination as design parameter, and hence, an oversizing cannot be neglected. Furthermore, the reactor is used to carry out the three process steps of mass transfer, mixing and reaction, which involved further safe factors. As for the OSW process, only the process step of the reaction must be realized, and the reactor size can be determined only by the reaction kinetics and the average influent flow. The results of the tests indicate that for achieving an 80% MP elimination in average, a hydraulic retention time of 120 s should be sufficient for the reaction. Due to safety considerations, calculations were performed based on the highest reaction time required for a single compound (8 min for metoprolol). Nevertheless, further process parameters could influence the reaction kinetics and, therefore, their analysis would be necessary for proving a safe design. shows a graphical comparison between the current volume for the standard injection line (VA) and the volume calculated for an OSW line (VB), as well as further relevant information concerning the reactor design.
Figure 5. Overview of studied lines and needed dimension for equal MP elimination grades: (a) conventional ozone injection technology line; (b) OSW line. The main process steps are shown as well as their schematic representation (no scaled). The ‘volume A’ refers to the installed reactor volume for the standard ozonation at the WWTP DuisburgVierlinden, while ‘volume B’ refers to the theoretical reactor size needed taking the highest required reaction time until maximal elimination of MP observed during this study as middle retention time (8 min). The size relation follows VB = 0.27 VA. A possible re-use of the oxygen/ozone flow after the mass transfer step was discussed and therefore, presented in figure B.
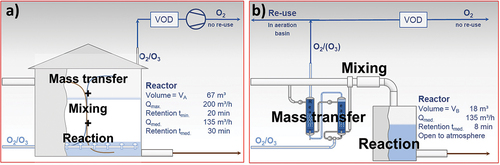
The required reactor volume in the OSW system would correspond to 27% of the volume for the standard injection line (18 m3 against 67 m3). This reduction would allow the installation of this technology in treatment plants with very little available space, constituting an important advantage of the OSW technology over standard injection systems. Even an open-to-atmosphere reaction basin could be a feasible option in the case of the OSW system, as no ozone gas bubbling is performed inside the reactor basin, thus eliminating the risk of any undissolved ozone gas leaving the reaction step.
Further remarks
During this study, a detailed mechanistic analysis of various reactive species involved in ozone-based oxidation (such as ozone and hydroxyl radicals) could not be performed, primarily due to local regulations on wastewater discharges from the WWTP. For instance, the influences of the ozone molecule and hydroxyl radicals on the MP elimination require experiments using a hydroxyl scavenger, for example. Since these substances and their transformation products would pose a toxicological risk in the receiving aquatic ecosystems, their addition in full-scale experiments cannot be conducted given the local regulations. In general, the kind of experiments needed is being conducted at the laboratory scale. This is still not enough in the present case, since laboratory experiments have not been structured to simulate the OSW technology. Therefore, experiments at an OSW pilot plant are highly recommended as a possible alternative.
As a secondary aspect, genotoxicity tests and the determination of the bromate formation potential were conducted during the time frame of this study for the influent and effluent of both treatment lines. The genotoxicity test showed no change after ozonation, as no potential genotoxicity was observed neither after the secondary clarifier nor after ozonation independently of the injection system. In addition, no significant bromate formation was observed neither for the standard injection nor for the OSW treatment lines. For both cases, low concentrations of up to 6 µg/L bromate were determined (for comparison, drinking water limit is set at 10 µg/L). However, the WWTP Duisburg-Vierlinden receives wastewater with relatively low bromide concentrations (up to 80 µg/L); hence, the bromate formation potential was not a relevant issue throughout the study duration. For the evaluation of the OSW technology as a possible mitigation technique for bromate formation, further experiments are required either at a fullscale application in a WWTP with higher bromide concentrations or at a pilot plant with bromide spiking. Additional observations on the influence of the immediate ozone reaction on bromate formation will be discussed in future work.
Conclusions
The full-scale pilot study at the WWTP Duisburg-Vierlinden, Germany, demonstrated the feasibility of adopting the OSW technology as an alternative to standard ozonation approaches for removing the MPs. Based on the experimental campaigns, the following key findings and future implications were identified:
Experiments using the OSW system have shown that, compared to standard ozonation, the ozone requirement can be reduced while MP elimination remains the same. Between specific ozone doses of 0.3 and 0.5 gO3/gDOC, improvements regarding the MP elimination were observed for weakly and moderate oxidizable compounds. To achieve an average elimination of more than 80% of the investigated compounds, the ozone requirement for the OSW system was about 25% lower than for standard ozonation.
The OSW system enabled similar MP elimination levels as standard ozonation with significantly reduced contact times. In the present study, the results indicated that the design volume of the reactor could be reduced to a size of around one-third of the volume of the existing ozonation plant. Therefore, the presented results could offer a solution for WWTPs that lack sufficient space for the installation of a standard injection system. The consideration of additional benefits, such as the absence of off-gas and the homogeneous flow of the highly dissolved ozone dissolution, would lead to a further simplification of the overall design.
High MP eliminations were observed directly after the addition of the OSW flow. Hence, the immediate ozone reaction seemed to play a predominant role in the elimination of MPs. However, the role of the residual ozone that continues to react as well as the role of the hydroxyl radicals is still unknown. This remains important for a better understanding of the process and will be assessed in a following study.
During this study, no relevant genotoxicity or bromate formation potential was observed. However, since the OSW technology could not be tested under conditions with elevated bromide concentrations and, consequently, with high bromate formation potential, additional experiments are necessary to fully characterize this system as a potential mitigation technique.
The real-time observation of the immediate ozone consumption in the static mixer, which is directly linked to the actual organic matrix of the wastewater and the immediate reduction of the MPs, demonstrates the potential for further optimization of the system through modifications in ozone dosing design and online control.
An optimal ozone concentration was not fully determined in this study and is therefore an important point for further investigations. Furthermore, possible combinations of the OSW injection technology and other mitigation measures, such as multiple dosing of ozone, could provide a solution for those wastewater treatment plants with elevated bromate formation potential.
Acknowledgments
We would like to acknowledge the Wirtschaftsbetriebe Duisburg (WBD) and their personnel for the technical support and helping hands during the study. K. F. Guerrero-Granados is grateful to the German Federal Environmental Foundation (DBU - Deutsche Bundestiftung Umwelt) for the PhD scholarship (Az 20022/008).
Disclosure statement
No potential conflict of interest was reported by the author(s).
Additional information
Funding
References
- Ameta, R., K. Chohadia, A. Jain, and P. B. Punjabi. 2018. “Fenton and Photo-Fenton Processes.” In Advanced Oxidation Processes for Waste Water Treatment, edited by S. C. Ameta, and R. Ameta, 49–87. London: Elsevier.
- Anjali, R., and S. Shanthakumar. 2019. “Insights on the Current Status of Occurrence and Removal of Antibiotics in Wastewater by Advanced Oxidation Processes.” Journal of Environmental Management 246:51–62. https://doi.org/10.1016/j.jenvman.2019.05.090.
- Arzate, S., S. Pfister, C. Oberschelp, and J. A. Sánchez-Pérez. 2019. “Environmental Impacts of an Advanced Oxidation Process as Tertiary Treatment in a Wastewater Treatment Plant.” Science of the Total Environment 694:133572. https://doi.org/10.1016/j.scitotenv.2019.07.378.
- Babcock, N., N. La Breche, K. Robinson, and A. N. Pisarenko. 2022. “Empirical Modeling of Bromate Formation and Chemical Control Strategies at Multiple Water Reuse Facilities Using Ozone.” Ozone: Science & Engineering 45 (5): 446–54. https://doi.org/10.1080/01919512.2022.2161469.
- Bilal, M., K. Rizwan, M. Adeel, D. Barceló, Y. A. Awad, and H. M. N. Iqbal. 2022. “Robust Strategies to Eliminate Endocrine Disruptive Estrogens in Water Resources.” Environmental Pollution 306:119373. https://doi.org/10.1016/j.envpol.2022.119373.
- Böhler, M. 2017. Biologische Nachbehandlung von kommunalem Abwasser nach Ozonung – ReTREAT, Abschlussbericht für das Bundesamt für Umwelt (Bafu) im Rahmen eines Projektes der Technologieförderung. Dübendorf: Eawag.
- Choi, S., H. Yoom, H. Son, C. Seo, K. Kim, Y. Lee, and Y. M. Kim. 2022. “Removal Efficiency of Organic Micropollutants in Successive Wastewater Treatment Steps in a Full-Scale Wastewater Treatment Plant: Bench-Scale Application of Tertiary Treatment Processes to Improve Removal of Organic Micropollutants Persisting After Secondary Treatment.” Chemosphere 288 (Pt 3): 132629. https://doi.org/10.1016/j.chemosphere.2021.132629.
- Cunha, D. L., A. S. A. Da Silva, R. Coutinho, and M. Marques. 2022. “Optimization of Ozonation Process to Remove Psychoactive Drugs from Two Municipal Wastewater Treatment Plants.” Water, Air, and Soil Pollution 233 (2). https://doi.org/10.1007/s11270-022-05541-9.
- Da Silva, L. M., and W. F. Jardim. 2006. “Trends and Strategies of Ozone Application in Environmental Problems.” Quimica Nova 29 (2): 310–17. https://doi.org/10.1590/S0100-40422006000200023.
- Dogruel, S., A. Z. Cetinkaya, E. Aydin, and E. Pehlivanoglu-Mantas. 2020. “Ozonation in Advanced Treatment of Secondary Municipal Wastewater Effluents for the Removal of Micropollutants.” Environmental Science and Pollution Research International 27 (36): 45460–75. https://doi.org/10.1007/s11356-020-10339-5.
- Domingues, E., E. Fernandes, J. Gomes, and R. C. Martins. 2021. “Advanced Oxidation Processes Perspective Regarding Swine Wastewater Treatment.” Science of the Total Environment 776:145958. https://doi.org/10.1016/j.scitotenv.2021.145958.
- Dopp, E., H. Pannekens, A. Gottschlich, G. Schertzinger, L. Gehrmann, M. Kasper-Sonnenberg, J. Richard, et al. 2021. “Effect-Based Evaluation of Ozone Treatment for Removal of Micropollutants and their Transformation Products in Waste Water.” Journal of Toxicology and Environmental Health Part A 84 (10): 418–39. https://doi.org/10.1080/15287394.2021.1881854.
- EU. 2020/2184. Directive (EU) 2020/2184 of the European Parliament and of the Council of 16 December 2020 on the Quality of Water Intended for Human Consumption (Recast). Brussels: European Parliament, Council of the European Union.
- Fischbacher, A., K. Löppenberg, C. Von Sonntag, and T. C. Schmidt. 2015. “A New Reaction Pathway for Bromite to Bromate in the Ozonation of Bromide.” Environmental Science & Technology 49 (19): 11714–20. https://doi.org/10.1021/acs.est.5b02634.
- Guo, Y., J. Zhan, G. Yu, and Y. Wang. 2021. “Evaluation of the Concentration and Contribution of Superoxide Radical for Micropollutant Abatement During Ozonation.” Water Research 194:116927. https://doi.org/10.1016/j.watres.2021.116927.
- Harth, F. U. R., C. Arras, D. J. Brettschneider, A. Misovic, J. Oehlmann, U. Schulte-Oehlmann, and M. Oetken. 2018. “Small but with Big Impact? Ecotoxicological Effects of a Municipal Wastewater Effluent on a Small Creek.” Journal of Environmental Science and Health, Part A 53 (13): 1149–60. https://doi.org/10.1080/10934529.2018.1530328.
- Jahan, B. N., L. Li, and K. R. Pagilla. 2021. “Fate and Reduction of Bromate Formed in Advanced Water Treatment Ozonation Systems: A Critical Review.” Chemosphere 266:128964. https://doi.org/10.1016/j.chemosphere.2020.128964.
- KOM-M.NRW. 2016. Anleitung zur Planung und Dimensionierung von Anlagen zur Mikroschadstoffelimination. Cologne, NRW: Germany ARGE Kompetenzzentrum Mikroschadstoffe.
- KOMS. 2020. Kläranlagenausbau in Baden-Württemberg – Aktueller Stand. Stuttgart: Kompetenzzentrum Spurenstoffe Baden-Württemberg.
- Kosek, K., A. Luczkiewicz, S. Fudala-Książek, K. Jankowska, M. Szopińska, O. Svahn, J. Tränckner, A. Kaiser, V. Langas, and E. Björklund. 2020. “Implementation of Advanced Micropollutants Removal Technologies in Wastewater Treatment Plants (WWTPs) - Examples and Challenges Based on Selected EU Countries.” Environmental Science & Policy 112:213–26. https://doi.org/10.1016/j.envsci.2020.06.011.
- Krishnan, R. Y., S. Manikandan, R. Subbaiya, M. Biruntha, M. Govarthanan, and N. Karmegam. 2021. “Removal of Emerging Micropollutants Originating from Pharmaceuticals and Personal Care Products (PPCPs) in Water and Wastewater by Advanced Oxidation Processes: A Review.” Environmental Technology & Innovation 23:101757. https://doi.org/10.1016/j.eti.2021.101757.
- Lei, Y., T. Wagner, H. Rijnaarts, V. Wilde, and A. Langenhoff. 2023. “The Removal of Micropollutants from Treated Effluent by Batch-Operated Pilot-Scale Constructed Wetlands.” Water Research 230:119494. https://doi.org/10.1016/j.watres.2022.119494.
- Leusch, F. D., P. A. Neale, C. Arnal, N. H. Aneck-Hahn, P. Balaguer, A. Bruchet, B. I. Escher, et al. 2018. “Analysis of Endocrine Activity in Drinking Water, Surface Water and Treated Wastewater from Six Countries.” Water Research 139:10–18. https://doi.org/10.1016/j.watres.2018.03.056.
- Li, Y., S. Zhang, W. Zhang, W. Xiong, Q. Ye, X. Hou, C. Wang, and P. Wang. 2019. “Life Cycle Assessment of Advanced Wastewater Treatment Processes: Involving 126 Pharmaceuticals and Personal Care Products in Life Cycle Inventory.” Journal of Environmental Management 238:442–50. https://doi.org/10.1016/j.jenvman.2019.01.118.
- Luo, Y., W. Guo, H. H. Ngo, L. D. Nghiem, F. I. Hai, J. Zhang, and S. Liang. 2014. “A Review on the Occurrence of Micropollutants in the Aquatic Environment and Their Fate and Removal During Wastewater Treatment.” Science of the Total Environment 473-474:619–41. https://doi.org/10.1016/j.scitotenv.2013.12.065.
- Mecha, A. C., and M. N. Chollom. 2020. “Photocatalytic Ozonation of Wastewater: A Review.” Environmental Chemistry Letters 18 (5): 1491–507. https://doi.org/10.1007/s10311-020-01020-x.
- Mierzwa, J. C., R. Rodrigues, and A. C. S. C. Teixeira. 2018. “UV-Hydrogen Peroxide Processes.” In Advanced Oxidation Processes for Waste Water Treatment, edited by S. C. Ameta, and R. Ameta, 13–48. London: Elsevier.
- Morrison, C. M., S. Hogard, R. Pearce, A. Mohan, A. N. Pisarenko, and E. R. V. Dickenson. 2023. “Critical Review on Bromate Formation during Ozonation and Control Options for its Minimization.” Environmental Science & Technology 57 (47): 18393–409. https://doi.org/10.1021/acs.est.3c00538.
- Patel, S., R. Agarwal, S. K. Majumder, P. Das, and P. Ghosh. 2020. “Kinetics of Ozonation and Mass Transfer of Pharmaceuticals Degraded by Ozone Fine Bubbles in a Plant Prototype.” Heat and Mass Transfer 56 (2): 385–97. https://doi.org/10.1007/s00231-019-02718-7.
- Pei, M., B. Zhang, Y. He, J. Su, K. Gin, O. Lev, G. Shen, and S. Hu. 2019. “State of the Art of Tertiary Treatment Technologies for Controlling Antibiotic Resistance in Wastewater Treatment Plants.” Environment International 131:105026. https://doi.org/10.1016/j.envint.2019.105026.
- Petrie, B., R. Barden, and B. Kasprzyk-Hordern. 2015. “A Review on Emerging Contaminants in Wastewaters and the Environment: Current Knowledge, Understudied Areas and Recommendations for Future Monitoring.” Water Research 72:3–27. https://doi.org/10.1016/j.watres.2014.08.053.
- Pistocchi, A., N. A. Alygizakis, W. Brack, A. Boxall, I. T. Cousins, J. E. Drewes, and S. Finckh. 2022. “European Scale Assessment of the Potential of Ozonation and Activated Carbon Treatment to Reduce Micropollutant Emissions with Wastewater.” Science of the Total Environment 848:157124. https://doi.org/10.1016/j.scitotenv.2022.157124.
- Saravanan, A., V. C. Deivayanai, P. S. Kumar, G. Rangasamy, R. V. Hemavathy, T. Harshana, and N. Gayathri. 2022. “A Detailed Review on Advanced Oxidation Process in Treatment of Wastewater: Mechanism, Challenges and Future Outlook.” Chemosphere 308 (Pt 3): 136524. https://doi.org/10.1016/j.chemosphere.2022.136524.
- Schindler, Y., H. Mestankova, M. Schrärer, K. Schirmer, E. Salhi, and U. Von Gunten. 2015. “Novel Test Procedure to Evaluate the Treatability of Wastewater with Ozone.” Water Research 75:324–35. https://doi.org/10.1016/j.watres.2015.02.030.
- Schwarzenbach, R. P., B. I. Escher, K. Fenner, T. B. Hofstetter, C. A. Johnson, U. Von Gunten, and B. Wehrli. 2006. “The Challenge of Micropollutants in Aquatic Systems.” Science 313 (5790): 1072–77. https://doi.org/10.1126/science.1127291.
- Tuerk, J., A. Boergers, J. Leonhardt, C. Portner, L. Gehrmann, and T. Teutenberg. 2017. “Target Analysis, Suspected-Target, and Non-Target Screening for Evaluation and Comparison of Full-Scale Ozonation at Three Wastewater Treatment Plants.” In Assessing Transformation Products of Chemicals by Non-Target and Suspect Screening – Strategies and Workflows Volume 2, edited by J.E. Drewes and T. Letzel, 29–47. Vol. 1242 of ACS Symposium Series.Washington D.C., USA: Oxford University Press. https://doi.org/10.1021/bk-2016-1242.ch002.
- UVEK. 2016. “Verordnung des UVEK zur Überprüfung des Reinigungseffekts von Maßnahmen zur Elimination von organischen Spurenstoffen bei Abwasserreinigungsanlagen.” Accessed January 28, 2024. https://fedlex.data.admin.ch/filestore/fedlex.data.admin.ch/eli/cc/2016/671/20161201/de/pdf-a/fedlex-data-admin-ch-eli-cc-2016-671-20161201-de-pdf-a-1.pdf.
- Von Gunten, U. 2003. “Ozonation of Drinking Water: Part II. Disinfection and By-Product Formation in Presence of Bromide, Iodide or Chlorine.” Water Research 37 (7): 1469–87. https://doi.org/10.1016/S0043-1354(02)00458-X.
- Von Sonntag, C., and U. Von Gunten. 2012. Chemistry of Ozone in Water and Wastewater Treatment - from Basic Principles to Applications. London: IWA Publishing.
- Wei, C., F. Zhang, Y. Hu, C. Feng, and H. Wu. 2016. “Ozonation in Water Treatment: The Generation, Basic Properties of Ozone and its Practical Application.” Reviews in Chemical Engineering 33 (1): 49–89. https://doi.org/10.1515/revce-2016-0008.