
 ?Mathematical formulae have been encoded as MathML and are displayed in this HTML version using MathJax in order to improve their display. Uncheck the box to turn MathJax off. This feature requires Javascript. Click on a formula to zoom.
Abstract
Objectives
To investigate image-guided volumetric hyperthermia strategies using the ExAblate Body MR-guided focused ultrasound ablation system, involving mechanical transducer movement and sector-vortex beamforming.
Materials and methods
Acoustic and thermal simulations were performed to investigate volumetric hyperthermia using mechanical transducer movement combined with sector-vortex beamforming, specifically for the ExAblate Body transducer. The system control in the ExAblate Body system was modified to achieve fast transducer movement and MR thermometry-based hyperthermia control, mechanical transducer movements and electronic sector-vortex beamforming were combined to optimize hyperthermia delivery. The experimental validation was performed using a tissue-mimicking phantom.
Results
The developed simulation framework allowed for a parametric study with varying numbers of heating spots, sonication durations, and transducer movement times to evaluate the hyperthermia characteristics for mechanical transducer movement and sector-vortex beamforming. Hyperthermic patterns involving 2-4 sequential focal spots were analyzed. To demonstrate the feasibility of volumetric hyperthermia in the system, a tissue-mimicking phantom was sonicated with two distinct spots through mechanical transducer movement and sector-vortex beamforming. During hyperthermia, the average values of Tmax, T10, Tavg, T90, and Tmin over 200 s were measured within a circular ROI with a diameter of 10 pixels. These values were found to be 8.6, 7.9, 6.6, 5.2, and 4.5 °C, respectively, compared to the baseline temperature.
Conclusions
This study demonstrated the volumetric hyperthermia capabilities of the ExAblate Body system. The simulation framework developed in this study allowed for the evaluation of hyperthermia characteristics that could be implemented with the ExAblate MRgFUS system.
1. Introduction
Magnetic resonance imaging (MRI)-guided focused ultrasound is a promising technology for noninvasive, precise, and efficient heat delivery to targeted areas of the body, using high-frequency acoustic waves (e.g., 220 kHz-3 MHz) under MRI guidance that enables treatment planning, temperature monitoring, and safety assurance. High-intensity focused ultrasound (HIFU) has been used for thermal ablation treatment targeting various sites, including the brain, uterine fibroids, prostate, pancreas, and bone metastases [Citation1]. Furthermore, MR-guided focused ultrasound offers a wide range of applications in the treatment of neurological disorders, using HIFU and low-intensity focused ultrasound (LIFU).
This innovative technology has the potential to be applied to hyperthermia treatments, which are known to induce various therapeutic effects on tumors through a temperature rise within the range of 39-43 °C maintained for a duration of 30-60 min. Within these specific temperature ranges and exposure times, hyperthermia inhibits of DNA repair mechanisms in tumors, consequently enhancing radiosensitization [Citation2,Citation3]. Moreover, hyperthermia also induces an increase in blood flow, reoxygenation, and immune activation, which play important complementary roles to radiotherapy and chemotherapy. Furthermore, hyperthermia enables the targeted delivery of therapeutic drugs using thermosensitive liposomes [Citation4–6]. Hyperthermic temperature triggers liposomes to release drugs, increasing treatment efficacy while reducing potential side effects.
Clinically available MR-guided focused ultrasound systems are initially designed for thermal ablation treatments, aiming to create focal spots of a few millimeters in length and diameter for a short duration. However, further advancements are required to extend their applicability to hyperthermia treatments necessitating prolonged, stable heating over large volumes for an extended period. It is particularly important to emphasize the capability of large volume hyperthermia as a means to enhance the versatility and applicability of MR-guided focused ultrasound in a wide range of cancer treatments. For this reason, various methods have been explored for hyperthermia treatment using clinical MR-guided focused ultrasound systems.
Currently, the clinically available MR-guided focused ultrasound systems in the United States are the ExAblate (Insightec, Haifa, Israel) and the Sonalleve (Profound Medical, Inc., Canada) [Citation7,Citation8]. The different transducer types employed in the two systems require different approaches when developing hyperthermia strategies. The Sonalleve transducer’s geometry and arrangement facilitate electronic beam steering along with off-axis capabilities [Citation9]. Partanen et al. investigated a hyperthermia heating algorithm using electronic beam steering with the Sonalleve system [Citation10]. They employed concentric sonication trajectories and optimized the sonication orders to achieve a uniform distribution of hyperthermia. Staruch et al. employed the Sonalleve system to apply mild hyperthermia and deliver a thermosensitive liposome drug to a rabbit Vx2 tumor model [Citation11]. Their approach involved electronic beam steering with a circular trajectory of 4-16 mm in diameter. Recently, Tillander et al. proposed an approach for large volume hyperthermia using electronic beam steering and mechanical transducer movement [Citation12]. This approach allows for generating localized heating by electronic beam steering and subsequently moving the transducer to extend heating across a broader circular trajectory (18-58 mm diameter). Similarly, Zhu et al. characterized temperature fields of volumetric hyperthermia with the Sonalleve system. Volumetric hyperthermia was successfully performed in a focal depth range of 17–65 mm within an in-vivo porcine thigh muscle [Citation13]. For hyperthermia heating, real-time temperature based feedback control has been shown to dramatically improve target temperatures and uniformity of hyperthermia delivery with the Sonalleve system [Citation14,Citation15].
The latest generation of image-guided hyperthermia devices should integrate both mechanical scanning of the transducer and electronic steering to achieve volumetric hyperthermia [Citation3]. Earlier studies have explored methods for achieving volumetric hyperthermia using custom-made ultrasound devices with mechanical scanning [Citation16,Citation17]. However, further investigation of the ExAblate Body system is limited by safety constraints that require slower transducer movement to reposition the focal spot. Furthermore, except for one study on hyperthermia-mediated drug delivery [Citation18], there are few studies on the utilization of this system for volumetric hyperthermia delivery because the array configuration limits off-axis focusing and volume heating. Our previous study proposed sonication strategies for large volume heating using the ExAblate Body system [Citation19]. Sector-vortex beamforming, involving phase rotation along the sectors, was utilized to generate multiple foci in an annular ring around the transducer axis. This approach resulted in a large volumetric heating at a single spot position before moving the transducer.
The objective of this study was to develop a volumetric hyperthermia delivery strategy with the ExAblate Body array by integrating mechanical transducer movement with sector-vortex beamforming. Because of the constraints in the ExAblate Body system, sonication cannot be performed while the transducer is in motion, necessitating the repetition of sonication and transducer movement in an interleaved manner. An iterative process strategy was proposed for sequentially heating multiple spots within the targeted volume.
Acoustic and biothermal simulations were performed to evaluate the hyperthermia delivery characteristics of the ExAblate Body array achieved through mechanical scanning and sector-vortex beamforming. Temperature distributions were analyzed with varying parameters such as the distance between heating spots, sonication duration, and transducer movement time. Experiments were performed using a tissue-mimicking phantom for further validation. In the experiments, the ExAblate Body system was modified, specifically enabling faster transducer movement and sector-vortex beamforming. Additionally, a simplified temperature-feedback controller based on MR thermometry was integrated with the ExAblate system to maintain the desired hyperthermic temperature range. Hyperthermic patterns, including volume and dimensions, were evaluated and compared through simulations and phantom experiments.
2. Materials and methods
2.1. ExAblate Body MR-guided focused ultrasound (MRgFUS) system
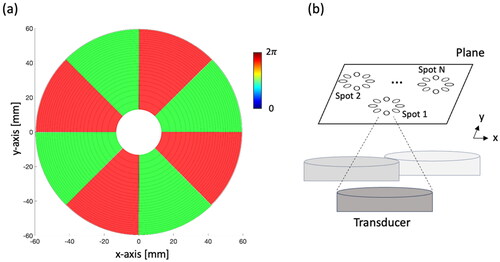
The ExAblate Body MRgFUS system consists of a concentric-ring sector-vortex phased array and is integrated within a 3 T MRI scanner (GE Healthcare, MR750W, Waukesha, WI). The transducer array has a spherically curved configuration (12 cm diameter, f-number = 1.3), divided into 8 sectors and 26 concentric rings (), amounting to a total of 208 independently phased elements. Each element has an allocated surface area of 54 mm2, with adjustable power control capability. Operating within a frequency range of 1 to 1.2 MHz, the transducer typically functions at 1 MHz [Citation19].
Figure 1. (a) Top view of the ExAblate body transducer and phase distribution of the transducer for the sector-vortex mode 4 at the geometrical focal depth. (b) The concept of mechanical transducer scanning used in this study.
2.2. Simulation framework
2.2.1. Beam forming phase patterns
The sectored-annular ring array configuration enables sector-vortex beamforming through phase rotation, generating an acoustic intensity along the transducer axis. Varying phase offsets for each transducer sector results in phase values to rotate along the circumference of the array. These rotational phase values can be calculated using the approach described by Fjield et al. [Citation20]:
(1)
(1)
where n and s indicate the nth ring and the sth sector, respectively.
is he phase value of the nth ring in the first sector, and
represents the phase value of the nth ring in the sth sector. The number of rotations is denoted as the vortex mode number (m) and should be less than N/2 where N is the number of sectors. Using Equation 1, the annular focal distribution,
results in the formation of an annular-shaped energy ring in the cross-sectional plane and a focal spot with a larger diameter [Citation21,Citation22]. The ExAblate Body transducer comprises eight sectors, capable of operating within 0-4 modes. This allows the generation of wider annular-spaced multifocal patterns on the cross-sectional plane. Consequently, this setup leads to broader temperature distributions and facilitates larger volume heating [Citation19].
2.2.2. Acoustic and thermal simulation for volumetric hyperthermia with mechanical scanning
In this study, we developed a simulation framework to explore sonication strategies using mechanical scanning and electronic beam forming in the sector vortex mode, specifically for the ExAblate Body transducer. In our earlier research [Citation19], the phase values derived from Equation 1 were used to calculate the overall pressure in the reference plane. These values were then applied to the hybrid angular spectrum (HAS) [Citation23] method to estimate 3D acoustic energy propagation within an inhomogeneous tissue medium. To simulate mechanical scanning, 3D acoustic power depositions were calculated at each individual sonication spot. The simulation framework was further expanded to include transient thermal analysis, enabling the simulation of sequential heating of the spots using mechanical scanning and sector-vortex beamforming.
To calculate the transient temperature distribution in the computational domain, acoustic energy propagation was coupled with the Pennes bioheat transfer equation [Citation24] as follows:
(2)
(2)
where
is the tissue density [kg/m3],
is the specific heat capacity [J/
/kg],
is the thermal conductivity [W/m/
],
and
represent the tissue and blood temperatures [
],
is the blood perfusion [kg/m3/s], and
is the specific heat of blood [J/
/kg].
is the volumetric power deposition due to the absorption of the acoustic energy in the tissue [W/m3], defined as:
(3)
(3)
where c is the speed of sound [m/s],
is the acoustic absorption coefficient [m−1], and p [Pa] is the complex pressure profile.
The initial temperature of the tissue domain was set to 18 °C, and a constant heat flux boundary condition was considered at the outer boundaries of the computational domain. The governing equation for transient thermal dynamics, along with the specified boundary condition, was solved within a 3D Cartesian coordinate system using the explicit finite difference method [Citation25,Citation26]. In a previous study, the grid size with a quarter wavelength provided sufficient accuracy and solution stability [Citation27]. In this study, a simple grid independence test was performed with grid sizes of = 1.5 mm,
/2 = 0.75 mm,
/4 = 0.375 mm, and
/6 = 0.25 mm (Supplemental Figure S1). Since there was no significant difference in acoustic intensity distributions between cases of
/4 and
/6, the spatial grid size was chosen for both the acoustic and thermal simulations as uniform in the x-, y-, and z-directions:
/4 = Δx = Δy = Δz = 0.375 mm. For the calculation of the transient temperature distribution, a time step of Δt = 0.1 s was adopted. At each time step, the maximum temperature in a region of interest (ROI) was identified. A binary feedback control was implemented at a critical temperature elevation threshold of 8 °C starting from an initial temperature of 18 °C, such that, once the target temperature was reached or exceeded, the power output was set to zero. If the temperature cooled down, the power was set back to the initial level.
2.2.3. Simulation protocol & analysis
To evaluate hyperthermia delivery characteristics, acoustic and thermal simulations, including mechanical scanning and sector-vortex beam forming, were implemented in MATLAB (Matlab_R2023a, MathWorks, Natick, MA) and performed on a MacBook Pro computer (M2 Max CPU, 32 GB memory, Apple, Cupertino, CA). Hyperthermic patterns involving 2–4 sequential focal spots were generated and analyzed. The resulting temperature distributions were investigated by systematically varying parameters such as sonication duration, transducer movement time, number of focal spots, and location and distance between spots.
T1-weighted MRI images of a tissue-mimicking phantom (InSightec, Haifa, Israel) were acquired. Based on these images, a 3D model was created using 3D Slicer software [Citation28]. shows the acoustic and thermal properties of the tissue-mimicking phantom used for the simulation studies. As shown in , an acoustic power of 24 W was applied to each spot (Ns) for the sonication duration (Ts). The vortex mode 4 (8 focal spots in an annular ring) was applied to generate a sonication cell larger than the mode 0 (single focal spot) centered at each spot. No sonication was employed during the period of transducer movement (Mtrans). This simulation approach emulated the impact of the thermal loss resulting from the inevitable interruption of sonication during transducer repositioning.
Figure 2. Illustration of the sequential sonication process for multiple heating spots. A series of MR images (Nimg) is acquired during sonication, with the number of Nimg contingent on the sonication duration (Ts). Notably, a time delay arises between the sonication of each spot due to the transducer movement time (Tmov).
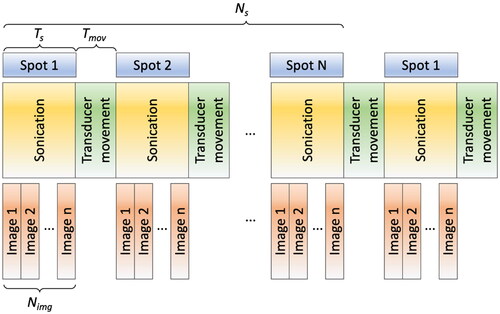
Table 1. The acoustic and thermal properties of the tissue-mimicking phantom were used for the simulation [Citation19, Citation29] to simulate the perfused tissue, a perfusion rate of 3 kg/m3/s was used throughout the simulation.
Table 2. Hyperthermia control and analysis parameters.
To evaluate the effective temperature area for hyperthermia, metrics such as T10, T50, and T90 were used. The T10, T50, and T90 represent the temperature measurements reached or exceeded by 10%, 50%, and 90% of all voxels within an ROI over the duration of hyperthermia exposure, respectively. Additionally, T10 volume and T50 volume represent the volumes comprising voxels with temperature exceeding the T10 and T50 values, respectively. The accumulation of the thermal dose was calculated based on time-temperature exposures, measured in equivalent minutes at a reference temperature elevation of 6 °C for the phantom. The reference temperature elevation of 6 °C for the phantom corresponds to cumulative equivalent minutes (CEM) at 43 °C, which is a widely adopted standard to estimate thermal tissue effects in clinical practice [Citation30,Citation31]. Similarly, CEMT90 denotes cumulative equivalent minutes at the T90 value. In the simulation, an ROI measuring 20 × 20 × 20 mm3 at the target center was used for the temperature feedback control and temperature analysis, including parameters such as Tmax, Tmin, T10, T50, and T90. This ROI size was set as the target area in the simulation.
2.3. System modification for mechanical transducer control and hyperthermia
The ExAblate phased array transducer was initially designed for thermal ablation, and as such does not allow for rapid transducer movement or short intervals between sonications. However, to explore hyperthermia strategies involving mechanical scanning and custom beamforming, it is necessary to modify the system control and operate within the design configurations and limits. The existing system framework involves the following steps: 1) transducer movement, 2) preparation time for position evaluation, and 3) sonication initiation. To enable faster transducer scanning on a plane, we modified the configuration files within the hardware control system. As a result of these adjustments, the time interval between the completion of one sonication shot and the commencement of the next shot was effectively reduced to 6–7 s, down from the original range of approximately 11–15s. To provide further detail, while the physical movement of the transducer itself took less than 3 s, additional time was necessitated for system preparatory procedures to ensure safety protocols were upheld. Therefore, the total duration for transducer movement was determined predominantly by the system preparation time rather than the physical distance between spots. In this study, the mechanical transducer movement time between the positions and sonication was set to 12 s, which was the minimum time from the end of sonication to the start of the next sonication, including transducer movement. We measured this time using the ExAblate Body system modified in this study.
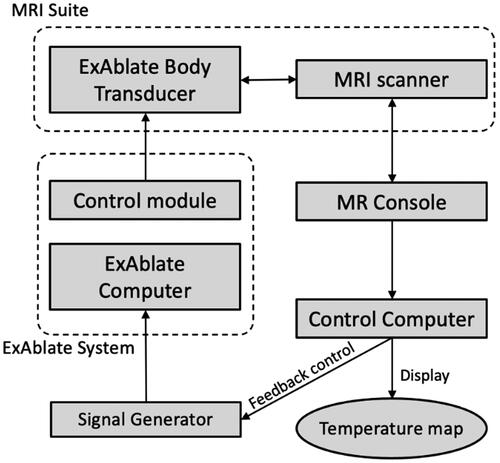
MR thermometry-guided hyperthermia control was integrated with the ExAblate Body array to achieve uniform prolonged stable heating. The ExAblate Body system provides a pulsed sonication mode, whereas a nominal or maximum power level can be set and then adjusted in real-time by modulating a TTL level duty cycle control signal during sonication, enabling hyperthermia control. As shown in , MR temperature images are reconstructed in the user computer, and the control software changes the duty cycle of the trigger signal. This real-time adjustment allows the ExAblate Body array to alter its power output dynamically. The temperature was adjusted following each MR temperature image. In this study, a pulse frequency of 10 kHz was used, and the duty cycle was adjusted according to the current temperature (T) within an ROI (Section 2.5). During the initial heat-up (T < Ttarget-0.5 °C), the maximum power (Pmax) was selected. When the temperature was around the target temperature (Ttarget-0.5 °C < T < Ttarget), a proportional feedback control was employed (P = Pmax (Ttarget - T)/0.5°). Once the target temperature was reached or exceeded (T ≥ Ttarget), the power output was set to zero (p = 0) [Citation32]. In other words, after each MR thermometry image acquisition, the temperature within an ROI was calculated, and the control software adapted the duty cycle of the rectangular pulse signal according to the measured temperature. This allowed for continuous regulation of power output during sonication periods.
Figure 3. Block diagram of temperature feedback control for hyperthermia within the ExAblate Body system. MR temperature images are acquired and visualized on the control computer and used to monitor the temperature throughout the target and within an ROI, which is applied for temperature feedback-based power control through pulse width modulation, thereby facilitating hyperthermia control during MRI scanning.
2.4. Real-time MR thermometry-based closed-loop feedback hyperthermia control
Proton resonance frequency shift (PRFS)-based MR thermometry [Citation33,Citation34] was employed to achieve temperature feedback control by monitoring the temperature changes. Image acquisition was performed using a spoiled gradient-echo sequence with a body coil, and the obtained images were then transferred to an external computer via a TCP/IP connection. The images were processed using MATLAB to reconstruct and visualize the corresponding temperature maps. In the PRFS calculation, different transducer positions resulted in varied magnetic susceptibility changes, causing significant temperature errors. To mitigate these temperature errors, multiple reference images were acquired for each position of the transducer before the initiation of heating [Citation12]. Furthermore, to address potential global temperature bias or shifts caused by magnetic field drifts, correction was applied using the subtraction in the PRFS calculation of the average temperature within an ROI outside the focal spot, assuming a homogeneous distribution of time-varying B0 field drift.
2.5. Experimental validation & performance assessment
To validate the system modifications for mechanical and electrical scanning, along with the temperature feedback control, a phantom experiment was performed with 2 distinct focal regions positioned 12 mm apart at the centers of the focal spots. These spots were sonicated for 7 min using the vortex mode number of 4 at a focal depth of 100 mm. Phase patterns for the mode number 4 were calculated based on Equ. 1 (). A delay time of 12 s, including the transducer movement and sonication startup, was implemented. Each spot was sonicated for 19 s during which time four MR images were acquired, and this cycle was repeated throughout the experiment. For temperature feedback control (), a circular ROI with a diameter of 10 pixels (10.9 mm) was placed at the center of the heated region, and the target temperature rise (Ttarget) was set to 7 °C above the initial temperature, approximately achieving a peak temperature rise of 8 °C at the center of each focal spot. The initial acoustic power applied to the transducer surface was 24 W, and power adjustments were made based on the obtained temperature images (Section 2.3) and the controller feedback.
A tissue-mimicking phantom (InSightec, Haifa, Israel) was used in all experiments in this study. MRI parameters included 2D single slice acquisition, TR = 25.8 ms, TE = 12.9 ms, FOV = 280 mm 280 mm, Matrix = 256, thickness = 3 mm, and acquisition time = 3.3 s. A single coronal slice was positioned at the focal depth. The scan time was set to 420 s, including periods before sonication, during temperature elevation, and for over 100 s after reaching the target temperature. This scan time showed hyperthermic temperature distributions.
3. Results
3.1. Characterization of volumetric hyperthermia using simulation
3.1.1. Multiple heating spot configurations
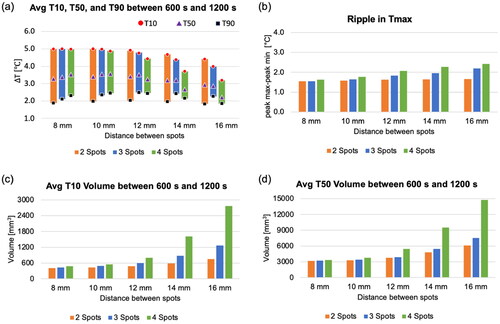
The first simulation study was conducted to investigate the characterization of hyperthermia by varying the number of focal spots (1–4) and the distance (Ds, 8–12 mm) between spots. The transducer was mechanically scanned along the X-Y plane without tilting. Sonication was performed at a focal depth of 100 mm using an acoustic power of 24 W for a maximum duration of 19 s at each spot and repeated in cycles. A binary feedback control was implemented during heating. shows the results of thermal simulation for 20 min hyperthermia delivery with 2, 3, and 4 spots including the distance Ds= 12 mm, sonication time Ts =19 s, and transducer movement time Tmov =12 s. In , the time-dependent profile of the temperature parameters within the ROI shows ripples in the temperature profile over time. Specifically, a temperature ripple in Tmax was observed within a range of approximately 6-8 °C. Increasing Ds and the number of spots, leaded to greater ripple or temperature fluctuations. Furthermore, an increase in both parameters also extended the duration required to reach the target temperature rise of 8 °C. The hyperthermic metrics T10, T50, and T90 were obtained at each time point, and the average values of T10, T50, T90, T10 volume, and T50 volume between 10 and 20 min were calculated (). When the distance Ds exceeded 10 mm, a decrease in the average values of T10 and T50 for 3 and 4 spots was observed, whereas this decrease is less pronounced for 2 spots. The lower average values of T10 and T50 correspond to the enlarged heating volumes and increased temperature ripples. When comparing the distances of 8 mm and 16 mm, the T50 volume increased by up to 1.7 times, 1.9 times, and 3 times for 2, 3, and 4 spots, respectively. Meanwhile, the temperature ripple increased by 1.1 times, 1.4 times, and 1.5 times for 2, 3, and 4 spots, respectively. Furthermore, the difference between T10 and T90, possibly indicating uniformity within the ROI, demonstrated a decreasing difference with increasing the distance Ds (). This trend may be attributed to a decrease in the average values of T10 for 2, 3, and 4 spots as the Ds increases.
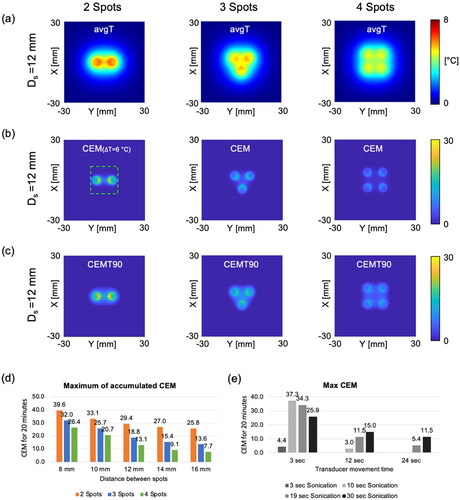
Figure 4. Three different heating patterns and the corresponding temperature distributions for (a) 2, (b) 3, and (c) 4 spots with the distance Ds= 12 mm, sonication time Ts =19 s, and transducer movement time Tmov =12 s. The mask image is generated based on an intensity exceeding 70% of the normalized acoustic intensity. The vortex beam mode 4 is utilized to sonicate each spot, creating multiple foci for large-volume heating. At the end of the thermal simulation, the temperature distributions within the phantom, featuring a simulated perfusion of 3 kg/m3/s, are presented on the X-Y plane and Y-Z plane. The magenta, black, and blue solid lines represent T10, T50, and T90 values, respectively. The green dashed box indicates the ROI to measure T10, T50, and T90 values.
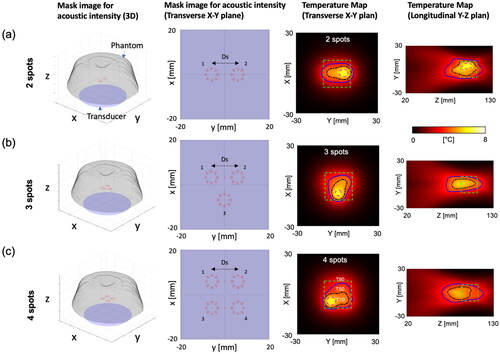
Figure 5. Simulated time-dependent profile in a tissue-mimicking phantom with a simulated perfusion of 3 kg/m3/s within an ROI (20 × 20 × 20 mm3 at the center). The sonication time Ts =19 s and transducer movement time Tmov =12 s are employed. The relative change in temperature is used for the Y-axis scale in the plots. Increasing Ds and the number of spots leads to greater fluctuations in temperature during scanning. This also extends the duration required to reach a target temperature increase of 8 °C.
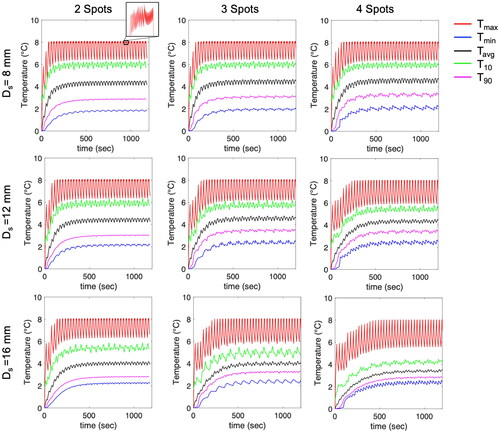
Figure 6. (a) Average values of T10, T50, T90, and difference between T10 and T90. (b) Temperature ripple in Tmax. (c, d) Average values of T10 volume and T50 volume between 10 min and 20 min. Increasing Ds results in reduced average values of T10 and T50 and increased heating volumes and temperature ripple. However, this effect is less pronounced for 2 spots.
3.1.2. Transducer movement time and sonication duration
The effects of transducer movement time and sonication time on hyperthermia characteristics were investigated through simulations. The number of spots was set to 4, each spaced 12 mm apart. presents the temperature ripple and the average values of T10, T50, T90, T10 volume, and T50 volume between 10 min and 20 min according to varying transducer movement times and sonication times. A shorter movement time naturally reduces the cooling effects, consequently leading to a smaller temperature ripple. However, if the sonication time at each shot is insufficient, the duration required to reach a target temperature may be extended, specifically in the simulation where the case of (Ts, Tmov) = (3,3) and (10,12) failed to achieve the target temperature increase of 8 °C with the acoustic power 24 W within the simulated tissue with a perfusion rate of 3 kg/m3/s.
Figure 7. The trend matrix illustrates the relationship between sonication duration (Ts) and transducer movement time (Tmov), characterizing parameter effects on average T10 (a), T50 (b), T90 (c), temperature ripple ([°C], d), and average volume (mm3) for T10 (e) and T50 (f) with the number of spots fixed at 4 and the distance (Ds) set to 12 mm. Average values were computed between 10 to 20 min.
![Figure 7. The trend matrix illustrates the relationship between sonication duration (Ts) and transducer movement time (Tmov), characterizing parameter effects on average T10 (a), T50 (b), T90 (c), temperature ripple ([°C], d), and average volume (mm3) for T10 (e) and T50 (f) with the number of spots fixed at 4 and the distance (Ds) set to 12 mm. Average values were computed between 10 to 20 min.](/cms/asset/8b83a7d5-d169-4982-979e-2c04d85d3412/ihyt_a_2349080_f0007_c.jpg)
The modification of the ExAblate Body system in this study allowed a transducer movement time of 12 s including preparation for the next sonication. With this systemic limitation, the trend matrix in shows that a sonication time over 10 s leads to a larger T50 volume, reduced temperature ripple, and elevated average T10, T50, and T90 values between 10 min and 20 min.
3.1.3. Thermal dose
shows time-averaged temperature maps for the last 200 s of the simulation. This averaged temperature map allows capturing the heating area affected by the mechanical scanning of the transducer. Identical acoustic powers and durations were applied across cases with 2–4 spots. The total acoustic energy remained consistent across all the cases. In other words, the acoustic energy within each spot was divided as the number of spots increases. Therefore, a smaller heated area had a higher peak of the cumulative thermal dose at 26 °C (CEM) and T90 (CEMT90) (). The maximum peaks of cumulative thermal dose at 26 °C and T90 were also investigated according to varying distance between spots and transducer movement time. A longer distance between spots also leads to a lower peak of CEM due to less heat interaction between spots (). The relationship between transducer movement time, sonication time, and CEM is not linear. In cases of shorter transducer movement times, such as 3 s, the highest CEM value was attained with a 10-s sonication. In contrast, when the transducer movement time exceeded 12 s, a longer sonication time resulted in the highest CEM value.
Figure 8. (a) Average temperature map at the focal plane (X-Y plane) for the last 200 s of the simulation, (b-c) a cumulative thermal dose map of CEM and CEMT90 at the focal plane, and (d-e) plots illustrating the maximum peak of CEM based on the distance between spots and transducer movement time. The sonication time is 19 s, and the transducer movement time is 12 s. The green dashed box indicates the targeted ROI to measure T10, T50, and T90 values.
3.2. Phantom experiment
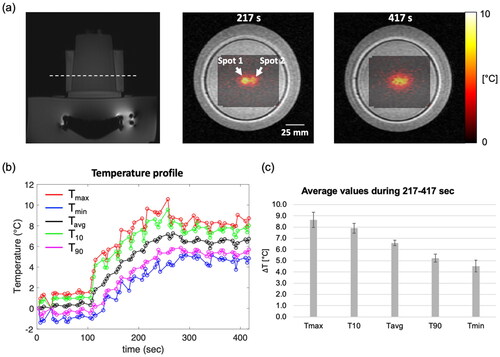
shows the results of hyperthermia heating in a tissue-mimicking phantom through the mechanical transducer movement and the sector-vortex beam mode. Two distinct spots were sonicated with a beam mode 4, and these spots were positioned on the same plane (, white dashed line). Baseline images for MR thermometry were acquired for 100 s, following which hyperthermia heating started. A temperature rise of 8 °C was achieved approximately 91 s after heating. The supplemental material, Video 1, shows that the heated region was clearly observed during acquisition. A time-dependent profile of the temperature was plotted within a circular ROI with a diameter of 10 pixels at the center of the heated region. The average values of Tmax, T10, Tavg, T90, and Tmin between 217 s and 417 s were measured to be 8.6 °C, 7.9 °C, 6.6 °C, 5.2 °C, and 4.5 °C, respectively ().
Figure 9. The results of hyperthermia heating on a tissue-mimicking phantom. (a) MR temperature maps overlaid on the corresponding magnitude image at the point when the temperature reached the target temperature and at the end of the experiment. The white-dashed line shows the acquired slice during the experiment. (b) Time-dependent profile of the temperature within a circular ROI with a diameter of 10 pixels (10.9 mm) at the center of the heated region. (c) Average values of Tmax, T10, Tavg, T90 and Tmin during steady-state time interval of 217–417.
4. Discussion
4.1. Findings in this study
This study demonstrated the feasibility of delivering volumetric hyperthermia using the ExAblate Body MR-guided focused ultrasound system with a combination of mechanical translation and beam forming along with temperature feedback control. The simulation framework was specifically designed for the ExAblate Body transducer, which comprises an annular sector-vortex array with 208 elements. The acoustic and biothermal simulations of perfused tissues allowed for performing a parametric study of varying the distance between the heating spots, sonication duration, and transducer movement time, and simulated the process for sonication and transducer movement to heat the spots sequentially and repetitively within the targeted volume. In terms of distance between spots, for a maximum temperature of 8 °C, 2 spots with a distance of 8-12 mm can achieve average T10 of 6 °C, while 4 spots with a distance of 12 mm have a decreased T10 value within the simulated tissue with perfusion of 3 kg/m3/s. In terms of the sonication time at each spot, due to a minimum transducer movement time of 12 s, a sonication time extending beyond 10 s resulted in a larger T50 volume, reduced temperature ripple, and elevated average T10, T50, and T90 values between 10 min and 20 min.
4.2. Previous MR-guided volumetric ultrasound hyperthermia
Without mechanical motion of the transducer, Partanen et al. [Citation10] achieved a heated area of around 8.5 mm in diameter using multi-focal sonication patterns. In our previous work, we demonstrated heated areas ranging from 8.8 to 15.4 mm in diameter with sector-vortex beamforming. Tillander et al. [Citation12] implemented heated cells of 44 mm diameter using mechanical steering of the transducer, reaching an average depth of 87 mm from skin. Zhu et al. [Citation13] further improved on the technique, achieving heated cells with a diameter of 58 mm at superficial targets. In our simulations, we found that it was feasible to achieve a heated area with a width of approximately 30 mm at a depth of 100 mm. The ExAblate system includes a sector-vortex arrangement structure, while the Sonalleve system utilizes a sparse array structure, which facilitates electronic steering and has the potential to generate larger cells. Even though the results from Tillander and Zhu showed larger heated area, we have shown that it is feasible to achieve volumetric hyperthermia with the ExAblate body transducer.
4.3. Focal depth & perfusion rate
We selected a focal depth of 100 mm and four spots with a distance of 12 mm (a T50 volume of 3453–5095 mm3) in the simulation for the initial analysis. This study provides potential insights for clinical investigators aiming to treat superficial and deep targets up to a depth of 100 mm. Similar to this study, the volumetric hyperthermia approach developed by Zhu et al. [Citation13] has demonstrated promising capabilities in delivering hyperthermia to near- and far-fields using the Sonalleve system. It is important to note that the ExAblate body transducer has a geometrical focal depth of 160 mm, which can allow for targeting deeper tumors. When electronically steering the beam along the longitudinal axis, a deeper focal depth will have an elongated focal length and pre-focal heating, whereas a shorter focal depth will have shorter foci and smaller regions. Hence, the hyperthermia metrics presented herein will change when the focal depth is adjusted by electronic steering. In future work, it will be essential to optimize the number of spots, spot distance on the focal plane, and sonication time while factoring in tissue perfusion, the volume of the treatment region, and adjacent anatomical structures.
In this study, the target temperature rise was set to 8 °C from the baseline temperature. shows that a shorter movement time leads to a reduced temperature ripple. Specifically, a transducer movement time of 12 s resulted in a temperature ripple of 1.9–2.2 °C in the simulated tissue with a perfusion rate of 3 kg/m3/s. Based on the results shown in , a movement time shorter than 12 s with a sonication time exceeding 10 s is advisable to maintain hyperthermic temperatures of 43–45 °C in tissues with higher perfusion. It is noteworthy that a shorter transducer movement time resulted in more localized and higher heating, whereas a longer movement time led to a larger heat distribution possibly due to increased heat diffusion. Therefore, both sonication time and movement time significantly influenced the effectiveness of focal heating, as shown in .
4.4. Selection of initial acoustic power
The initial acoustic power primarily determines the time required to attain the target temperature, with the transducer movement time and sonication time contributing significantly. A higher acoustic power can effectively reduce this time, but it also poses the risk of increasing temperature ripples if the update rate of the temperature is not sufficiently fast. In this study, an initial acoustic power of 24 W was applied in both the simulations and experiments, aligning with the temporal constraints of MR thermometry acquisition in the experiments (i.e. 3.3 s). It is worth noting that this temperature update rate may be sufficient for use in the temperature feedback controller because the rate of temperature rise was approximately 0.09 °C/s.
In the simulation, a higher initial acoustic power could be applied because the update rate of the temperature was set to 100 ms for rapid feedback control. As shown in Supplemental Figure S2, a fast transducer movement (i.e. 3 s) with an acoustic power 20 W failed to achieve the target temperature increase of 8 °C for 1200s. This failure may be due to the inadequate sonication time, which might not have been sufficient to raise the temperature within the perfused tissue. However, an acoustic power of 30 W consistently maintained a stable temperature distribution at the target temperature level in the simulated tissue with a perfusion rate of 3 kg/m3/s. This supplementary result underscores the need to carefully select the initial acoustic power, considering factors such as tissue perfusion, temperature update rate, transducer movement, and sonication duration.
4.5. MR thermometry artifacts – effects on control
During hyperthermia, prolonged MRI scan times can result in temperature errors in PRFS MR thermometry due to time-variant field drifts. In this study, PRFS temperature maps were corrected by utilizing the average temperature within an ROI well outside the treatment target zone assuming a homogeneous distribution of time-varying field drifts. However, field variations may exhibit a more complex distribution. This study employed an iterative approach for synchronized sonication/MRI acquisition and transducer movement to facilitate the delivery of volumetric hyperthermia. This approach has the potential to induce magnetic susceptibility changes because MR temperature maps are acquired after the transducer movement, which in turn can result in further field variations. A simple correction with averaged ROI values may not be sufficient to correct for PRFS thermometry. In such a situation, a more precise correction for field drift can be achieved by applying a polynomial 2D distribution [Citation35]. An nth degree polynomial can be estimated by fitting the phase values beyond the focal spot. For a more accurate evaluation of MR thermometry, the use of MR-compatible fiber optic temperature sensors should be considered [Citation36]. Multi-channel fiber optic sensors are recommended to assess the accuracy of temperature measurements both within and outside of the heated regions.
We observed field variations when hyperthermia heating was delivered to 3 different focal spots with a 12 mm distance. The correction with the averaged ROI resulted in significant temperature errors in the MR temperature maps, while the second degree polynomial function allowed for removing field drift-induced artifacts. The heated region with 3 focal spots was clearly observed in MR thermometry. Supplemental materials Figure S3 and Video 2 show the performance of hyperthermia sonicated with the acoustic power of 24 W for 204 s. In addition, a simulation was performed with no perfusion rate for validation, enabling the comparison of experiment and simulation results. Both the experimental and simulated results were in good agreement with the maximum temperature and heat distributions.
4.6. Limitation of this study and previous studies on volumetric hyperthermia
For hyperthermia heating, this study employed a practical power controller based on a target temperature range and mechanical transducer scanning on a single plane to change the focal position, as limited by constraints inherent to the Insightec platform. However, this method may be constrained in several practical scenarios. Organ motion in MR thermometry can lead to inaccurate temperature measurements, potentially resulting in the malfunction of a feedback controller. Pichardo et al. [Citation14] employed multibaseline MR thermometry [Citation37] that can measure the temperature within moving organs during a periodic cycle of respiration, and integrated a controller which compensated for the motion to maintain target temperature uniformity. Wong et al. [Citation38] devised an adaptive targeting algorithm to ensure precise localization of the focal spot using temperature tracking and electronic beam steering to enable real-time control. Sebeke et al. [Citation15] designed a controller based on a model-predictive algorithm, taking account the spatial and temporal perfusion distributions in the target, and shown to enable uniform heat distribution within the thigh muscle of in-vivo pigs, with an average perfusion of 8 kg/s/m3. Fast mechanical scanning ultrasound systems, such as the scanned focused ultrasound SFUS system [Citation39], can deliver large volumes and effective uniform hyperthermia patterns. In contrast, the slow movement time required between sonication positions is a limitation of this work that may increase the temperature ripple, reduce the effectiveness in highly perfused tissues, and reduce effective volumes of heating. Further, a scenario can often arise when the target position requires various degrees of freedom in the movement of the transducer outside of the single movement plane evaluated herein. For example, in cases where the target position is in a complex tissue structure, it might be necessary to change the direction of the transducer beam to reduce the effects of interfaces or minimize damage to nerves or blood vessels. In addition, this study has not explored the use of rapid rotation of the transducer due to system constraints and safety regulations. In the future, a volumetric hyperthermia strategy with increased freedom in mechanical scanning and more sophisticated temperature feedback control should be investigated through further system modifications.
Our study has focused on demonstrating the feasibility of volumetric hyperthermia using mechanical transducer steering and beam forming within the ExAblate MRgFUS system. Future study will involve applying advanced feedback controllers and mechanical movement with more freedom to achieve volumetric hyperthermia in in-vivo settings, addressing a broader range of practical scenarios.
5. Conclusions
This study demonstrated the feasibility of delivering volumetric hyperthermia using the ExAblate MRgFUS system. In this study, the hyperthermia temperature and dose characteristics were assessed using a fast mechanical transducer movement and a sector-vortex beamforming approach. Experiments using a tissue-mimicking phantom confirmed the capabilities of the ExAblate Body system for volumetric hyperthermia delivery. While the approach has been specifically studied for the ExAblate Body system, the methods proposed in this study possess applicability across all systems incorporating a concentric-ring sectored-vortex phased array design.
Supplemental Material
Download MS Word (1.1 MB)Acknowledgments
The authors would like to thank Matthew Adams at the University of California, San Francisco, and Noam Maimon at InSightec, Inc. for their assistance in developing the techniques.
Disclosure statement
No potential conflict of interest was reported by the author(s).
Data availability statement
The simulation source codes and/or datasets used in this study are available from the corresponding author upon reasonable request.
Additional information
Funding
References
- Siedek F, Yeo SY, Heijman E, et al. Magnetic resonance-guided High-Intensity focused ultrasound (MR-HIFU): technical background and overview of current clinical applications (part 1). Rofo. 2019;191(6):1–14. doi: 10.1055/a-0817-5645.
- Oei AL, Vriend LEM, Crezee J, et al. Effects of hyperthermia on DNA repair pathways: one treatment to inhibit them all. Radiat Oncol. 2015;10(1):165. doi: 10.1186/s13014-015-0462-0.
- Zhu L, Altman MB, Laszlo A, et al. Ultrasound hyperthermia technology for radiosensitization. Ultrasound Med Biol. 2019;45(5):1025–1043. doi: 10.1016/j.ultrasmedbio.2018.12.007.
- Magin RL, Niesman MR. Temperature-Dependent drug release from large unilamellar liposomes. Cancer Drug Deliv. 1984;1(2):109–117. doi: 10.1089/cdd.1984.1.109.
- Viglianti BL, Abraham SA, Michelich CR, et al. In vivo monitoring of tissue pharmacokinetics of liposome/drug using MRI: illustration of targeted delivery. Magn Reson Med. 2004;51(6):1153–1162. doi: 10.1002/mrm.20074.
- Bi H, Xue J, Jiang H, et al. Current developments in drug delivery with thermosensitive liposomes. Asian J Pharm Sci. 2019;14(4):365–379. doi: 10.1016/j.ajps.2018.07.006.
- Schlesinger D, Benedict S, Diederich C, et al. MR-guided focused ultrasound surgery, present and future. Med Phys. 2013;40(8):080901. doi: 10.1118/1.4811136.
- Payne A, Chopra R, Ellens N, et al. AAPM task group 241: a medical physicist’s guide to MRI-guided focused ultrasound body systems. Med Phys. 2021;48(9):e772–e806. doi: 10.1002/mp.15076.
- Kreider W, Yuldashev PV, Sapozhnikov OA, et al. Characterization of a multi-element clinical HIFU system using acoustic holography and nonlinear modeling. IEEE Trans Ultrason Ferroelectr Freq Control. 2013;60(8):1683–1698. doi: 10.1109/TUFFC.2013.2750.
- Partanen A, Tillander M, Yarmolenko PS, et al. Reduction of peak acoustic pressure and shaping of heated region by use of multifoci sonications in MR-guided high-intensity focused ultrasound mediated mild hyperthermia. Med Phys. 2013;40(1):013301. doi: 10.1118/1.4769116.
- Staruch R, Chopra R, Hynynen K. Localised drug release using MRI-controlled focused ultrasound hyperthermia. Int J Hyperthermia. 2011;27(2):156–171. doi: 10.3109/02656736.2010.518198.
- Tillander M, Hokland S, Koskela J, et al. High intensity focused ultrasound induced in vivo large volume hyperthermia under 3D MRI temperature control. Med Phys. 2016;43(3):1539–1549. doi: 10.1118/1.4942378.
- Zhu L, Lam D, Pacia CP, et al. Characterization of magnetic resonance-guided high-intensity focused ultrasound (MRgHIFU)-induced large-volume hyperthermia in deep and superficial targets in a porcine model. Int J Hyperthermia. 2020;37(1):1159–1173. doi: 10.1080/02656736.2020.1825836.
- Pichardo S, Köhler M, Lee J, et al. In vivo optimisation study for multi-baseline MR-based thermometry in the context of hyperthermia using MR-guided high intensity focused ultrasound for head and neck applications. Int J Hyperthermia. 2014;30(8):579–592. doi: 10.3109/02656736.2014.981299.
- Sebeke L, Deenen DA, Maljaars E, et al. Model predictive control for MR-HIFU-mediated, uniform hyperthermia. Int J Hyperthermia. 2019;36(1):1040–1050. doi: 10.1080/02656736.2019.1668065.
- Hynynen K, Roemer R, Anhalt D, et al. A scanned, focused, multiple transducer ultrasonic system for localized hyperthermia treatments. Int J Hyperthermia. 1986;26(1):1–11. doi: 10.3109/02656730903492916.
- Novák P, Moros EG, Straube WL, et al. SURLAS: a new clinical grade ultrasound system for sequential or concomitant thermoradiotherapy of superficial tumors: applicator description. Med Phys. 2005;32(1):230–240. doi: 10.1118/1.1835572.
- O’Neill BE, Karmonik C, Li KCP. An optimum method for pulsed high intensity focused ultrasound treatment of large volumes using the InSightec ExAblate® 2000 system. Phys Med Biol. 2010;55(21):6395–6410. doi: 10.1088/0031-9155/55/21/004.
- Kim K, Zubair M, Adams M, et al. Sonication strategies toward volumetric ultrasound hyperthermia treatment using the ExAblate body MRgFUS system. Int J Hyperthermia. 2021;38(1):1590–1600. doi: 10.1080/02656736.2021.1998658.
- Fjield T, Hynynen K. The combined concentric-ring and sector-vortex phased array for MRI guided ultrasound surgery. IEEE Trans Ultrason, Ferroelect, Freq Contr. 1997;44(5):1157–1167. doi: 10.1109/58.655641.
- Umemura S, Cain CA. The sector-vortex phased array: acoustic field synthesis for hyperthermia. IEEE Trans Ultrason Ferroelectr Freq Control. 1989;36(2):249–257. doi: 10.1109/58.19158.
- Umemura S-I, Cain CA. Analysis of temperature responses to diffused ultrasound focal fields produced by a sector-vortex phased array. Int J Hyperthermia. 1990;6(3):641–654. doi: 10.3109/02656739009140960.
- Vyas U, Christensen D. Ultrasound beam simulations in inhomogeneous tissue geometries using the hybrid angular spectrum method. IEEE Trans Ultrason Ferroelectr Freq Control. 2012;59(6):1093–1100. doi: 10.1109/TUFFC.2012.2300.
- Pennes HH. Analysis of tissue and arterial blood temperatures in the resting human forearm. J Appl Physiol. 1948;1(2):93–122. doi: 10.1152/jappl.1948.1.2.93.
- Gupta P, Srivastava A. Numerical analysis of thermal response of tissues subjected to high intensity focused ultrasound. Int J Hyperthermia. 2018;35(1):419–434. doi: 10.1080/02656736.2018.1506166.
- Gupta P, Srivastava A. Numerical study on the possible scanning pathways to optimize thermal impacts during multiple sonication of HIFU. IEEE Trans Biomed Eng. 2021;68(7):2117–2128. doi: 10.1109/TBME.2020.3026420.
- Adams MS, Scott SJ, Salgaonkar VA, et al. Thermal therapy of pancreatic tumours using endoluminal ultrasound: parametric and patient-specific modelling. Int J Hyperthermia. 2016;32(2):97–111. doi: 10.3109/02656736.2015.1119892.
- Fedorov A, Beichel R, Kalpathy-Cramer J, et al. 3D slicer as an image computing platform for the quantitative imaging network. Magn Reson Imaging. 2012;30(9):1323–1341. doi: 10.1016/j.mri.2012.05.001.
- Hasgall PA, Di Gennaro F, Baumgartner C, et al. IT’IS database for thermal and electromagnetic parameters of biological tissues version 4.0. 2018. doi: 10.13099/VIP21000-04-0.
- Sapareto SA, Dewey WC. Thermal dose determination in cancer therapy. Int J Radiat Oncol Biol Phys. 1984;10(6):787–800. doi: 10.1016/0360-3016(84)90379-1.
- Rhoon GCv. Is CEM43 still a relevant thermal dose parameter for hyperthermia treatment monitoring? International Journal of Hyperthermia. 2016;32(1):50–62. doi: 10.3109/02656736.2015.1114153.
- Ozhinsky E, Salgaonkar VA, Diederich CJ, et al. MR thermometry-guided ultrasound hyperthermia of user-defined regions using the ExAblate prostate ablation array. J Ther Ultrasound. 2018;6(1):7. doi: 10.1186/s40349-018-0115-5.
- Ishihara Y, Calderon A, Watanabe H, et al. A precise and fast temperature mapping using water proton chemical shift. Magn Reson Med. 1995;34(6):814–823. doi: 10.1002/mrm.1910340606.
- Blackwell J, Kraśny MJ, O’Brien A, et al. Proton resonance frequency shift thermometry: a review of modern clinical practices. J Magn Reson Imaging. 2022;55(2):389–403. doi: 10.1002/jmri.27446.
- Hofstetter LW, Yeo DTB, Dixon WT, et al. Fat-referenced MR thermometry in the breast and prostate using IDEAL. J Magn Reson Imaging. 2012;36(3):722–732. doi: 10.1002/jmri.23692.
- Bing C, Staruch RM, Tillander M, et al. Drift correction for accurate PRF-shift MR thermometry during mild hyperthermia treatments with MR-HIFU. Int J Hyperthermia. 2016;32(6):673–687. doi: 10.1080/02656736.2016.1179799.
- Hey S, Maclair G, Senneville BD, et al. Online correction of respiratory-induced field disturbances for continuous MR-thermometry in the breast. Magn Reson Med. 2009;61(6):1494–1499. doi: 10.1002/mrm.21954.
- Wong SM, Luo P, Keunen B, et al. An adaptive targeting algorithm for magnetic resonance-guided high-intensity focused ultrasound controlled hyperthermia. Med Phys. 2023;50(6):3347–3358. doi: 10.1002/mp.16414.
- Hynynen K, Shimm D, Anhalt D, et al. Temperature distributions during clinical scanned, focused ultrasound hyperthermia treatments. Int J Hyperthermia. 1990;6(5):891–908. doi: 10.3109/02656739009140971.