
Abstract
The emission of ultrafine particles from small desktop Fused Filament Fabrication (FFF) 3D printers has been frequently investigated in the past years. However, the vast majority of FFF emission and exposure studies have not considered the possible occurrence of particles below the typical detection limit of Condensation Particle Counters and could have systematically underestimated the total particle emission as well as the related exposure risks. Therefore, we comparatively measured particle number concentrations and size distributions of sub-4 nm particles with two commercially available diethylene glycol-based instruments – the TSI 3757 Nano Enhancer and the Airmodus A10 Particle Size Magnifier. Both instruments were evaluated for their suitability of measuring FFF-3D printing emissions in the sub-4 nm size range while operated as a particle counter or as a particle size spectrometer. For particle counting, both instruments match best when the Airmodus system was adjusted to a cut-off of 1.5 nm. For size spectroscopy, both instruments show limitations due to either the fast dynamics or rather low levels of particle emissions from FFF-3D printing in this range. The effects are discussed in detail in this article. The findings could be used to implement sub-4 nm particle measurement in future emission or exposure studies, but also for the development of standard test protocols for FFF-3D printing emissions.
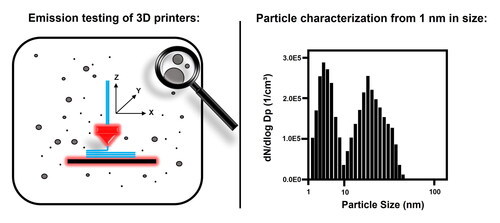
Graphical Abstract
EDITOR:
1. Introduction
Fused filament fabrication (FFF) is a material extrusion-based technique commonly used in desktop 3D printers. Especially in the last decade, FFF became more affordable and has gained popularity for the application in homes, educational institutions, and small enterprises. During a 3D printing process, the thermoplastic filament is extruded at a temperature that exceeds the melting point for crystalline polymers or the glass transition temperature for amorphous polymers. Hence, thermal degradation of the polymer and polymer evaporation and recondensation occurs which leads to the formation of gaseous and particle emissions. Users and other room occupants are often unknowingly exposed to these air pollutants during long hours of operation since low-cost 3D printers are typically neither equipped with a housing nor a filter unit. It has been reported that emissions from FFF-3D printing could induce toxicological effects and are potentially harmful (Farcas et al. Citation2022; Farcas et al. Citation2019; Stefaniak et al. Citation2017; Zhang et al. Citation2019). Previous studies have shown that mainly ultrafine particles (UFP, dP ≤ 100 nm) are released during printing activities (Alberts et al. Citation2021; Azimi et al. Citation2016; Beisser et al. Citation2020; Bernatikova et al. Citation2021; Chýlek et al. Citation2021; Deng et al. Citation2016; Dobrzyńska et al. Citation2021; Dunn et al. Citation2020; Floyd, Wang, and Regens Citation2017; Gu et al. Citation2019; Jeon et al. Citation2020; Katz et al. Citation2020; Kim et al. Citation2015; Kwon et al. Citation2017; Manoj et al. Citation2021; McDonnell et al. Citation2016; Mendes et al. Citation2017; Poikkimäki et al. Citation2019; Romanowski et al. Citation2022; Saliakas et al. Citation2022; Secondo et al. Citation2020; Seeger et al. Citation2018; Sittichompoo et al. Citation2020; Stabile et al. Citation2017; Stefaniak et al. Citation2021; Steinle Citation2016; Stephens et al. Citation2013; Tang and Seeger Citation2022; Tang, Seeger, and Röllig Citation2023; Vance et al. Citation2017; Viitanen et al. Citation2021; Yi et al. Citation2016; Zhang et al. Citation2017). Ultrafine particles can cause more severe inflammation and oxidative stress compared to larger particles due to greater reactive surface area per given mass (Duffin et al. Citation2007; Farcas et al. Citation2019; Oberdörster Citation2000). UFP can also deposit in the alveoli and lung parenchyma and have the potential to enter the heart, the bloodstream and reach other organs (Hong and Jee Citation2020; Oberdörster et al. Citation2004).
Hitherto, most of the FFF-3D printing studies were only able to effectively detect particle sizes down to approx. 3-5 nm using conventional water or n-butanol based Condensation Particle Counter (CPC) as a standalone device or as a detector of an aerosol spectrometer. To further reduce the particle size detection limit, an upstream device (i.e., a particle enhancer or a magnifier) can be applied to grow very small particles to a size conventional CPCs can detect at their plateau efficiency (i.e., with their maximum efficiency). Such devices use a working fluid with low vapor pressure and high surface tension, e.g., diethylene glycol (DEG) (Iida, Stolzenburg, and McMurry Citation2009). Two DEG based instruments have been commercialized so far: the Nano Enhancer (TSI Inc., USA) and the Particle Size Magnifier (PSM, Airmodus Ltd., Finland). For particle size spectroscopy, the Nano Enhancer can be combined with a Nano-Differential Electrical Mobility Classifier while the PSM uses a different sizing principle. The PSM has been used in two previous FFF-3D printing emission studies by Mendes et al. (Citation2017) and by Poikkimäki et al. (Citation2019). Both studies have pointed out that a significant portion of the total particle emission from FFF are between 1 and 3 nm in particle size. For instance, Poikkimäki et al. (Citation2019) calculated that this fraction could make up to 48% of the total particle number emission. In the vast majority of FFF emission and exposure studies the possible occurrence of particles below the typical CPC detection limit was often not paid attention to or the experimental effort was possibly considered as too high. This could have had the effect of a systematic underestimation of the total particle emission and the related exposure risks in these studies. Further, information on the sub-4 nm fraction is relevant for understanding the fundamental particle formation processes during FFF-3D printing and their dependencies on filament materials and printer hardware.
The aim of this study is the measurement of organic sub-4 nm particle emissions from FFF-3D printing in an emission test chamber under controlled conditions. To the best of our knowledge this is the first time parallel measurements with the TSI 3757 Nano Enhancer and the Airmodus A10 Particle Size Magnifier have been performed to check a) if earlier findings could be verified and b) if and how these devices compare with respect to size spectroscopy and quantification of organic sub-4 nm particles from FFF-3D printing. This was motivated by the fact that Nano Enhancer and PSM use different approaches for particle growth and size spectroscopy. Last but not least, we compared the instruments in different configurations and modes to determine the detection limits and to find the most suited operation settings for the quantification of the sub-4 nm fraction. This should be implemented in a future standardized emission test procedure for FFF-3D printers, e.g., comparable to the German Blue Angel test method DE-UZ 219 (Blauer Engel Citation2021) for laser printers.
2. Materials and methods
2.1. Printers and filaments
In this study, we used three FFF-3D printers with different technical features. The Craftbot 2 (abbr. CB2, Craftbot Ltd, Hungary) is originally fully enclosed. For emission testing, the cover hood with a built-in HEPA filter and the side panes were removed. An MK8 brass nozzle (M6 threading size, 5 mm threading length) with an output diameter of 0.4 mm was applied. The operating temperature range is 180–260 °C and 50–110 °C for extruder (TE) and printing bed (TB), respectively.
The Creatbot F160 Peek (abbr. CP, Henan Creatbot Technology Limited, PRC) was used with its high temperature hotend (brass heating block) in combination with MK8 hardened steel nozzles (abbr. CP(H-S)). The printer is fully enclosed in a housing, consisting of a metal frame and polycarbonate panes. The extruder can be heat up to 420 °C and the printing bed to 150 °C. A built-in heater maintains the interior housing temperature at a maximum of 70 °C. For emission testing, the housing lid was dismounted, and the interior heater was turned off.
The Anycubic i3 Mega S (abbr. AnyM, Shenzhen Anycubic Technology Co., Limited, PRC) operates within the standard temperature ranges of 180–260 °C for the extruder and up to 110 °C for the printing bed. This printer uses E3D V6 brass nozzles (M6 threading size, 7.5 mm threading length, the nozzle head is smaller than MK8). AnyM has no enclosure which impedes the heating up of the printing bed inside the testing chamber with active air circulation. Therefore, we decided to limit the maximum printing bed temperature to 80 °C during emission testing. The emission from the printing bed is expected to be negligible (Tang and Seeger Citation2022).
In Tang, Seeger, and Röllig (Citation2023), we reported that the FFF-3D printers show systematic deviations of the actual extruder temperature from the set temperature. Therefore, all test printers in this study were adjusted to the same extruder temperature according to the procedure described in Tang, Seeger, and Röllig (Citation2023) in order to avoid hardware bias when comparing emission from different printers. Based on our experience with testing a wide range of filament products, three filaments were selected for the investigation of sub-4 nm particles (see ). The extruder temperature for the filament nGen-S-01 was intentionally set well above the manufacturer’s recommendation in order to generate more sub-4 nm particles for the emission testing. The test printers are all compatible with 1.75 mm diameter filaments.
Table 1. Test printers and filaments.
2.2. Strand printing method (SPM)
In this study, SPM was applied as a standard printing procedure for all testing printers. A defined length of filament (800 mm) is extruded at a constant rate over time and is subsequently deposited on the printing bed without forming a 3D object. SPM proved to be a robust standardized printing procedure for the comparison of different printer models and filaments as described in Tang and Seeger (Citation2022). Individual SPM-G codes, i.e., standardized printer commands, for each printer model considering technical differences in hardware and software were described in the supplementary information of Tang, Seeger, and Röllig (Citation2023).
2.3. Emission test chamber
Measurements were conducted in a 5-m³ emission test chamber which complies with the standard ISO 16000-9:2006 (ISO Citation2006) and the basic criteria of the DE-UZ-219 “Blue Angel” emission test guideline (Blauer Engel Citation2021). The climate maintains at T = 23 °C ± 2 K and RH = 50% ± 5%. Filtered and particle free clean air is supplied by turbulent ventilation at an exchange rate of 1 h−1. All particle measuring instruments were positioned outside the test chamber and were connected to it via as short as possible straight conductive aerosol sampling lines. The printer under test was positioned in the center of the chamber interior with approx. 1.1 m to the sampling line inlets.
2.4. Experimental setup, measurements, and data evaluation
The Airmodus A11 nano Condensation Nucleus Counter (nCNC) system consists of an A10 Particle Size Magnifier (PSM) and an A20 Butanol Condensation Particle Counter (BCPC), for a detailed description see e.g., (Lehtipalo et al. Citation2022; Vanhanen et al. Citation2011). The DEG-based PSM operates at a saturator temperature of 79 °C and a growth tube temperature of 3.5 °C. It serves as a pre-magnification stage to grow particles from a minimum mobility equivalent diameter D50, min = 1.38 nm up to approx. 90 nm. Downstream, the BCPC further grows the particles to optical detectable sizes to be counted in the CPC at its plateau efficiency (determined with nickel chromium particles according to the manufacturer’s calibration certificate). The 50% cut-off diameter (D50) can be altered to a maximum of 4 nm by varying the DEG saturator flow rate (manufacturer calibrated flow rates and respective D50 values are listed in Table S1 in the supplementary information). This allows for particle number size distribution (PNSD) measurements between 1.38 and 4 nm by changing the saturator flow rates over time either in stepping mode (up to 4 preselected steps) or scanning mode (8 steps). These modes require the particle size distribution to remain stable over time because some time is needed to adjust and stabilize the flow. This is the reason why both modes are not suitable to properly measure the dynamic particle emission of a short FFF print job (e.g., such as in SPM). In this study, we therefore ran the PSM in the so-called fixed mode where the total particle number concentration (TPNC) of all particles is measured with a fixed, preselected D50 and with 1 Hz time resolution of the CPC. As has been proved in Section 3.3, the time dependent TPNC generated in FFF printing is highly reproducible. On that condition it is possible to calculate a PNSD from repeated measurements with different settings for D50.
The DEG-based TSI 3757 Nano Enhancer (TSI Inc., USA) was combined with a TSI 3787 Water CPC to set up a 1 nm CPC. This setup differs from the standard manufacturer’s configuration where a TSI 3750 BCPC with 1 L/min sample flow rate is used. To satisfy the higher sample flow of the TSI 3787 WCPC, a make-up air flow of 0.5 L/min was added. The 1 nm CPC was combined with a TSI 3082 Electrostatic Classifier, a TSI 3088 Advanced Aerosol Neutralizer and a TSI 3086 Differential Electrical Mobility Classifier (Nano-DEMC) operated at 25 L/min sheath flow to set up a 1 nm Scanning Mobility Particle Spectrometer (1 nm SMPS) for PNSD measurements with electrical mobility diameters between approx. 1 and 30 nm. The 1 nm SMPS was operated in the “compact” configuration according to the TSI application note “SMPS-010 rev. A-(A4)” (TSI Incorporated Citation2019) to minimize diffusion losses in the instrument. For data inversion, manufacturer’s instructions were applied to correct for detection efficiencies and diffusion losses with the TSI Aerosol Instrument Manager (AIM) software ver.10.3. It should be noted that the terms 1 nm CPC and 1 nm SMPS were originally implemented by the manufacturer TSI. In several studies the temperature difference Δt between saturator and condenser in a TSI Nano Enhancer was deliberately changed to further improve the lower size detection limit (Kangasluoma et al. Citation2017; Wlasits et al. Citation2020). This was also investigated in this study as described in Sections 3.1 and 3.2. Here, the suffix (S) refers to the operation at standard temperature setting for saturator: TSaturator= 62 °C and condenser: TCondenser= 12 °C while the suffix (H) refers to the high temperature setting. The high temperature setting is limited as the onset of DEG particles formation by homogeneous nucleation must be avoided. This limit was determined experimentally as described in Figure S1 in the supplementary information.
Additionally, a standalone TSI 3775 Butanol CPC (BCPC) measured the TPNC in the size range from approximately 4–3000 nm. A TSI 3090 Engine Exhaust Particle Spectrometer™ (EEPS™) scanned the PNSD between 5.6 and 560 nm. A Grimm 1.108 Optical Particle Size Spectrometer (OPSS) scanned the size range between 0.3 and 20 μm. During all measurements no significant contributions in the OPSS size range could be observed and therefore the OPSS data were not considered for further evaluation. EEPS™ and BCPC recorded the TPNC at 1 Hz and the OPSS operated at 1/6 Hz.
This study consists of the following experiments:
The detection efficiency curve of the customized 1 nm CPC was measured in standard (S) and high temperature mode (H) with NaCl particles following ISO 27891:2015 (ISO Citation2015).
The effect of the two 1 nm CPC temperature modes on the measurement of the TPNC time series from printing the ABS-PR-01 filament on the printer AnyM was determined and compared.
Various filaments were operated on the three FFF printers in SPM and the TPNC time series of emitted particles were in parallel measured by the Airmodus A11 nCNC in fixed mode at different cut-off settings and by the customized TSI 1nm CPC (S) with standard temperature mode.
PNSDs from printing ABS-PR-01 and PEI-N-01 filaments on printer AnyM and CP(H-S), respectively, were scanned in parallel with the 1nm SMPS and the EEPS™. The spectra were compared to the PSM size spectra calculated from the data from experiment 3.
In , the instrumental set-up is shown as an example for the experiment 3 and the set-ups of the other experiments are illustrated in Figures S2 and S3 in the supplementary information. It should be noted that the effective air exchange rate in the emission test chamber is increased due to the total sampling flow rate of all connected particle measuring instruments. In the third experiment, most devices were operated simultaneously, resulting in an effective air exchange rate of 1.21 h−1 while in the other experiments it was 1.18 h−1.
Figure 1. Schematic diagram of the instrumental set-up of the third experiment with sample line lengths and sample flows.

The A11 nCNC inversion calculation from raw counts to number concentrations and PNSD is described in the supplementary information. The sample flow to the A20 BCPC was diluted by a factor 5.5 to keep particle number concentrations below the upper detection limit.
Diffusional losses in sample lines were corrected according to Gormley and Kennedy (Citation1949), details are described in the supplementary information.
3. Results and discussions
3.1. Detection efficiencies of the 1 nm CPC
Prior to the efficiency measurement at different temperature settings, the onset of homogenous nucleation in the Nano Enhancer was determined by monitoring the background number concentration during stepwise increasing the saturator temperature Ts respectively for three settings of the condenser temperature Tc. Results are shown in Figure S1 in the supplementary information. For the TSI 3757 Nano Enhancer, TC = 12 °C, TS = 66 °C and Δt = 54 °C was found to be the high temperature mode (H) just below the onset of homogeneous nucleation. A safety buffer of 2 °C was considered.
Following ISO 27891, the 1 nm CPC was calibrated in the size range from 1.7 to 5 nm with dry, positively charged NaCl particles and using a Faraday cup electrometer (BAM inhouse development) as reference, see description and Figure S4 in the supplementary information. The detection efficiency data for standard (S) and high temperature (H) modes were fitted with a sigmoidal function (see ). Considering the measurement uncertainty, both modes resulted in almost the same D50 of 1.78 ± 0.03 nm for NaCl particles in good agreement with the D50 of 1.6 ± 0.3 nm found by Wlasits et al. (Citation2020). Wlasits et al. (Citation2020) used the TSI 3777, a predecessor of the TSI 3757 Nano Enhancer at TC = 12 °C and TS = 66 °C in standard mode (Measurements with NaCl in high temperature mode were not reported). A material dependency of the TSI 3777 D50 was reported by Kangasluoma et al. (Citation2017) for tungsten oxide (WOx) and tetradodecylammonium bromide (TDDABr) and also by Wlasits et al. (Citation2020) for ammonium sulfate, oxidized β-caryophyllene and Ag. It is worth noting that the conditions were not exactly the same, as Kangasluoma et al. (Citation2017) achieved a considerably higher Δt of 63 °C between condenser and saturator and hence a higher supersaturation ratio. Among several reasons for the material dependency, the particle’s charging states and polarities must also be considered.
Figure 2. Detection efficiencies of the 1 nm CPC for NaCl particles measured with two temperature modes. Sigmoidal fits were used for the determination of D50 according to ISO 27891.

Our D50 for NaCl is larger than the D50 of 1.4 nm (measured with negatively charged NaCl) by the manufacturer for the same Nano Enhancer model (TSI 3757) but in combination with the TSI 3750 n-butanol CPC (see TSI application note 3757-001 Rev B A4 (TSI Incorporated Citation2023)). The charging state of the test particles may play a role since negatively charged particles require smaller saturation ratios for heterogenous nucleation than positively charged ones (Winkler et al. Citation2008). There might also be an effect of the CPC type. Wlasits et al. (Citation2020) showed that a n-butanol-based CPC may reveal for a variety of particles with different chemistry a pronounced higher plateau efficiency compared to a water-based CPC.
As regards the particle’s polarity, it can be expected that the D50 for particles emitted from FFF-3D printing, which are by origin polymeric and with low polarity, is slightly larger than the D50 for the polar NaCl calibration particles for DEG-based Enhancers (Wlasits et al. Citation2020).
Our result shows for the customized 1 nm CPC a rather small impact from different temperature settings on the plateau efficiency which is approx. 0.81 ± 0.02. All 1 nm CPC data were corrected with this value.
3.2. Emission testing with the 1 nm CPC at two temperature modes
Printing filament ABS-PR-01 on the AnyM printer showed the highest sub-4 nm emission and was therefore chosen for the comparison of the (S) and (H) modes for the 1 nm CPC in experiment 2. It should be noted that the absolute emission levels in this printer-filament combination may change due to intermediate cleaning procedures between the measurements. Parallel to the 1 nm CPC the emissions were measured by the TSI 3775 BCPC which has a manufacturer specified D50 of 4 nm. The SPM print job starts with the heating phase, where the extruder and the printing bed are heated up simultaneously. Once the desired temperatures are reached, the printing phase begins with filament extrusion. shows that the TPNC emission curves in (H) and (S) modes reveal good repeatability within a reasonable small measurement uncertainty. The (H) mode showed neither a significant improvement of the lower detection limit nor an increase in detection efficiency. This finding corresponds to the calibration result with NaCl particles in Section 3.1. Hence, as no improvement could be achieved with high temperature setting, the standard temperature setting was kept for the experiments in Sections 3.3 and 3.4. In comparison, the TSI 3775 BCPC signal drastically falls below the 1 nm CPC curves. This discrepancy is not constant but seems to be highest at the beginning of the heating phase where the sub-4 nm particle emission is expected to be at its maximum. It is however reduced afterwards (see Figure S5 in the supplementary information). At the end of the printing phase the TSI 3775 BCPC signal makes about 44% of the 1 nm CPC (S) concentration. This example illustrates the very limited suitability of standalone CPCs for the quantification of aerosols from FFF printers, where time-varying particle size fractions at or below the lower size limit occur. Ignoring this effect, e.g., during an exposure measurement, may lead to a significant underestimation of the actual exposure level. This result is consistent with the findings of Mendes et al. (Citation2017) and Poikkimäki et al. (Citation2019).
Figure 3. TPNC arithmetic means (lines) and standard deviations (shaded areas) from repeated (n = 3) measurements of emissions from the ABS-PR-01 filament during SPM with the 1 nm CPC in (S) and (H) modes, and with the TSI 3775 BCPC. HP and PP indicate heating and printing phases.

3.3. Total particle number concentration
shows for three selected filaments the TPNC time series of the A11 nCNC in fixed mode at different selected D50 as well as the parallel measurements with the 1 nm CPC in (S) mode (with the previously determined D50 of approx. 1.78 ± 0.03 nm). The 1 nm CPC time series are presented as arithmetic mean and standard deviation of repeated measurements. Overall, all tested filaments showed an apparently good repeatability of emissions and characteristic emission profiles: The nGen-S-01 filament reveals a continuous rise in emission from the start to the end of printer activity while ABS-PR-01 and PEI-N-01 formed two distinct concentration plateaus during the operational phases (heating (HP) and printing (PP)). All concentration curves drop rapidly with the end of printing due to losses in the chamber. The good repeatability is a prerequisite for the calculation of PNSD within the range from 1.38 to 4 nm from the A11 nCNC data (details are given in the supplementary information). The A11 nCNC curves clearly show the occurrence of sub-4 nm particles for all tested printer-filament combinations. There is a clear trend: In all examples the highest TPNC levels are generally associated with the smallest D50. For the filament ABS-PR-01, substantial TPNC differences between the two lowest investigated D50 (1.38 and 1.5 nm) can be seen, indicating a contribution of particles below 1.38 nm in size. This is not observable for the filaments PEI-N-01 and nGen-S-01 as the emissions seem to be mostly above the lowest D50 (1.38 nm). While the filaments ABS-PR-01 and PEI-N-01 form sub-4 nm particles predominately during heating up, the nGen-S-01 filament in contrast show sub-4 nm particle emission throughout the heating and the printing phase. Overall, the 1 nm CPC and the A11 nCNC show a good temporal correlation as well as similar shapes of the TPNC curves. The question arises under what settings both instruments deliver quantitatively comparable results for organic particles from FFF-3D printing. To further investigate this, we plotted in the TPNCs at the time when printing stopped. The diagram contains data from the A11 nCNC with different selected D50 as well as the corresponding 1 nm CPC data points. The intersections of these curves indicate that the best quantitative comparability between both instruments is achieved when the A11 nCNC is adjusted to a D50 of 1.5 nm.
Figure 4. TPNC time series during heating up and printing for the three filament-printer combinations (given in ) measured with the A11 nCNC (left) at different D50 in fixed mode and the 1 nm CPC with standard settings (right). For the 1 nm CPC, the black line depicts the mean, and the shaded area depicts the standard deviation from repeat measurements (n = 8 for ABS-PR-01, n = 6 for PEI-N-01 and nGen-S-01). The heating phase (HP) and the printing phase (PP) are marked with dashed lines.

Figure 5. Comparability of the A11 nCNC and 1 nm CPC. The TPNC at the end of printing is depicted for the respective A11 nCNC fixed D50 measurement and the corresponding 1 nm CPC measurement.

3.4. Particle number size distribution
The particle number size distributions (PNSD) of the tested filament-printer combinations remain mainly below 50 nm (see PNSD from the EEPS™ in Figures S6-S8 in the supplementary information). In this section, we focus on the evaluation of the size distribution in the sub-4 nm fraction using exemplarily the filament ABS-PR-01 which turned out to produce high and repeatable emissions in this range. The PNSDs are depicted in . It was observed that both, A11 nCNC and 1 nm SMPS, have been able to measure sub-4 nm particle contributions during printer activities (heating up and printing), but the normalized size spectra are not at all comparable. The emissions measured by the A11 nCNC are time-synchronous with the printer activities and clearly peak below 2 nm. After printing, the concentrations in all size bins fall due to particle losses in the chamber steadily to the chamber background, which is at least two orders of magnitude lower than the peak concentrations. In comparison, the 1 nm SMPS size distribution spectrum reveals the following remarkable features:
Figure 6. Normalized PNSD of the filament ABS-PR-01 printed on AnyM. The A11 nCNC spectrum was compiled with four distinct D50 (1.38, 1.55, 2.04, 4 nm) measurements. The 1 nm SMPS scanned in the size range between 1 and 7 nm at 10 s time resolution. The sub-4 nm section is displayed. Heating (HP) and printing phase (PP) are marked.

In the sub-2 nm range, ion clusters are observable and their contribution to the PNSD is very high. The occurrence of ion clusters is not time-correlated with printer activities.
The printer emissions below 2.5 nm are “unseen” by the 1 nm SMPS.
In the size range between approximately 2.5 to 4 nm the particle emissions detected by the 1 nm SMPS are synchronous to the printer activity.
The features are discussed below.
As to feature (1): reveals that in a clean carrier gas ion clusters are generated by the soft X-ray bipolar charger, as they immediately disappear after switching off. These ion clusters are actually required for electrical mobility spectrometry to bring the airborne particles to a defined and steady-state charge distribution as described e.g., in Wiedensohler (Citation1988). The generation of ion clusters in chargers has been discussed in previous work (Kallinger, Steiner, and Szymanski Citation2012; Liu et al. Citation2020; Steiner Citation2011). Primary ions of both polarities are initially produced by the ionization of the carrier gas molecules which subsequently react with water vapor or other gaseous impurities in the carrier gas to form larger ion clusters, generally in the size of about 1.3 nm ± 0.4 nm (Steiner Citation2011). The availability and the chemical composition of bonding partners have therefore a strong impact on the ion generation rate, the formed ion cluster species, and the ion size distribution (Manninen et al. Citation2011; Steiner Citation2011). In our case, even though the test chamber is supplied with clean air (free of particles and volatile organic compounds (VOC)), water vapor from chamber air conditioning and also VOCs emitted from FFF printing (Azimi et al. Citation2016; Gu et al. Citation2019; Seeger et al. Citation2018) might act as potential initiators for ion cluster formation. The carrier gas impurities vary significantly between different polymeric filament products and presumably the formed ion cluster species may vary too in size and quantity. Steiner (Citation2011) showed in his work that 2 m long plastic tubing (made of PC, PU, PVC) upstream the charge evaporates enough gaseous impurities to alter the ion cluster size distribution. Additionally, the ion cluster size may increase with humidity (Liu et al. Citation2020; Manninen et al. Citation2011; Steiner Citation2011). With the set negative voltage, the 1 nm SMPS was only able to measure the larger positive ion clusters. It can be assumed that the actual positive ion cluster concentration at the exit of the charger is higher since diffusion losses between charger and DEMC as well as the DEMC transmission losses may not be properly compensated by the inversion algorithm.
Figure 7. Normalized PNSD of ion clusters measured during sampling HEPA-filtered room air. The soft X-ray charger was either turned on or off as marked in the figure. The 1 nm SMPS scanned in the size range between 1 and 29.4 nm at 50 s time resolution. The sub-4 nm section is displayed.

As to feature (2): Printer related particle emissions below 2.5 nm are clearly not detected by the 1 nm SMPS. Measurements of the PEI-N-01 filament emissions are presented in the supplementary information and underpin the fact that the effect is not an isolated case (see Figure S9). This discrepancy might be due to actual very high diffusion losses in this instrument in this size range. Although ion clusters suffer the same high losses as particles of same size, their concentration at the outlet of the charger is obviously much higher and at least well above the CPC’s lower limit of detection (LLOD) and hence they appear in the PNSD. On the other hand, particle emissions from the 3D printing process seem to be close to or below the LLOD which inhibits raw data inversion and losses compensation. This is even more critical as diffusion losses might be systematically underestimated by the instrument software. Liu et al. (Citation2022) stated that the 1 nm SMPS (TSI 3839E57) usually underestimates diffusion losses, while the A11 nCNC may either overestimate or underestimate them depending on the properties of the particles. A possible cause for non-detection of the polymeric sub-2.5 nm particles emitted from the printer could also be their charge distribution downstream of the soft X-ray charger. The charging state of the particles upstream of the charger is not known and might be too extreme for achieving a Wiedensohler charge distribution, which is assumed by the raw data inversion routine. Last not least, it cannot be excluded that charging of these extremely small polymeric particles is highly ineffective. These hypotheses could not be verified because characterization of the charging state of the sub-2.5 nm fraction was beyond the scope of this study and remains a future task. A 1:1 correlation between the 1 nm SMPS and the 1 nm CPC as reference could however be shown over a wide concentration range with polydisperse sub-4 nm NaCl particles (mode diameter < 1.4 nm) (TSI application note “SMPS-010 rev. A-(A4)” (TSI Incorporated Citation2019)).
Our results suggest that typical particle emissions from FFF-3D printing below approximately 2.5 nm are hardly detectable by a 1 nm SMPS although the TPNC maxima of 105 - 106 cm−3 represent relatively high emitting scenarios in a test chamber with comparatively small volume (Azimi et al. Citation2016; Floyd, Wang, and Regens Citation2017; Mendes et al. Citation2017; Poikkimäki et al. Citation2019; Tang and Seeger Citation2022). Under typical indoor usage conditions, e.g., in a laboratory or workshop, the TPNC are expected to be much lower (Mendes et al. Citation2017; Steinle Citation2016; Stephens et al. Citation2013; Zhou et al. Citation2015) and hence the conditions for size spectroscopy with the 1 nm SMPS are even worse.
As to feature (3): Contributions above 2.5 nm, which are time-correlated to printer activities, were clearly seen by the 1 nm SMPS. It can be concluded that in this range charging states and losses are obviously compensated correctly which results approximately in a 1:1 correlation to the A11 nCNC.
4. Conclusion
In this study, two commercialized DEG-based instruments – the TSI 3757 Nano Enhancer and the Airmodus A10 Particle Size Magnifier - were compared and evaluated for their suitability of measuring FFF-3D printing emission in the sub-4 nm size range. The instruments were either operated as a particle size spectrometer or as a particle counter.
Measuring size resolved sub-4 nm particle emission data during FFF-3D printing is associated with limitations. The A11 nCNC system in stepping or scanning mode allows size scanning without interference by charger ion clusters but at the expense of a relatively low size and time resolution. It might be a solution for observing FFF-3D printing emissions process under conditions of equilibrium between particle production and losses that occur after an initial dynamic phase, e.g., examined in Poikkimäki et al. (Citation2019). The A11 nCNC might also suit for the application in the standard method ANSI/CAN/UL 2904 (Citation2019) as the exposure is evaluated for a several hours lasting print jobs. Difficulties appear when the particle emission is highly dynamic, for instance during SPM. In case the emission is repeatable, a conceivable approach is the sequential TPNC measurement at different fixed D50 cut-off diameter to calculate a size distribution spectrum as presented in this study. A drawback would then be the higher time effort for repeat measurements and subsequent data processing. The 1 nm SMPS in the described configuration seems not suitable for the purpose of particle spectroscopy in the size range below approx. 2.5 nm to quantify FFF printer emission mainly due to the unavoidable interference with charger ion clusters.
As a particle counter, both instruments showed their capability of quantifying sub-4 nm particles. The best quantitative comparability between both instruments is achieved with the A11 nCNC adjusted to a D50 of 1.5 nm. Therefore, within the framework of an emission test standard, satisfying quantitative comparability with different instrumentation can only be achieved with a “going for the weakest instrument” approach, i.e., accepting that a part of the particle emission spectrum may be ignored for the sake of instruments comparability, as has been discussed on the example of particle emissions from the filament ABS-PR-01. Both instruments are applicable for the determination of non-size resolved metrics like the particle emission rate (PER), or the total number of emitted particles (TP) described in the standard method ANSI/CAN/UL 2904 (Citation2019) and DE-UZ-219 (Blauer Engel Citation2021) but could also be implemented in an emission test standard for quick FFF filament testing using SPM. This is envisaged in the near future to characterize in combination with additional instruments the entire particle emission spectra from FFF-3D printing.
Supplemental Material
Download MS Word (2.6 MB)Acknowledgments
The authors thank Prof. Dr. Andreas Held (Technical University of Berlin), Dr. Joonas Vanhanen (Airmodus Ltd.) and Dr. Torsten Tritscher (TSI GmbH) for a review of the manuscript prior to submission to the journal. The authors thank Dr. Joonas Vanhanen and Dr. Torsten Tritscher for valuable support in setting up the instruments, data evaluation and for fruitful discussions. The authors would also like to thank Minghao Wang for his support with the measurements.
Disclosure statement
No potential conflict of interest was reported by the author(s).
Additional information
Funding
References
- Alberts, E., M. Ballentine, E. Barnes, and A. Kennedy. 2021. Impact of metal additives on particle emission profiles from a fused filament fabrication 3D printer. Atmos. Environ. 244:117956. doi: 10.1016/j.atmosenv.2020.117956.
- ANSI/CAN/UL 2904 2019. Standard method for testing and assessing particle and chemical emissions from 3D printers Accessed January 30, 2023. https://www.shopulstandards.com/ProductDetail.aspx?UniqueKey=35397.
- Azimi, P., D. Zhao, C. Pouzet, N. E. Crain, and B. Stephens. 2016. Emissions of ultrafine particles and volatile organic compounds from commercially available desktop three-dimensional printers with multiple filaments. Environ. Sci. Technol. 50 (3):1260–8. doi: 10.1021/acs.est.5b04983.
- Beisser, R., S. Werner, B. Heinrich, and J. Pelzer. 2020. Emissions from desktop 3D printers-more closely examined-part 1. GrdL. 80 (01-02):53–60. doi: 10.37544/0949-8036-2020-01-02-55.
- Bernatikova, S., A. Dudacek, R. Prichystalova, V. Klecka, and L. Kocurkova. 2021. Characterization of ultrafine particles and VOCs emitted from a 3D printer. IJERPH. 18 (3):929. doi: 10.3390/ijerph18030929.
- Blauer Engel (Blue Angel). 2021. Environmentally friendly printers and multifunction devices (DE-UZ 219) Accessed December 14, 2022. https://www.blauer-engel.de/en/productworld/printers-and-multifunction-devices/laser-led-devices-toner.
- Chýlek, R., L. Kudela, J. Pospíšil, and L. Šnajdárek. 2021. Parameters influencing the emission of ultrafine particles during 3D printing. IJERPH. 18 (21):11670. doi: 10.3390/ijerph182111670.
- Deng, Y., S.-J. Cao, A. Chen, and Y. Guo. 2016. The impact of manufacturing parameters on submicron particle emissions from a desktop 3D printer in the perspective of emission reduction. Build. Environ 104:311–9. doi: 10.1016/j.buildenv.2016.05.021.
- Dobrzyńska, E., D. Kondej, J. Kowalska, and M. Szewczyńska. 2021. State of the art in additive manufacturing and its possible chemical and particle hazards-review. Indoor Air. 31 (6):1733–58. doi: 10.1111/ina.12853.
- Duffin, R., L. Tran, D. Brown, V. Stone, and K. Donaldson. 2007. Proinflammogenic effects of low-toxicity and metal nanoparticles in vivo and in vitro: highlighting the role of particle surface area and surface reactivity. Inhal. Toxicol. 19 (10):849–56. doi: 10.1080/08958370701479323.
- Dunn, K. L., D. Hammond, K. Menchaca, G. Roth, and K. H. Dunn. 2020. Reducing ultrafine particulate emission from multiple 3D printers in an office environment using a prototype engineering control. J. Nanopart. Res. 22 (2):112. doi: 10.1007/s11051-020-04844-4.
- Farcas, M. T., W. McKinney, J. Coyle, M. Orandle, W. K. Mandler, A. B. Stefaniak, L. Bowers, L. Battelli, D. Richardson, M. A. Hammer, et al. 2022. Evaluation of pulmonary effects of 3-D printer emissions from acrylonitrile butadiene styrene using an air-liquid interface model of primary normal human-derived bronchial epithelial cells. Int. J. Toxicol. 41 (4):312–28. doi: 10.1177/10915818221093605.
- Farcas, M. T., A. B. Stefaniak, A. K. Knepp, L. Bowers, W. K. Mandler, M. Kashon, S. R. Jackson, T. A. Stueckle, J. D. Sisler, S. A. Friend, et al. 2019. Acrylonitrile butadiene styrene (ABS) and polycarbonate (PC) filaments three-dimensional (3-D) printer emissions-induced cell toxicity. Toxicol. Lett. 317:1–12. doi: 10.1016/j.toxlet.2019.09.013.
- Floyd, E. L., J. Wang, and J. L. Regens. 2017. Fume emissions from a low-cost 3-D printer with various filaments. J. Occup. Environ. Hyg. 14 (7):523–33. doi: 10.1080/15459624.2017.1302587.
- Gormley, P. G., and M. Kennedy. 1949. Diffusion from a stream flowing through a cylindrical tube. Proc. R. Irish Acad. Sec. A Math. Phys. Sci. 52:163–9.
- Gu, J., M. Wensing, E. Uhde, and T. Salthammer. 2019. Characterization of particulate and gaseous pollutants emitted during operation of a desktop 3D printer. Environ. Int. 123:476–85. doi: 10.1016/j.envint.2018.12.014.
- Hong, G., and Y.-K. Jee. 2020. Special issue on ultrafine particles: Where are they from and how do they affect us? Exp. Mol. Med. 52 (3):309–10. doi: 10.1038/s12276-020-0395-z.
- Iida, K., M. R. Stolzenburg, and P. H. McMurry. 2009. Effect of working fluid on sub-2 nm particle detection with a laminar flow ultrafine condensation particle counter. Aerosol Sci. Technol. 43 (1):81–96. doi: 10.1080/02786820802488194.
- ISO. 2006. Indoor air - Part 9: Determination of the emission of volatile organic compounds from building products and furnishing - Emission test chamber method (ISO 16000-9:2006). Berlin: Beuth.
- ISO. 2015. Aerosol particle number concentration - Calibration of condensation particle counters (ISO 27891:2015). Berlin: Beuth.
- Jeon, H., J. Park, S. Kim, K. Park, and C. Yoon. 2020. Effect of nozzle temperature on the emission rate of ultrafine particles during 3D printing. Indoor Air. 30 (2):306–14. doi: 10.1111/ina.12624.
- Kallinger, P., G. Steiner, and W. W. Szymanski. 2012. Characterization of four different bipolar charging devices for nanoparticle charge conditioning. J. Nanopart. Res. 14 (6):944. doi: 10.1007/s11051-012-0944-z.
- Kangasluoma, J., S. Hering, D. Picard, G. Lewis, J. Enroth, F. Korhonen, M. Kulmala, K. Sellegri, M. Attoui, and T. Petäjä. 2017. Characterization of three new condensation particle counters for sub-3 nm particle detection during the Helsinki CPC workshop: The ADI versatile water CPC, TSI 3777 nano enhancer and boosted TSI 3010. Atmos. Meas. Tech. 10 (6):2271–81. doi: 10.5194/amt-10-2271-2017.
- Katz, E. F., J. D. Goetz, C. Wang, J. L. Hart, B. Terranova, M. L. Taheri, M. S. Waring, and P. F. DeCarlo. 2020. Chemical and physical characterization of 3D printer aerosol emissions with and without a filter attachment. Environ. Sci. Technol. 54 (2):947–54. doi: 10.1021/acs.est.9b04012.
- Kim, Y., C. Yoon, S. Ham, J. Park, S. Kim, O. Kwon, and P.-J. Tsai. 2015. Emissions of nanoparticles and gaseous material from 3D printer operation. Environ. Sci. Technol. 49 (20):12044–53. doi: 10.1021/acs.est.5b02805.
- Kwon, O., C. Yoon, S. Ham, J. Park, J. Lee, D. Yoo, and Y. Kim. 2017. Characterization and control of nanoparticle emission during 3D printing. Environ. Sci. Technol. 51 (18):10357–68. doi: 10.1021/acs.est.7b01454.
- Lehtipalo, K., L. R. Ahonen, R. Baalbaki, J. Sulo, T. Chan, T. Laurila, L. Dada, J. Duplissy, E. Miettinen, J. Vanhanen, et al. 2022. The standard operating procedure for airmodus particle size magnifier and nano-condensation nucleus counter. J. Aerosol Sci. 159:105896. doi: 10.1016/j.jaerosci.2021.105896.
- Liu, Y., M. Attoui, K. Yang, J. Chen, Q. Li, and L. Wang. 2020. Size-resolved chemical composition analysis of ions produced by a commercial soft X-ray aerosol neutralizer. J. Aerosol Sci. 147:105586. doi: 10.1016/j.jaerosci.2020.105586.
- Liu, Y., M. Attoui, Y. Li, J. Chen, Q. Li, and L. Wang. 2022. Factors that govern sub-3 nm particle measurements in an Airmodus® P SM and a T SI® DEG–SMP S. Aerosol Sci. Technol. 56:883–92. doi: 10.1080/02786826.2022.2098686.
- Manninen, H. E., A. Franchin, S. Schobesberger, A. Hirsikko, J. Hakala, A. Skromulis, J. Kangasluoma, M. Ehn, H. Junninen, A. Mirme, et al. 2011. Characterisation of corona-generated ions used in a Neutral cluster and Air Ion Spectrometer (NAIS). Atmos. Meas. Tech. 4 (12):2767–76. doi: 10.5194/amt-4-2767-2011.
- Manoj, A., M. Bhuyan, S. R. Banik, and M. Ravi Sankar. 2021. Review on particle emissions during fused deposition modeling of acrylonitrile butadiene styrene and polylactic acid polymers. Mater. Today Proc. 44:1375–83. doi: 10.1016/j.matpr.2020.11.521.
- McDonnell, B., X. J. Guzman, M. Doblack, T. W. Simpson, and J. M. Cimbala. 2016. 3D printing in the wild: A preliminary, investigation of air quality in college maker spaces. In Proceedings of the 27th Annual International Solid Freeform Fabrication Symposium 2016, Austin, Texas, USA.
- Mendes, L., A. Kangas, K. Kukko, B. Mølgaard, A. Säämänen, T. Kanerva, I. Flores Ituarte, M. Huhtiniemi, H. Stockmann‐Juvala, J. Partanen, et al. 2017. Characterization of emissions from a desktop 3D printer. J. Ind Ecol 21 (S1):S94–S106. doi: 10.1111/jiec.12569.
- Oberdörster, G. 2000. Pulmonary effects of inhaled ultrafine particles. Int. Arch. Occup. Environ. Health 74:1–8. doi: 10.1007/s004200000185.
- Oberdörster, G., Z. Sharp, V. Atudorei, A. Elder, R. Gelein, W. Kreyling, and C. Cox. 2004. Translocation of inhaled ultrafine particles to the brain. Inhal. Toxicol. 16 (6-7):437–45. doi: 10.1080/08958370490439597.
- Poikkimäki, M., V. Koljonen, N. Leskinen, M. Närhi, O. Kangasniemi, O. Kausiala, and M. Dal Maso. 2019. Nanocluster aerosol emissions of a 3D printer. Environ. Sci. Technol. 53 (23):13618–28. doi: 10.1021/acs.est.9b05317.
- Romanowski, H., F. S. Bierkandt, A. Luch, and P. Laux. 2022. Summary and derived Risk Assessment of 3D printing emission studies. Atmos. Environ. 294:119501. doi: 10.1016/j.atmosenv.2022.119501.
- Saliakas, S., P. Karayannis, I. Kokkinopoulos, S. Damilos, E. Gkartzou, P. Zouboulis, A. Karatza, and E. P. Koumoulos. 2022. Fused filament fabrication 3D printing: Quantification of exposure to airborne particles. J. Compos. Sci. 6 (5):119. doi: 10.3390/jcs6050119.
- Secondo, L. E., H. I. Adawi, J. Cuddehe, K. Hopson, A. Schumacher, L. Mendoza, C. Cartin, and N. A. Lewinski. 2020. Comparative analysis of ventilation efficiency on ultrafine particle removal in university MakerSpaces. Atmos. Environ. (1994) 224:117321. doi: 10.1016/j.atmosenv.2020.117321.
- Seeger, S., D. Brödner, T. Jacobi, F. Rasch, M. Rothhardt, and O. Wilke. 2018. Emissions of fine and ultrafine particles and volatile organic compounds from different filament materials operated on a low-cost 3D printer. Gefahrst Reinhalt. Luft. 78:79–87.
- Sittichompoo, S., S. Kanagalingam, L. E. J. Thomas-Seale, A. Tsolakis, and J. M. Herreros. 2020. Characterization of particle emission from thermoplastic additive manufacturing. Atmos. Environ. 239:117765. doi: 10.1016/j.atmosenv.2020.117765.
- Stabile, L., M. Scungio, G. Buonanno, F. Arpino, and G. Ficco. 2017. Airborne particle emission of a commercial 3D printer: The effect of filament material and printing temperature. Indoor Air. 27 (2):398–408. doi: 10.1111/ina.12310.
- Stefaniak, A. B., L. N. Bowers, G. Cottrell, E. Erdem, A. K. Knepp, S. Martin, J. Pretty, M. G. Duling, E. D. Arnold, Z. Wilson, et al. 2021. Use of 3-Dimensional Printers in Educational Settings: The Need for Awareness of the Effects of Printer Temperature and Filament Type on Contaminant Releases. J. Chem. Health Saf. 28 (6):444–56. doi: 10.1021/acs.chas.1c00041.
- Stefaniak, A. B., R. F. LeBouf, M. G. Duling, J. Yi, A. B. Abukabda, C. R. McBride, and T. R. Nurkiewicz. 2017. Inhalation exposure to three-dimensional printer emissions stimulates acute hypertension and microvascular dysfunction. Toxicol. Appl. Pharmacol. 335:1–5. doi: 10.1016/j.taap.2017.09.016.
- Steiner, G. 2011. High resolution mobility spectrometry of molecular ions and their effect on the charging probabilities of airborne particles under bipolar diffusion charging conditions. PhD Diss., University of Vienna.
- Steinle, P. 2016. Characterization of emissions from a desktop 3D printer and indoor air measurements in office settings. J. Occup. Environ. Hyg. 13 (2):121–32. doi: 10.1080/15459624.2015.1091957.
- Stephens, B., P. Azimi, Z. El Orch, and T. Ramos. 2013. Ultrafine particle emissions from desktop 3D printers. Atmos. Environ. 79:334–9. doi: 10.1016/j.atmosenv.2013.06.050.
- Tang, C.-L., and S. Seeger. 2022. Systematic ranking of filaments regarding their particulate emissions during fused filament fabrication 3D printing by means of a proposed standard test method. Indoor Air. 32 (3):e13010. doi: 10.1111/ina.13010.
- Tang, C.-L., S. Seeger, and M. Röllig. 2023. Improving the comparability of FFF-3D printing emission data by adjustment of the set extruder temperature. Atmos. Environ. X 18:100217. doi: 10.1016/j.aeaoa.2023.100217.
- TSI Incorporated 2019. Diffusion correction using TSI's 1nm SMPSTM system model 3938 - application note SMPS-010 Rev. A-(A4). Accessed October 31, 2023. https://tsi.com/getmedia/f51452c9-3f02-4c2d-a8ff-24506d3534af/SMPS-010_Diffusion_Correction_using_1nm_SMPS_3938_App_Note_A4-web?ext=.pdf.
- TSI Incorporated 2023. Theory of operation nano enhancer model 3757 - application note 3757-001 Rev B A4. Accessed October 31, 2023. https://tsi.com/getmedia/51504b18-b6a4-447f-894c-b058eaee5703/3757_Nano_Enhancer_Theory_of_Op_3757-001_RevB_A4-web?ext=.pdf.
- Vance, M. E., V. Pegues, S. Van Montfrans, W. Leng, and L. C. Marr. 2017. Aerosol emissions from fuse-deposition modeling 3D printers in a chamber and in real indoor environments. Environ. Sci. Technol. 51 (17):9516–23. doi: 10.1021/acs.est.7b01546.
- Vanhanen, J., J. Mikkilä, K. Lehtipalo, M. Sipilä, H. E. Manninen, E. Siivola, T. Petäjä, and M. Kulmala. 2011. Particle Size Magnifier for Nano-CN Detection. Aerosol Sci. Technol. 45 (4):533–42. doi: 10.1080/02786826.2010.547889.
- Viitanen, A.-K., K. Kallonen, K. Kukko, T. Kanerva, E. Saukko, T. Hussein, K. Hämeri, and A. Säämänen. 2021. Technical control of nanoparticle emissions from desktop 3D printing. Indoor Air. 31 (4):1061–71. doi: 10.1111/ina.12791.
- Wiedensohler, A. 1988. An approximation of the bipolar charge distribution for particles in the submicron size range. J. Aerosol Sci. 19 (3):387–9. doi: 10.1016/0021-8502(88)90278-9.
- Winkler, P. M., G. Steiner, A. Vrtala, H. Vehkamäki, M. Noppel, K. E. J. Lehtinen, G. P. Reischl, P. E. Wagner, and M. Kulmala. 2008. Heterogeneous Nucleation Experiments Bridging the Scale from Molecular Ion Clusters to Nanoparticles. Science 319 (5868):1374–7. doi: 10.1126/science.1149034.
- Wlasits, P. J., D. Stolzenburg, C. Tauber, S. Brilke, S. H. Schmitt, P. M. Winkler, and D. Wimmer. 2020. Counting on chemistry: Laboratory evaluation of seed-material-dependent detection efficiencies of ultrafine condensation particle counters. Atmos. Meas. Tech. 13 (7):3787–98. doi: 10.5194/amt-13-3787-2020.
- Yi, J., R. F. LeBouf, M. G. Duling, T. Nurkiewicz, B. T. Chen, D. Schwegler-Berry, M. A. Virji, and A. B. Stefaniak. 2016. Emission of particulate matter from a desktop three-dimensional (3D) printer. J. Toxicol. Environ. Health. A 79 (11):453–65. doi: 10.1080/15287394.2016.1166467.
- Zhang, Q., M. Pardo, Y. Rudich, I. Kaplan-Ashiri, J. P. Wong, A. Y. Davis, M. S. Black, and R. J. Weber. 2019. Chemical composition and toxicity of particles emitted from a consumer-level 3D printer using various materials. Environ. Sci. Technol. 53 (20):12054–61. doi: 10.1021/acs.est.9b04168.
- Zhang, Q., J. P. S. Wong, A. Y. Davis, M. S. Black, and R. J. Weber. 2017. Characterization of particle emissions from consumer fused deposition modeling 3D printers. Aerosol Sci. Technol. 51 (11):1275–86. doi: 10.1080/02786826.2017.1342029.
- Zhou, Y., X. Kong, A. Chen, and S. Cao. 2015. Investigation of ultrafine particle emissions of desktop 3D printers in the clean room. Proc. Eng. 121:506–12. doi: 10.1016/j.proeng.2015.08.1099.