
 ?Mathematical formulae have been encoded as MathML and are displayed in this HTML version using MathJax in order to improve their display. Uncheck the box to turn MathJax off. This feature requires Javascript. Click on a formula to zoom.
ABSTRACT
Ensuring maritime safety has ascended as a preeminent concern within the global maritime sector. Understanding how factors affect maritime accidents’ consequences in different water areas would be of great benefit to preventing the occurrence or reducing the consequences. This study thus employed a multi-scale geographically weighted regression (MGWR) model on the accident dataset from Fujian waters in the East China Sea, to quantify the influences of different factors as well as the spatial heterogeneity in the effects of key factors on maritime accident consequence. The performances of MGWR are compared with multiple linear regression (MLR) and GWR. As expected, MGWR outperforms the other two models in terms of its ability to clearly capture the unobserved spatial heterogeneity in the effects of factors. Results reveal notably distinct influences of some factors on maritime accident consequences in different locations. An intuitive indication by MGWR is that approximately 50% of the accidents present positive coefficients of good visibility while other locations are negative, which are failed to recognize by MLR. The outcomes provide insights for making appropriate safety countermeasures and policies customized for different water areas.
1. Introduction
The shipping industry has been a catalyst for economic development and prosperity. Approximately 80% of global trade volume is seaborne (UNCTAD Citation2020). The increment of maritime transportation, on the one hand, could accelerate the production of air pollutants (Gao et al. Citation2023; Shuaian, Psaraftis, and Qi Citation2021). On the other hand, high maritime traffic volume also leads to a higher probability of marine accidents, which might cause catastrophic consequences such as property damage, fatality, and environmental pollution. EMSA (Citation2020) reported that there had been 21,392 ships involved in 19,418 casualties/incidents, with 496 fatalities and 6210 persons injured from 2014 to 2019. Maritime safety has attracted much attention in recent decades and how to enhance maritime safety remains a great concern of both maritime logistic operators and maritime managers (Xi et al. Citation2023; Yen et al. Citation2024; Shuli et al. Citation2024). For saving more lives and properties, academic researchers and practitioners have made considerable efforts to conduct maritime safety research (Luo and Shin Citation2019; L. Wang et al. Citation2021).
In order to effectively reduce the occurrence of maritime accidents and associated consequences, one of the cores is to interrogate and quantify the key factors of maritime accident rates and the severity of accidental consequences (B. Li et al. Citation2023). Previous studies have investigated maritime accidents and consequences from different aspects, such as injuries and casualties (e.g. Zheng et al. Citation2016), property damage cost (e.g. Weng, Yang, and Du Citation2018), accident probability (e.g. Fu et al. Citation2023; M. Zhang et al. Citation2021) and accident severity (e.g. H. Wang et al. Citation2021). Meanwhile, many approaches have been proposed to quantify the impacts of different factors on the investigated dependent variable, to name a few, fuzzy matter element methods (e.g. Chen et al. Citation2017), Poisson regression model (e.g. Yip, Jin, and Talley Citation2015), discrete choice model (e.g. Shi et al. Citation2021), zero-inflated models (e.g. Chai, Xiong, and Weng Citation2018). However, the studies mentioned above generally investigated maritime accidents from a global perspective.
In recent years, some other studies have started to focus on the spatial patterns of maritime accidents (e.g. M. Zhang et al. Citation2021; Zhou, Cheng, and Li Citation2020). For instance, Zhou, Cheng, and Li (Citation2020) mapped the maritime accident risk of the South China Sea, and Zhang et al. (Citation2021) studied the spatial patterns and characteristics of global maritime accidents. These studies imply that maritime accidents vary in spatial dimensions, but did not further investigate the influencing factors of the spatial patterns of maritime accidents. Namely, the influencing factors and their effect degree on maritime accidents are not comprehensively and quantitatively investigated based on adequate data. More importantly, the potential spatial heterogeneity in the effect of a factor on accident consequence is seldom explored. The spatial heterogeneity in the effect of a factor refers to distinct effects of a factor on the investigated dependent variable in different geographical locations (Gao et al. Citation2021). For instance, the wind may have different effects (e.g. degree of effect) on maritime accident consequences in different ocean areas. The potential spatial heterogeneity in the effects of a factor on maritime accident consequence matters in formulating safety improvement strategies. For a specific instance, if the strong wind has distinct degrees of effects on maritime accident consequences in different water areas, different thresholds should be used to determine risk warning or class in different areas, and more strong interventions should be adopted in areas where the strong wind has more notable effects. Hence, the existing limitations may result in inadequate understanding concerning significant factors affecting maritime accident consequences, and thus inefficient countermeasures to improve maritime system safety in different areas.
Standing on the wake of existing studies, this study aims to investigate and quantify the influences of various factors on consequences of accidents with specific considerations of spatial heterogeneity of maritime accidents. This targets to explore effective improvement countermeasures for the safety of maritime transportation systems. A dataset including 1248 maritime accident records and relevant environment information in the Fujian waters from 2000 to 2014 is used for analysis. The spatial pattern of the maritime accident is firstly analyzed using spatial Kernel Density Estimation (KDE). More importantly, the multi-scale geographically weighted regression (MGWR) is further utilized to investigate the key factors influencing maritime accident consequences (measured by overall economic losses considering all aspects) and the potential distinct effects of a factor in different water areas (i.e. spatial heterogeneity) with consideration of discrepancies in the spatial scales.
The remainder of this paper is organized as follows. Section 2 reviews the relevant literature and discusses the research gaps. Section 3 highlights the objective and contributions. Section 4 describes the used dataset in terms of study water area and data contents. Section 5 introduces the methodologies for analysis. Section 6 and 7 present the model results and discussions, respectively. Conclusions and future works are summarized in the last section.
2. Literature review
To reduce maritime accidents (e.g. occurrence likelihood and corresponding consequences), studies have been dedicated to analyzing maritime accidents from different angles and exploring potential implications for effective measures based on various data resources such as automatic identification system (AIS) data (Du et al. Citation2022), meteorological data (X. Li et al. Citation2022), simulation data, and maritime accident data (Goerlandt and Liu Citation2023). Among them, AIS data and simulation data are generally used in collision avoidance analysis and collision frequency estimation. Just to name a few, Altan and Otay (Citation2018) developed a collision model based on molecular collision theory and long-term AIS data as inputs to estimate and visualize the encounter probability in congested waterways. Ship density, relative velocity, and collision diameter were considered to be the critical factors that affected the encounter probability. Similarly, Szlapczynski and Szlapczynska (Citation2021) developed a near-miss detection method for collision alert systems based on ship domain theory and verified the model with simulation data from three scenarios.
Another stream of studies is to leverage maritime accident databases for analysis. Various studies have been carried out to evaluate injury/loss of human life or property damage cost for different ship types and water areas, investigate influencing factors and thus seek efficient measures for preventing similar accidents from occurring in the future. Jin (Citation2014) estimated vessel damage severity and crew injury severity of fishing vessel accidents using the ordered probit model. Seven types of explanatory variables, including accident type, vessel characteristics, propulsion type, hull construction type, weather condition, spatial information, and time of accidents, were considered in this paper. Yip, Jin, and Talley (Citation2015) explored the determinants of injuries in passenger vessel accidents using Poisson regressions and empirical data on ferry, ocean cruise, and river cruise vessel accidents from the U.S. Coast Guard. The model considered the majority of influencing factors as well. The results indicated that the number of passenger injuries was positively related to the number of crew injuries. Weng, Yang, and Du (Citation2018) developed a generalized F-distribution model with random parameters to estimate the property damage costs in maritime accidents. Random parameters were considered to represent the changeable effects of variables on different observations. Four types of variables, including accident characteristics, ship types, environmental characteristics, and human causal factors, were considered in their study. Based on the worldwide accident investigation reports from 2010 to 2019, Wang et al. (Citation2021) applied an ordered logistic regression model to reflect the relationship between different factors and the severity of marine accidents. Furthermore, Çakır, Fışkın, and Sevgili (Citation2021) utilized various association rule mining algorithms to investigate the factors affecting tugboat accidents by analyzing the tugboat accident dataset from the Information Handling Services (IHS) Sea-Web database. It was found that serious maritime accidents were related to hull/machinery damage.
Although the aforementioned studies have investigated the relationship between some influencing factors and consequences of maritime accidents such as human injury/loss and property damage cost, they have only focused on modeling partial factors due to data limitations and a part of the accident consequences (e.g. only estimate fatality loss or property damage cost). Moreover, the modeling methods in existing literature generally assume the influences of a factor are global in different geographical locations, and neglect the potential spatial heterogeneity in the effects of an influencing factor on maritime accident consequences. The effects of some influencing factors may show distinct effects on the maritime accident consequence in different water areas. Investigation regarding the potential spatial heterogeneity in effects of factors is important for making tailored safety improvement measures for different areas. For instance, if a factor has much more noticeable impacts in some water areas, more intense regulations for alleviating the effects of this factor should be imposed to ensure safety in such areas as compared to other water areas. However, the potential spatial heterogeneity in the effects of factors is overlooked in the majority of prior studies and has never been explored in the area of maritime accident analysis, to our best knowledge. Although Jin (Citation2014) had considered the spatial information during the model evaluation, they only added a spatial variable (distance to shore) in the model formulation, which can hardly model the spatial heterogeneity in the effects of a factor on maritime accidents.
3. Objective and contributions
Benefiting from advances in information and communication technology, maritime accident data with geographic information become available. Such data is helpful to explore the potential spatial heterogeneity of maritime accidents. However, according to the literature review, less efforts have been made to make full use of the geographic information. The primary purpose of this paper is thus to exploit accident locations to explore the distinguished impacts of influencing factors in different geographical areas. The main contributions of this study are two-fold:
To the best of our knowledge, this is the first attempt to investigate the spatial heterogeneity in modeling quantitative relation among influencing factors of accidents, which provides valuable assessments of how GWR series models performed in quantitative analysis of maritime accidents.
The results contribute to the comprehension of the accident consequences from a spatial perspective and are beneficial for excavating practical implications. More specifically, the study results are helpful in establishing differential safety strategies, as well as other hints such as differential insurance rates in different water areas.
These tailored safety improvement strategies and measures in different water areas eventually could help to prevent more maritime accidents from happening and to expedite the safety of maritime transportation.
4. Data description
The main principle for our case selection is to find water area with high research value and high data quality. In this study, we select Fujian Province, an important coastal province in the East China Sea, for case study considering its strategic importance, fast growth maritime traffic, and weather-related risks. Fujian contains a large jurisdictional water area of 136 thousand km2, mainly managed by the authorities of six major coastal cities, including Ningde, Fuzhou, Putian, Quanzhou, Xiamen, and Zhangzhou, as seen in . Fujian takes an important position in international trades and covers vital shipping routes between the South China Sea and the East China Sea. The coastline in Fujian is 3752 kilometers long, with the highest coastal meander rate (1:7.01) in China. Meanwhile, Fujian is also prone to typhoons and adverse weather conditions, which leads to significant risks of maritime accidents.
Figure 1. The study water area (21°35’ − 27°43’ N and 115°7’ − 125°33’ E) and locations of recorded maritime accidents.
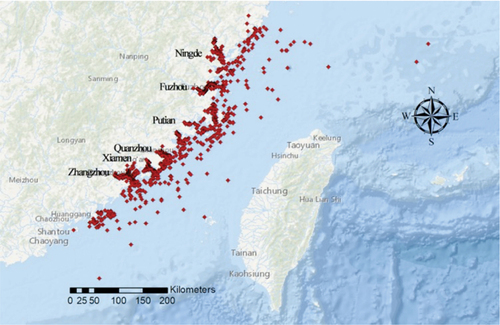
This study utilizes maritime accident data in the study area provided by Fujian Maritime Safety Administration (FSA). The provided accident data is in the format of dataframe. Each row represents an accident while each column represents a variable of this accident. We originally collected 1264 maritime accident cases from 2000 to 2014, which quality are generally reliable after a careful review. Several cases missing critical information (e.g. accident causes, geographic information) were discarded before further analysis. The final used dataset contains 1248 completed cases. According to the recorded longitude and latitude information, the spatial distribution of the accidents can be seen in .
The large quantity of data highlights the uniqueness of the data and guarantees the representativeness of exploring significant factors of maritime accidents. The maritime accident consequence, the dependent variable in this study, refers to the overall economic cost of the accident reported by the authority considering all aspects such as injured or death/missing crews and property damage cost. In the dataset, the economic loss from maritime accidents ranged from 2,000 to 32 million CNY (1 CNY0.137 USD). Moreover, the dataset also includes various potential factors that may influence accident consequences and can be summarized into four categories, including accident types, ship information, environmental characteristics, and reported accident causes. The reported accident causes refer to the reported causes that potentially led to the accidents in the accident report recorded by the authorities. More specifically, the dataset covers seven types of accidents. Ship information consists of types, gross tonnage, and navigational status of the ships. Environmental characteristics contain accident time of the day, visibility condition, and strong wind/wave or typhoon. Reported accident causes include judgment error, lookout failure, misoperation, and machinery failure refer to the common factors leading to accidents. tabulates the detailed statistical descriptions concerning the influencing factors mentioned above.
Table 1. Descriptive statistics of the maritime accident characteristics in the Fujian water area.
It is worth clarifying that many explanatory variables in our dataset are coded as categorical variables rather than continuous variables. This is a common case in the relevant literature of using accident datasets (Weng, Yang, and Du Citation2018; Çakır, Fışkın, and Sevgili Citation2021). The reason is that those are all available information compiled in accident reports by the management authority, who did not record exact values of some factors such as the value of wind speed during the accident. The dependent variable (accident consequence) and the factor (gross tonnage) are continuous variables and standardized to eliminate the effects of different units of the two factors.
5. Methodology
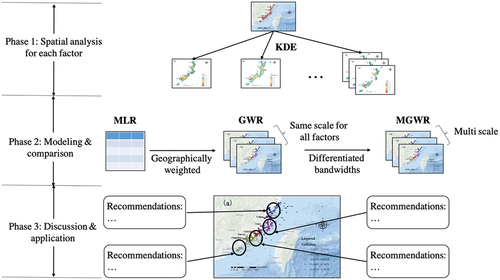
Although traditional GWR can effectively handle spatial heterogeneity in maritime accident studies, it relies on a single kernel bandwidth for model calibration and cannot capture the diverse geographic processes occurring at various scales, potentially leading to over- or underestimations of the true relationships among factors. MGWR is selected in this study to compensate for this deficiency. To clarify the process, a flowchart is illustrated in . First, spatial analysis for each influencing factor of maritime accident was conducted based on KDE. Subsequently, three models were established respectively for the selected maritime accident dataset, after which the performance of the MGWR model were compared with those of the other two models. Finally, the results of the MGWR model were discussed and applied to provide safety strategy support for different water areas.
Figure 2. Flowchart of methodology.
5.1. Spatial correlation analysis
For investigating spatial heterogeneity in the effects of influencing factors, it is vital to check the potential correlations in spatial dimensions (Gao et al. Citation2021). More specifically, if a factor does not present spatial correlations at all, it is not necessary to use methods like GWR to investigate the influences of different factors on maritime accident consequences. This study selected the global Moran’s I index to measure the potential spatial autocorrelation of a factor. Moran’s I coefficient (Moran Citation1950) is one of the most widely used measures for detecting spatial autocorrelation. The equation for the Moran’s I is
where n is the number of observations, x represents the variable of interest, is the average value of the variable, p and q denote the location indices, wpq represents the matrix of spatial weights given by a selected geographical criterion with diagonal elements equal to zero (i.e. wpp = 0). The weight matrix used in this study is mentioned in subsection 5.3. The value of the Moran’ I index ranged from − 1 to + 1. A larger value indicates a higher degree of spatial clustering, while a lower value indicates a higher degree of spatial dispersion. We calculated the global Moran’s I index for all the variables, as shown in . Eight of the variables show significant spatial correlation with 95% confidence levels. Other variables present less obvious spatial relationships or less significant spatial correlations. The large differences of the Moran’s I index among different variables indicate that there may exist significant variances in spatial correlation or dispersion of these variables. As far as we are concerned, the degree to which variables are aggregate or discrete may affect bandwidth selection during the GWR modeling process. Therefore, it is reasonable to consider bandwidth variations in analysis to obtain more accurate modeling using MGWR.
5.2. Multiple linear regression
As a baseline method, a multiple linear regression (MLR) is used preliminarily to model the relationship between the maritime accident consequence and available explanatory factors. The aim is to preliminarily check the important factors of maritime accident consequences. The MLR model is formulated as
where yi represents the consequence of maritime accident i and is measured by the overall economic loss of the accident; xij is the jth explanatory variable of accident i, stands for the corresponding coefficient of the jth explanatory variable while
is intercept term;
is the random error term and follows normal distributions with an average of zero. As indicated by EquationEquation (2)
(2)
(2) , MLR assumes the effect of a factor to be global across all data points in the dataset. Therefore, the estimated coefficient of a factor reflects the global average effect of a factor on maritime accident consequences.
5.3. Multi-scale geographically weighted regression
Geographically weighted regression (GWR), as a spatial regression technique, is widely employed to investigate spatially nonstationary relationships (Gao et al. Citation2021). Leveraging the locally weighted least square method, GWR is capable of incorporating location information of the samples into the modeling process so that it can produce exclusive coefficients for different sample points. This enables GWR to consider the spatial effects of independent variables and analyze the differences in the effects of a factor across different locations (i.e. spatial heterogeneity in the effects of a factor). The formulation of GWR is
where (ui, vi) represents the location of the accident i. Other coefficients have same meanings as they are in EquationEquation (2)(2)
(2) . The locally weighted least square minimization is used to estimate
based on available data and can be expressed as
where wi (ui, vi) denotes the spatial weight at location (ui, vi). The coefficients can be estimated by
The location-specific coefficient allows the relationship between a factor and maritime accident consequences to vary across different water areas. More clearly, a specific coefficient of a factor is estimated for each data point (Ziakopoulos and Yannis Citation2020). One key component in EquationEquation (5)
(5)
(5) is determining the spatial weight matrix, which is generally negatively related to the distance between locations. We adopt an adaptive bi-square kernel function as the distance-weighting function referring to literature (Fotheringham, Yang, and Kang Citation2017).
where wpq represents the weight between accident location p and accident location q; dpq is the distance between p and q; b is a critical distance from location p to its Mth nearest neighbor. M is the optimal number of nearest neighbors, namely the bandwidth of the model, which is determined by minimizing the corrected Akaike Information Criterion (AICc). A larger bandwidth implies a smaller spatial heterogeneity (Fotheringham, Yang, and Kang Citation2017). The goodness-of-fit measure AICc is defined by
where represents the estimated standard deviation of the error term while tr(S) is the trace of the hat matrix S. It should be noted that the bandwidths of GWR are assumed to be the same for all influencing factors. This is a relatively strong assumption as the bandwidth of different factors (namely, the area of spatial clustering) may vary with each other. The bandwidths of different influencing factors are rarely the same on the spatial dimension. Hence, it is necessary to consider more specific variations of bandwidths for different influencing factors in spatial analysis, which is not fully concerned with the aforementioned GWR. For a specific example, the bandwidth of modeling the effect of visibility may differ from that of modeling the influences of wind. Due to the limitations of the classic GWR model, several alternatives have been utilized to further improve GWR in this aspect, such as semi-parametric GWR (SGWR) and multi-scale GWR (MGWR) models. SGWR roughly divides bandwidths into two broad categories (i.e. local and global) to further consider varying bandwidths. Alternatively, we leverage the multi-scale geographically weighted regression to address the aforenoted limitations. MGWR is a frontier extension methodology, which allows bandwidth differentiation for different influencing factors (Oshan et al. Citation2019). In contrast, MGWR proves to be a more accurate and credible model than GWR by relaxing the assumption of fixed bandwidths for all the influencing factors. The formula of MGWR is
where refers to the coefficient of the jth factor with selecting the optimal bandwidth of the factor also by the bi-square kernel function and the AICc mentioned in GWR (Oshan et al. Citation2019). Different bandwidths required by MGWR imply that each relationship between the dependent variable and a specific explanatory variable should have different spatial weighting matrices. Thus, the traditional estimator used by GWR (i.e. weighted least square) is not applicable in MGWR. MGWR embeds different computational processes to operate at different spatial scales by deriving separate bandwidths for the conditional relationships. A back-fitting algorithm proposed by Fotheringham, Yang, and Kang (Citation2017) is utilized to estimate the MGWR approach, where GWR estimated coefficients are treated as initial values in the back-fitting process. All the local coefficients and the optimal bandwidths are evaluated during each iteration. Iteration terminates once the score of change from successive iterations converges to a specified threshold. The residual sum of squares (RSS) is adopted as the convergence criterion for the back-fitting algorithm, and the score of change SOCRSS is calculated by
where RSSnew refers to the residual sum of squares calculated in the current step, while RSSold denotes the residual sum of squares calculated in the last step.
6. Results
6.1. Spatial pattern analysis results
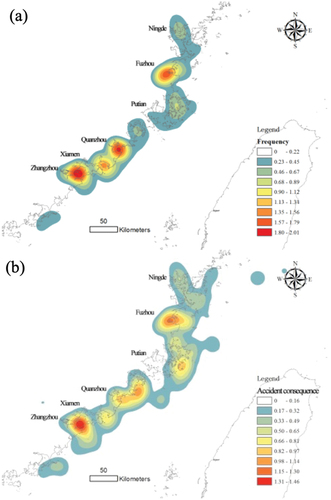
To explore the spatial pattern of the maritime accident risks, the spatial distributions of accident frequency and accident consequence (overall reported economic loss) are modeled using KDE. The main factors that affect KDE results are the kernel function and search radius. The most common used kernel function, the inverse distance function, was applied for our estimation (Y. Zhang et al. Citation2021). The search radius mainly affects the smoothness of the results. It should be note that the proper setting is highly related to the scale of the specific case. Therefore, this study calculated multiple KDE results with different parameter settings for better visualization. Finally, the KDE results are divided into nine classes and the search radius is set to 0.25.
exhibit the distribution of the maritime accident frequency and consequence, respectively. The redder color indicates higher density, namely a higher frequency or consequence of maritime accidents in that water area. As seen in , coastal port waters under the jurisdiction of Xiamen-Zhangzhou, Quanzhou, Fuzhou are found to be associated with higher accident frequency, consistent with the spatial distribution of accident consequence shown in . The general accident spatial pattern we got in this paper aligns with the analysis from Yang et al. (Citation2022), which is a positive sign for our further study. KDE results considering each influencing factor in this study are also presented in the appendix to show the detailed spatial distributions of accidents with different characteristics. Specifically, the water area between Zhangzhou and Xiamen manifests the highest densities of collisions and fire/explosions, as shown in . Contact, striking rocks, grounding, and other accident types occurred more frequently around Quanzhou waters. This may be attributed to the lower water depth and the complex hydrological environment in this water. Interestingly, the area with the largest density of striking rocks is in Putian waters. Consistent with the reality, Putian coastal water area shows complex terrain with numerous reefs and rocks, which highly increase the operation difficulty of ships in avoiding hitting rocks. The water area around Fuzhou is the region with the highest density of sinking/capsizing accidents. In addition, the majority of accidents involving large ships occurred in water areas between Zhangzhou and Xiamen, as shown in .
Figure 3. Heat map for the maritime accidents in Fujian water area: (a) accident frequency; (b) accident consequence.
The results of different ship types present significantly different spatial distributions, as shown in . Maritime accidents involving dry cargo ships happened more frequently around Quanzhou and Fuzhou waters. Accidents involving liquid cargo ships were more frequently seen in Zhangzhou waters and Xiamen waters. Fishing ship accidents show a widespread distribution in the Fujian water area, which were mainly concentrated in southern Zhangzhou waters and the junction of Xiamen waters and Zhangzhou waters. From , it is concluded that fewer accidents involving other types of ships had occurred in the Fujian water area. There was only one red area appears in the waters between Zhangzhou and Xiamen. In addition, four factors about accident cause present similar spatial. Judgment error exhibits a higher density nearby Quanzhou waters, compared with the other three accident cause factors. The spatial pattern of navigational status is similar to that of accident frequency. As to the four environmental factors, the water areas with the highest densities are Fuzhou waters for the time of the day, waters between Zhangzhou and Xiamen for visibility, Xiamen waters for the typhoon, and Quanzhou waters for strong wind/wave.
Overall, these results show significant spatial differences in the accident consequence as well as in the potential influencing factors, which proves the arguments highlighted by previous studies (Yildiz et al. Citation2022; M. Zhang et al. Citation2021). More importantly, this phenomenon implies the need of investigating the influencing factors of maritime accident frequency to reveal potential underlying reasons. It indicates that the differences in the influencing factors in different spatial dimensions may lead to the difference in accident consequence of different water areas. This motivates us to use methods such as MGWR for investigating the effects of influencing factors on maritime accident consequences.
6.2. Model comparison
We compare the fitness performances of the adopted three regression models to find the best one. The variance inflation factors (VIFs) for each variable are checked before modeling to avoid multicollinearity issues. Finally, 19 explanatory variables with the VIFs lower than 4.5 remain in the model estimation process and are used for result interpretations, in case of multicollinearity. presents the model performances of the three models in terms of R-Squared, AICc, log-likelihood, and RSS. Consistent with other studies that applied geographical weighted models, our MGWR model for maritime accident analysis provides more superior performances as compared to the other two models (Fotheringham, Yang, and Kang Citation2017). Specifically, the R-Squared of MGWR (0.465) is 95% and 161% higher than that of GWR (0.238) and MLR (0.178), respectively. Overall, MLR without considering the effect of spatial heterogeneity in the effects of influencing factors have poor fitness performances, indicating inefficient interpretability of MLR on our data. The MGWR model takes into consideration of the distinct effects of influencing factors in different spatial areas and also varying bandwidths on the dependent variable, and thus provides the best model fit. The results about AICs, log-likelihood, and RSS corroborate the superiority of MGWR in contrast to the MLR and GWR. Further, global Moran’s I statistics of the residuals from the three models are also given in . The Moran’s I index from the MGWR model is furthermore seen to be lower than that from the GWR model, suggesting that the MGWR model specification is more potent in filtering spatial autocorrelation.
Table 2. Comparison of the performance of the three models.
One advantage of MGWR as compared to the conventional GWR is that this model could accept multi-scales in geographical analysis and recognize the possible differences of spatial heterogeneity among variables simultaneously. More technically, the bandwidth in the modeling process of MGWR is varying for different variables rather than constant in spatial dimensions as the conventional GWR does. summarizes the results about the bandwidths of variables during the modeling. It can be easily seen that all variables in GWR have the same bandwidth or spatial scale in modeling, as the conventional GWR assumes homogeneous bandwidths for all variables. Specifically, the bandwidth (i.e. spatial scale) of GWR is 792, accounting for 63.5% of the observations. In contrast, the MGWR results show significant differences in bandwidths among different variables, which range from 50 to 1246. According to the results, seven influencing factors including sinking/capsizing, liquid cargo ships, gross tonnage, time of the day, visibility, strong wind/wave, and lookout failure show quite low bandwidths, which implies that the effects of these factors on the accident consequence show noticeable distinctions in different areas. However, the other twelve factors have bandwidths of nearly 1246, which indicates the effects of these factors do not present considerable spatial heterogeneity and thus can be treated as global-scale variables in the analysis.
Table 3. Results of the three models.
6.3. Spatial heterogeneities in effects of key factors
On account of the superior performances of MGWR and identified spatial heterogeneities in effects of different factors on maritime accident consequence, we will mainly discuss the results of MGWR for interpretations and analysis. The statistical description of the coefficient of each factor is summarized in . The mean value of a factor in the results of MGWR reflect the average effect of the factor. From , each influencing factor presents significantly different coefficients in different water areas according to the results of MGWR, indicating that the influence of each variable varies greatly in different locations. Note that the estimated coefficients may not directly interpret the impacts, we also calculate the marginal effects of each variable, which allows us to understand the direct effects that changes in regressors have on our dependent variable, namely the economic loss. The distribution of marginal effects can be found in It can be seen that ‘gross tonnage,’ ‘sinking/capsizing,’ and ‘good visibility’ are the top three variables with the greatest variation of impact on economic loss across different waters. ‘liquid cargo ship,’ ‘time of the day,’ and ‘lookout failure’ also show significant differences on marginal effects. The remaining variables may have similar impact on economic loss in different waters.
Table 4. Summary statistics for MGWR parameter estimates.
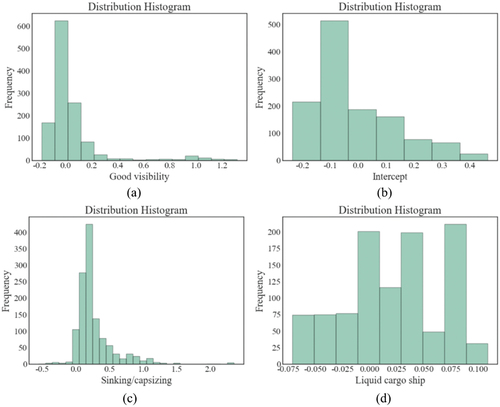
To further explore the distribution of the coefficients with significant variance, bar charts for some representative variables are created in . As shown in , the coefficient of ‘good visibility’ (ranging from −0.2 to 1.2) has positive influences on the consequence of maritime accidents in approximately 50% of the studied areas but negative influences in other locations. However, MLR only presents a negligible and insignificant coefficient for the factor (i.e. 0.037 in ), which may be attributed to the variations in the effects of the factor in different areas (i.e. spatial heterogeneity of the effect). Although sinking/capsizing and liquid cargo ships show strong positive relationships with accident consequence in MLR, the negative influences of the two variables in some locations should not be ignored as well, as shown in . Overall, models without considering the significant spatial heterogeneity in the effects of factors such as MLR only present the average effect of a factor. These flaws may result in considerable biases and thus incorrect findings. In contrast, MGWR can provide more comprehensive results with considerations of spatial heterogeneity in the effect of each factor.
Figure 4. Coefficient distributions of influencing factors estimated by MGWR.
The following contents further discuss the influences of different factors on maritime accident consequence, and practical implications based on the results of MGWR. The parameter estimates in MGWR were mapped with natural breaks criteria, as depicted in and . The five colors from light yellow to dark blue exhibit the values of coefficients, which deeper colors indicate a larger positive effect.
Figure 5. (Continued).
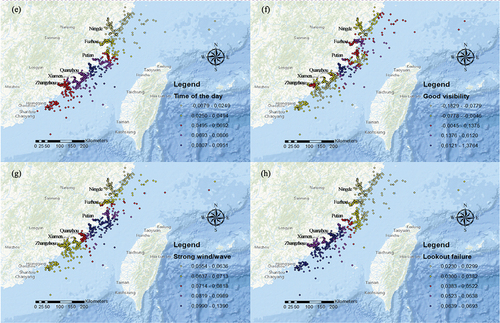
Figure 6. (Continued).
The effect of ‘sinking/capsizing’ is positive in most locations and follows a relatively random pattern along the coastal waters, as shown in . However, accident location far from coastline normally presents a coefficient of higher than 0.370, indicating that the occurrence of sinking/capsizing accidents at these locations has much more serious consequences. Sinking/capsizing shows the highest impact in the coastal waters near Quanzhou (i.e. 0.783–2.361), while the accidence frequency of sinking/capsizing accidents is relatively low in this water area, as evidenced by . Consistent with Yang et al. (Citation2022), the results indicate that this water area has a higher probability of occurring catastrophic sinking/capsizing accidents even though the accident number is not large.
It can be seen from that ‘liquid cargo ship involved’ shows lower negative influences on maritime accident consequence in Putian and Quanzhou waters. However, interestingly, the large positive coefficients of ‘liquid cargo ship involved’ are mainly distributed in coastal waters near Ningde Xiamen and Zhangzhou. This phenomenon may be attributed to the higher risk of the hazmat carried by the liquid cargo ships. Accident involving liquid cargo ships tends to associate with larger consequences (Eliopoulou and Papanikolaou Citation2007). Therefore, the higher coefficients of ‘liquid cargo ship involved’ are mainly distributed in coastal waters with higher ship
Figure 5. Spatial heterogeneity in the effects of micro-scale factors on maritime accidents.
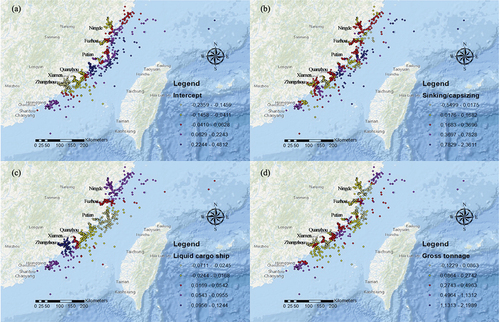
density rather than in waters far from the coastline. As for ‘gross tonnage,’ negative coefficients mainly appear in southern Ningde, Fuzhou-Putian and Xiamen-Zhangzhou waters, while positive coefficients are mainly in northern Ningde, Quanzhou, and southern Zhangzhou waters, as shown in . The difference may be ascribed to the higher density of fishing ships in these water areas. The accident consequence involving fishing ships may be more sensitive to the gross tonnage of the ships due to the relatively poor safety level of fishing ships.
With regard to the environmental characteristics, ‘time of the day’ from shows larger positive coefficients in the southern Fujian waters, especially in the water area such as Putian and Quanzhou waters. This demonstrates that maritime accidents in these waters at night could lead to more serious consequences as compared to other areas. The reason may be explained by the fact that these waters are not equipped with adequate navigation marks (i.e. light buoy, light beacon and lighthouse). Furthermore, Putian waters have occurred plenty of striking rock accidents due to the complex hydrogeological environment, which could also increase the difficulty of navigating at night. From , a significant spatial heterogeneity can be observed in the coefficient of ‘good visibility,’ which shows the highest level of effects (i.e. 0.612–1.376) in the Putian-Quanzhou waters. Furthermore, ‘good visibility’ also shows higher effects near Fuzhou waters (i.e. 0.138–0.612), while presents negative effects (i.e. −0.183 - −0.005) in Zhangzhou waters, Xiamen waters, and Ningde waters. Apart from the relatively harsh navigational conditions in Putian waters and Fuzhou waters, the higher influence of visibility may also be affected by the climate in these water
areas. In all the Fujian water areas, ‘strong wind/wave’ shows positive influences on accident consequences that are more notable those in the water area of Putian and Quanzhou, as shown in . Over the past 70 years, more than 60% of the typhoons have made landfalls pass through these waters (Su et al. Citation2023). Therefore, the significant influences of ‘strong wind/waves’ in the middle of the Fujian water area may be attributed to the high frequency of typhoon attacks in these waters. As shown in , ‘lookout failure’ has positive influences in Fujian waters and is more remarkable in the south of Quanzhou waters. As mentioned before, these waters contain more fishing activities and thus result in more accidents involving fishing ships. Crews on fishing ships are normally lacking safety awareness and professional skills since these seafarers are not compulsory to have a license or other mariner credential, as evidenced by previous studies (G. Li, Weng, and Hou Citation2021).
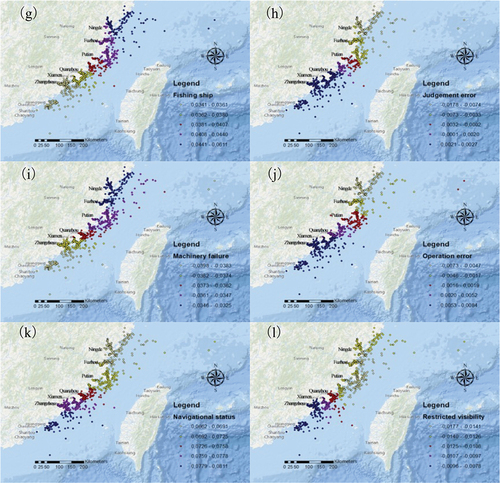
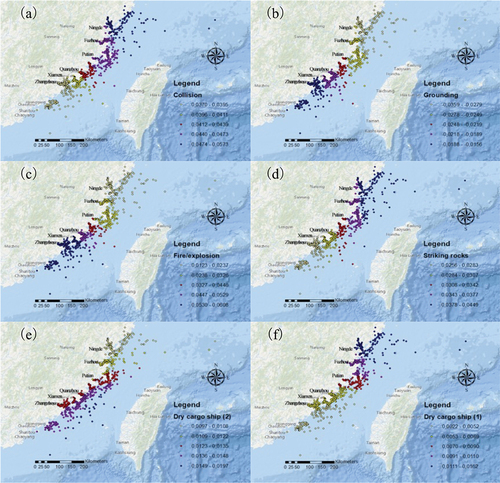
presents results about global-scale factors, namely the factors with a bandwidth of 1246. imply that ‘collision’ and ‘fire/explosion’ show positive coefficients on maritime accident consequence throughout the Fujian water area, while ‘grounding’ presents slightly negative effects, which is consistent with previous studies (Weng, Yang, and Du Citation2018). Specifically, collision accidents exhibit relatively larger influences in the northern Fujian waters. Maritime accidents involving fishing ships () could lead to more serious consequences in Fujian waters. Moreover, the influences of ‘fishing ships’ are more notable in the northern part of Fujian water areas. The higher influences of ‘fishing ships’ may be explained by the fact that these water areas exist more intensive fishing activities, as partly evidenced by . As for the accident cause factors shown in , ‘judgment error’ and ‘operation error’ show negligible effects among the Fujian waters. Interestingly, ‘machinery failure’ has negative influences in all the Fujian waters, which may be ascribed to the lower sailing speed after machinery failure. Furthermore, ships occurring machinery failure usually have enough rescue time to avoid serious consequences. ‘Navigational status’ presents similar effects (i.e. 0.066–0.081) in the Fujian water area, as shown in . ‘Restricted visibility’ shows negative effects on maritime accident consequence throughout the Fujian water area. This may be due to the fact that ships are generally sailing slower under restricted visibility (Fu et al. Citation2023).
Figure 6. Spatial heterogeneity in the effects of global-scale factors on maritime accident consequence.
7. Discussions
Maritime accidents are complex events influenced by a combination of factors related to seafarers, vessel characteristics, and especially external circumstances. The meteorological and hydrological properties of the oceans, as well as ship type distribution, are highly spatially heterogeneous, which differentiates the influence mechanisms of accident consequences in different water areas. One contribution of our study is that we found significant discrepancies in the effects of key factors of maritime accident consequences in different water areas, which could not be modelled in other traditional models. Furthermore, considering spatial scale variation between different factors makes the model results more reliable, because the influencing zones of factors on maritime accident consequences indeed varies. Aforenoted results indicate that the MGWR model is more effective and reliable when modeling the influencing factors of maritime accidents with geographical information.
Specifically, compared with the traditional econometric models, MGWR model has much better modeling accuracy (Fotheringham, Yang, and Kang Citation2017). This suggests that the MGWR model has a great potential to help maritime authorities accurately investigate the factors of maritime accidents in different water areas. According to the noticeable challenges identified from the results, customized strategies and policies can be proposed for different water areas by local maritime authorities and agencies:
With regard to reducing the probability of striking rock accidents in rocks/reef-intensive waters (i.e. in the north of Putian waters), it is suggested to enhance navigation aids (e.g. set up more navigation marks) and pay more attention to monitoring ship activities in these waters through closed-circuit television (CCTV) systems. Navigation marks enable ships to find out obstacles easily, especially when ships sail under poor visibility or at night (Chai, Xiong, and Weng Citation2018).
In the central Fujian waters with higher typhoon frequency, more effective weather monitoring and early warning systems should be put in place to reduce maritime accidents caused by adverse weather conditions.
For water areas with more intensive fishing activities (i.e. Zhangzhou waters and northern Ningde waters), more coast guard ships should be arranged to these waters (Yang et al. Citation2022). Ensuring that fishermen receive adequate training and education on safety at sea is also essential.
Serious maritime accidents involving liquid cargo ships are normally distributed near port waters. On one hand, ports in Fujian waters should be adequately equipped with fire-fighting facilities to respond to fires/explosions caused by liquid cargo ship accidents. On the other hand, reducing the consequence of liquid cargo ship accidents should mainly focus on strengthening the emergency plan of the ship (Eliopoulou and Papanikolaou Citation2007).
As for waters far from the coastline, the maritime search and rescue operations should be further improved (e.g. fully mobilizing nearby ships to the accident waters for rescue) to minimize rescue response time so that can reduce the consequence of accidents occurred in these waters as much as possible (Zhou, Cheng, and Li Citation2020).
8. Conclusions
The key factors of maritime accident consequences have not been comprehensively investigated, especially from a spatial perspective based on adequate maritime accident data. This study aims to fill up the gaps in relevant research by quantitatively analyzing key contributors to maritime accident consequences with special emphasis on spatial heterogeneity. Importantly, this study considers the spatial variation with multiple scales in the effects of key factors leveraging the rigorous MGWR, which is ignored by the traditional spatial econometric models such as GWR. An empirical analysis of using MGWR for analysis is presented based on maritime accident data in the East China Sea. The main findings can be summarized as follows:
The results from KDE and global Moran’s I index indicate notable spatial heterogeneity in the accident sites and in the values of influencing factors. These results imply the necessity of analyzing key factors of maritime accidents consequences.
Multi-scale geographically weighted regression presents much more fitness superiority in modeling influences of different factors on maritime accident consequence due to its merits of considering spatial and multiple-scale variations among the variables, as compared to conventional multiple linear regression and geographically weighted regression. MGWR model can properly consider different bandwidths for different variables in spatial analysis and thus appropriately reveal the different spatial heterogeneity in the effects of a factor on maritime accident consequences.
The results identify the key determinants of maritime accident consequences. From the global perspective, MGWR results show that sinking/capsizing, liquid cargo ship, and gross tonnage tend to be the most critical factors of all, which is consistent with the findings from MLR.
Results reveal notably distinct influences of a factor on maritime accidence consequence in different areas, namely spatial heterogeneity. Some factors even present inverse influences in different water areas on maritime accident consequences such as sinking/capsizing, visibility, and time of the day. The results hint the necessity to take the spatial and multi-scale variations of influences of factors to properly decipher their influences on maritime accident consequences.
Overall, the findings of this study provide convincible evidence that maritime authorities should consider implementing differential policies in different water areas to further reduce the occurrence of accidents and corresponding consequences. Specific policy development can consider the hydrogeological conditions of local waters, vessel traffic flow, as well as the analysis of historical accidents. In addition, with the latest information as input, strategies of emergency resource allocation could also be optimized in accordance with economic loss predictions for different water areas based on our proposed model.
However, there are still several aspects that could be further extended. First of all, we used econometric modeling for analysis as most relevant literature did, and thus cannot directly reveal causality of the mentioned factors with maritime accident consequences. It is always a dilemma in transport safety analysis that a strong relationship does not necessarily mean causality. Further efforts are needed to investigate causality with great caution. In addition, these models are used more as an exploratory tool instead of a predictive tool. Therefore, in our future works, we will explore the possibility of using more advanced geographically weighted machine learning methods to deal with these flaws. Moreover, our case study only considers information from maritime accident data. The summary consequences and frequencies of maritime accidents in different water areas may be affected by ship traffic density, water depth, and so on. In the future, more comprehensive information collected from AIS data, meteorological data, and hydrological data should be merged to investigate the relationship between navigational risk and various influencing factors. It is also interesting to explore the relationship between distance function (i.e. a continuous relationship of the cumulative percentages of accidents with corresponding distances to the coastline) of maritime accidents and corresponding influencing factors. Besides, our case study mainly focuses on a common water area in the East China Sea. Maritime accidents in larger water areas (e.g. whole Chinese/Asian territory waters) with different meteorological and hydrological characteristics are worth investigating as well.
Disclosure statement
No potential conflict of interest was reported by the author(s).
Additional information
Funding
References
- Altan, Y. C., and E. N. Otay. 2018. “Spatial Mapping of Encounter Probability in Congested Waterways Using AIS.” Ocean Engineering 164:263–271. https://doi.org/10.1016/j.oceaneng.2018.06.049.
- Çakır, E., R. Fışkın, and C. Sevgili. 2021. “Investigation of Tugboat Accidents Severity: An Application of Association Rule Mining Algorithms.” Reliability Engineering and System Safety 209:107470. https://doi.org/10.1016/j.ress.2021.107470.
- Chai, T., D.-Q. Xiong, and J. Weng. 2018. “A zero-inflated negative binomial regression model to evaluate ship sinking accident mortalities.” Transportation Research Record 2672 (11): 65–72. https://doi.org/10.1177/0361198118787388.
- Chen, J., F. Zhang, C. Yang, C. Zhang, and L. Luo. 2017. “Factor and Trend Analysis of Total-Loss Marine Casualty Using a Fuzzy Matter Element Method.” International Journal of Disaster Risk Reduction 24:383–390. https://doi.org/10.1016/j.ijdrr.2017.07.001.
- Du, Y., Y. Chen, X. Li, A. Schönborn, and Z. Sun. 2022. “Data Fusion and Machine Learning for Ship Fuel Efficiency Modeling: Part II–Voyage Report Data, AIS Data and Meteorological Data.” Communications in Transportation Research 2:100073. https://doi.org/10.1016/j.commtr.2022.100074.
- Eliopoulou, E., and A. Papanikolaou. 2007. “Casualty Analysis of Large Tankers.” Journal of Marine Science and Technology 12 (4): 240–250. https://doi.org/10.1007/s00773-007-0255-8.
- EMSA (European Maritime Safety Agency) 2020. “Annual Overview of Marine Casualties and Incidents 2020.” http://emsa.europa.eu/csn-menu/items.html?cid=14&id=4266.
- Fotheringham, A. S., W. Yang, and W. Kang. 2017. “Multiscale Geographically Weighted Regression (MGWR).” Annals of the American Association of Geographers 107 (6): 1247–1265. https://doi.org/10.1080/24694452.2017.1352480.
- Fu, S., Y. Zhang, M. Zhang, B. Han, and Z. Wu. 2023. “An Object-Oriented Bayesian Network Model for the Quantitative Risk Assessment of Navigational Accidents in Ice-Covered Arctic Waters.” Reliability Engineering and System Safety 238:109459. https://doi.org/10.1016/j.ress.2023.109459.
- Gao, K., A. Li, Y. Liu, J. Gil, and Y. Bie. 2023. “Unraveling the Mode Substitution of Dockless Bike-Sharing Systems and Its Determinants: A Trip Level Data-Driven Interpretation.” Sustainable Cities and Society 98:104820. https://doi.org/10.1016/j.scs.2023.104820.
- Gao, K., Y. Yang, A. Li, and X. Qu. 2021. “Spatial Heterogeneity in Distance Decay of Using Bike Sharing: An Empirical Large-Scale Analysis in Shanghai.” Transportation Research Part D: Transport & Environment 94:102814. https://doi.org/10.1016/j.trd.2021.102814.
- Goerlandt, F., and H. Liu. 2023. “Readability of Maritime Accident Reports: A Comparative Analysis.” Maritime Policy & Management 1–13. https://doi.org/10.1080/03088839.2023.2166685.
- Jin, D. 2014. “The Determinants of Fishing Vessel Accident Severity.” Accident Analysis & Prevention 66:1–7. https://doi.org/10.1016/j.aap.2014.01.001.
- Li, X., Y. Du, Y. Chen, S. Nguyen, W. Zhang, A. Schönborn, and Z. Sun. 2022. “Data Fusion and Machine Learning for Ship Fuel Efficiency Modeling: Part I–Voyage Report Data and Meteorological Data.” Communications in Transportation Research 2:100074. https://doi.org/10.1016/j.commtr.2022.100074.
- Li, B., J. Lu, H. Lu, and J. Li. 2023. “Predicting Maritime Accident Consequence Scenarios for Emergency Response Decisions Using Optimization-Based Decision Tree Approach.” Maritime Policy & Management 50 (1): 19–41. https://doi.org/10.1080/03088839.2021.1959074.
- Li, G., J. Weng, and Z. Hou. 2021. “Impact Analysis of External Factors on Human Errors Using the ARBN Method Based on Small-Sample Ship Collision Records.” Ocean Engineering 236:109533. https://doi.org/10.1016/j.oceaneng.2021.109533.
- Luo, M., and S.-H. Shin. 2019. “Half-Century Research Developments in Maritime Accidents: Future Directions.” Accident Analysis & Prevention 123:448–460. https://doi.org/10.1016/j.aap.2016.04.010.
- Moran, P. A. 1950. “Notes on Continuous Stochastic Phenomena.” Biometrika 37 (1/2): 17–23. https://doi.org/10.2307/2332142.
- Oshan, T. M., Z. Li, W. Kang, L. J. Wolf, and A. Stewart Fotheringham. 2019. “Mgwr: A Python Implementation of Multiscale Geographically Weighted Regression for Investigating Process Spatial Heterogeneity and Scale.” ISPRS International Journal of Geo-Information 8 (6): 269. https://doi.org/10.3390/ijgi8060269.
- Shi, X., Z. Wang, X. Li, and M. Pei. 2021. “The Effect of Ride Experience on Changing Opinions Toward Autonomous Vehicle Safety.” Communications in Transportation Research 1:100003. https://doi.org/10.1016/j.commtr.2021.100003.
- Shuaian, W., H. N. Psaraftis, and J. Qi. 2021. “Paradox of International Maritime organization’s Carbon Intensity Indicator.” Communications in Transportation Research 1:100005. https://doi.org/10.1016/j.commtr.2021.100005.
- Shuli, W., K. Gao, L. Zhang, B. Yu, and S. M. Easa. 2024. “Geographically Weighted Machine Learning for Modeling Spatial Heterogeneity in Traffic Crash Frequency and Determinants in US.” Accident Analysis & Prevention 199:107528. https://doi.org/10.1016/j.aap.2024.107528.
- Su, Z., Y. Ma, L. Jia, F. Ren, and C. Ding. 2023. “Application of the Improved Dynamical–Statistical–Analog Ensemble Forecast Model for Landfalling Typhoon Precipitation in Fujian Province.” Frontiers in Earth Science 10:1018851. https://doi.org/10.3389/feart.2022.1018851.
- Szlapczynski, R., and J. Szlapczynska. 2021. “A Ship Domain-Based Model of Collision Risk for Near-Miss Detection and Collision Alert Systems.” Reliability Engineering and System Safety 214:107766. https://doi.org/10.1016/j.ress.2021.107766.
- UNCTAD (United Nations Conference on Trade and Development) 2020. Review of Maritime Transport 2020. United Nations publication. Sales no. E.20.II.D.31.
- Wang, H., Z. Liu, X. Wang, T. Graham, and J. Wang. 2021. “An Analysis of Factors Affecting the Severity of Marine Accidents.” Reliability Engineering and System Safety 210:107513. https://doi.org/10.1016/j.ress.2021.107513.
- Wang, L., J. Wang, M. Shi, S. Fu, and M. Zhu. 2021. “Critical Risk Factors in Ship Fire Accidents.” Maritime Policy & Management 48 (6): 895–913. https://doi.org/10.1080/03088839.2020.1821110.
- Weng, J., D. Yang, and G. Du. 2018. “Generalized F Distribution Model with Random Parameters for Estimating Property Damage Cost in Maritime Accidents.” Maritime Policy & Management 45 (8): 963–978. https://doi.org/10.1080/03088839.2018.1475760.
- Xi, Y., S. Hu, Z. Yang, S. Fu, and J. Weng. 2023. “Analysis of Safety Climate Effect on Individual Safety Consciousness Creation and Safety Behaviour Improvement in Shipping Operations.” Maritime Policy & Management 50 (7): 941–956. https://doi.org/10.1080/03088839.2022.2059718.
- Yang, Y., Z. Shao, Y. Hu, Q. Mei, J. Pan, R. Song, and P. Wang. 2022. “Geographical Spatial Analysis and Risk Prediction Based on Machine Learning for Maritime Traffic Accidents: A Case Study of Fujian Sea Area.” Ocean Engineering 266:113106. https://doi.org/10.1016/j.oceaneng.2022.113106.
- Yen, C.-D., S.-W. Hsu, K.-D. Ye, K.-C. Shang, and C.-H. Wu. 2024. “A Safety Compliance Model for Container Terminal Operations: The Roles of the Safety Climate, Non-Compliance Cost and Safety Self-Efficacy.” Maritime Policy & Management 51 (1): 118–132. https://doi.org/10.1080/03088839.2022.2089754.
- Yildiz, S., F. Tonoğlu, Ö. Uğurlu, S. Loughney, and J. Wang. 2022. “Spatial and Statistical Analysis of Operational Conditions Contributing to Marine Accidents in the Singapore Strait.” Journal of Marine Science and Engineering 10 (12): 2001. https://doi.org/10.3390/jmse10122001.
- Yip, T. L., D. Jin, and W. K. Talley. 2015. “Determinants of Injuries in Passenger Vessel Accidents.” Accident Analysis & Prevention 82:112–117. https://doi.org/10.1016/j.aap.2015.05.025.
- Zhang, M., F. Conti, H. Le Sourne, D. Vassalos, P. Kujala, D. Lindroth, and S. Hirdaris. 2021. “A Method for the Direct Assessment of Ship Collision Damage and Flooding Risk in Real Conditions.” Ocean Engineering 237:109605. https://doi.org/10.1016/j.oceaneng.2021.109605.
- Zhang, Y., X. Sun, J. Chen, and C. Cheng. 2021. “Spatial Patterns and Characteristics of Global Maritime Accidents.” Reliability Engineering and System Safety 206:107310. https://doi.org/10.1016/j.ress.2020.107310.
- Zheng, Y., W. K. Talley, D. Jin, and M. Ng. 2016. “Crew injuries in container vessel accidents.” Maritime Policy & Management 43 (5): 541–551. https://doi.org/10.1080/03088839.2016.1150610.
- Zhou, X., L. Cheng, and M. Li. 2020. “Assessing and Mapping Maritime Transportation Risk Based on Spatial Fuzzy Multi-Criteria Decision Making: A Case Study in the South China Sea.” Ocean Engineering 208:107403. https://doi.org/10.1016/j.oceaneng.2020.107403.
- Ziakopoulos, A., and G. Yannis. 2020. “A Review of Spatial Approaches in Road Safety.” Accident Analysis & Prevention 135:105323. https://doi.org/10.1016/j.aap.2019.105323.
Appendices
Figure A1. Heat maps for the maritime accident variables based on KDE.
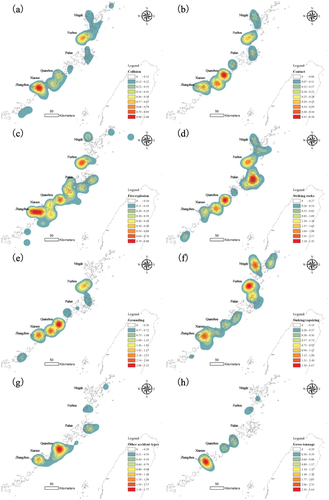
Figure A1. (Continued).
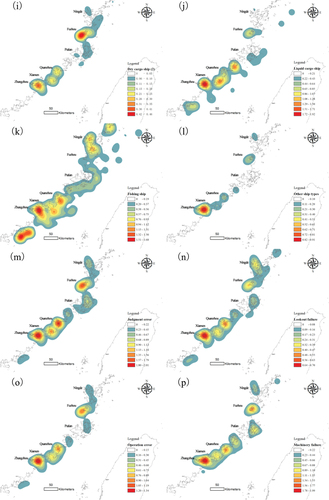
Figure A1. (Continued).
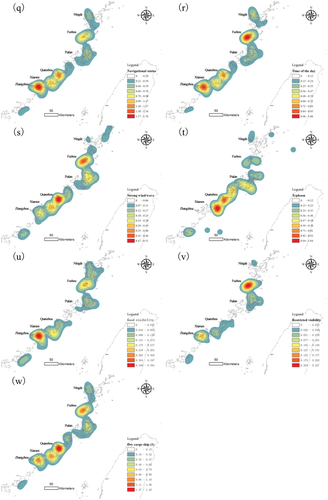
Figure A2. Boxplot for marginal effects of MGWR results (outliers are excluded).
Table A1. Nomenclature.