
Abstract
Drug metabolism is one of the critical determinants of drug disposition throughout the body. While traditionally associated with the liver, recent research has unveiled the presence and functional significance of drug-metabolizing enzymes (DMEs) within the brain. Specifically, cytochrome P-450 enzymes (CYPs) and UDP-glucuronosyltransferases (UGTs) enzymes have emerged as key players in drug biotransformation within the central nervous system (CNS). This comprehensive review explores the cellular and subcellular distribution of CYPs and UGTs within the CNS, emphasizing regional expression and contrasting profiles between the liver and brain, humans and rats. Moreover, we discuss the impact of species and sex differences on CYPs and UGTs within the CNS. This review also provides an overview of methodologies for identifying and quantifying enzyme activities in the brain. Additionally, we present factors influencing CYPs and UGTs activities in the brain, including genetic polymorphisms, physiological variables, pathophysiological conditions, and environmental factors. Examples of CYP- and UGT-mediated drug metabolism within the brain are presented at the end, illustrating the pivotal role of these enzymes in drug therapy and potential toxicity. In conclusion, this review enhances our understanding of drug metabolism’s significance in the brain, with a specific focus on CYPs and UGTs. Insights into the expression, activity, and influential factors of these enzymes within the CNS have crucial implications for drug development, the design of safe drug treatment strategies, and the comprehension of drug actions within the CNS. To that end, CNS pharmacokinetic (PK) models can be improved to further advance drug development and personalized therapy.
1. Introduction
Metabolism plays a pivotal role in the fate of drugs, influencing their disposition throughout the body, and therewith target site exposure and effects. This predominantly occurs in the liver, but it can also take place in extrahepatic organs (Thelen and Dressman Citation2009; Knights et al. Citation2013; Gundert-Remy et al. Citation2014), including the brain (Miksys SL and Tyndale Citation2002; Pavek and Dvorak Citation2008). Brain metabolism holds significant importance in understanding the pharmacokinetics (PK) and effects of central nervous system (CNS) acting drugs (Dutheil et al. Citation2008). The human brain, characterized by its heightened energy consumption compared to other organs, exhibits a substantial demand for metabolic processes (Magistretti and Allaman Citation2015). In cases where plasma levels fail to predict drug response, apart from blood–brain barrier (BBB) transport, cerebral metabolic conversions may serve as a contributing factor exerting influence on drug effects (Miksys S and Tyndale Citation2013). So far, our understanding of drug metabolism in the CNS is limited. Literature indicates the presence in the CNS of cytochrome P-450 enzymes (CYPs) (Miksys SL and Tyndale Citation2002; Miksys S and Tyndale Citation2013), UDP-glucuronosyltransferases (UGTs) (Buckley and Klaassen Citation2007; Court et al. Citation2012; Chik et al. Citation2022) and various other drug-metabolizing enzymes (DMEs) (Sheng et al. Citation2021), suggesting their potential significance and functional role within the CNS.
DMEs orchestrate the transformation of drugs and endogenous compounds into metabolites that can be easily eliminated. These enzymes facilitate the conversion of hydrophobic substances into more hydrophilic forms, enabling their excretion through urine or bile (Jancova et al. Citation2010; Ouzzine et al. Citation2014) and resulting in detoxication, in general (Dutheil et al. Citation2008). Within the brain, the proper functioning of DMEs on endogenous compounds is crucial for maintaining homeostasis (Dutheil et al. Citation2008) and safeguarding against the potential accumulation of toxic compounds. Among the diverse arrays of DMEs, CYPs and UGTs have been attracted for scientists due to their superfamily structure (Sychev et al. Citation2018), wide range of metabolic substrates (Kumar Citation2010; Decleves et al. Citation2011; Fanni et al. Citation2021) and also genetic polymorphism (Jancova et al. Citation2010; Niwa et al. Citation2018).
DMEs are classified as phase I enzymes or phase II enzymes based on substrate, activity, and sequence in the metabolic pathway (Swinney et al. Citation2006). CYP enzymes belonging to the phase I metabolism group, catalyze oxidation, reduction, and hydrolysis reactions (Oliw and Oates Citation1981). It was reported that there are 57 CYP isoforms in human (Sychev et al. Citation2018). However, only a subset (∼15) of these CYP enzymes has been identified as influential in drug metabolism (Isin and Guengerich Citation2007; Brodie et al. Citation2013; Ghosh et al. Citation2016). Notably, CYP1A2, CYP3A4/5, CYP2C9, CYP2C19, CYP2D6, and CYP2E1 are considered the primary CYPs responsible for metabolizing most clinical drugs (Bibi Citation2008; Sychev et al. Citation2018). Similarly, UGTs, classified under phase II metabolism, play a vital role in drug biotransformation within the brain. UGTs are key enzymes involved in conjugation reactions (Kaur et al. Citation2020), with 19 extensively characterized UGT proteins in humans (Jancova et al. Citation2010). In brain, UGTs are actively involved in protecting tissue from potentially harmful lipophilic substances by converting them into less harmful hydrophilic glucuronides. Typically, these metabolites are inactive, except some glucuronides, such as morphine-6-glucuronide, which have significant pharmacological activity (Ouzzine et al. Citation2014). UGT1A, UGT2A, and UGT2B are subfamilies within the UGT superfamily that exhibit high activity in drug biotransformation (Ouzzine et al. Citation2014).
The structural and functional characteristics of CYPs and UGTs make them particularly interesting to study. Their involvement in the metabolism of many clinical drugs highlights their importance in determining drug efficacy, safety, and potential adverse effects (Issa et al. Citation2017). Understanding the presence, distribution, function, and interactions (with drugs, environmental factors, and others) of these DMEs within the CNS provides valuable insights into drug exposure at the target site and its subsequent pharmacological and toxicological consequences. This has important implications for the development of safer and more effective drug treatment strategies for the CNS. Moreover, with the development of science and technology, more and more pharmacological models are also involved in different stages of drug development, like population pharmacokinetic (Pop PK) modeling and physiologically based pharmacokinetic (PBPK) modeling, which accelerates the process of drug development and helps to understand the mechanism of drug action (van den Brink et al. Citation2017; Saleh et al. Citation2021). The understanding of the expression, activity, and influencing factors of DMEs in CNS is also of positive significance for the development of pharmacological models.
In this review, we provide a comprehensive overview of the significance of drug metabolism in the brain, with a particular focus on CYPs and UGTs. We will elucidate the presence, distribution, species, and sex differences of these enzymes (Section 2), the usual methods for measuring enzyme expression and activity (Section 3), factors that affect individual variability (Section 4) and brain metabolism examples (Section 5), emphasizing their role in the biotransformation of drugs. By synthesizing existing knowledge, we strive to deepen our understanding of the role of DMEs within the CNS and elucidate their impact on drug therapy, CNS drug action, and potential toxicity.
2. CYP and UGT enzymes in the CNS
CYPs and UGTs, do not display a homogeneous distribution in the CNS (Dutheil et al. Citation2008), no matter in sub- and cellular distributions or in regional distributions.
2.1. Cellular and subcellular distribution of CYPs and UGTs
The distribution of CYP enzymes and UGT enzymes within the CNS is heterogeneous. In particular, CYPs are unevenly expressed across specific cell types (Miksys S, Hoffmann, et al. Citation2000), specifically neuronal cells, suggesting their potential effects in the brain (Dutheil et al. Citation2008). CYP3A, CYP2D, CYP2E, CYP2B, CYP1A, CYP46A1, and CYP2C enzymes are predominantly located in neurons and astrocytes (McMillan DM and Tyndale Citation2018), while UGTs, such as UGT1A and UGT2B, are predominantly found in astrocytes and brain endothelial cells (Ouzzine et al. Citation2014). Therefore, one of the key role of UGTs is acting as a detoxication barrier in brains (Ouzzine et al. Citation2014). Some DMEs in the brain exhibit particularly prominent cellular specificity, like CYP2D6 (McMillan D Citation2018). In the human brain, CYP2D6 is predominantly expressed in pyramidal neurons, granular cells, Purkinje and glial cells (Siegle et al. Citation2001; Miksys S et al. Citation2002). In rats, strong immunoreactivity of CYP2D has been observed in various cell types, including pyramidal neurons, neurons, Purkinje cells, glial cells, and endothelial cells (Norris et al. Citation1996; Miksys S, Rao, et al. Citation2000; Miksys SL et al. Citation2005). Besides, a review by Ghosh et al. suggests that CYP3A4 may be expressed in epithelial cells and neurons within the human brain (Ghosh et al. Citation2016).
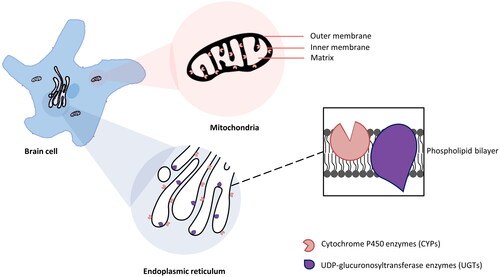
Both CYPs and UGTs are membrane-bound enzymes and mainly intracellularly expressed (Zhang et al. Citation2016; Šrejber et al. Citation2018). CYP enzymes in liver cells are typically located in the endoplasmic reticulum (ER) or microsomal cell fraction (Dutheil et al. Citation2008). Their distribution in brain cells, however, is more diverse (Dutheil et al. Citation2008). They are found in the cytoplasmic side of ER (Zhang et al. Citation2016), inner membrane of mitochondria (Walther et al. Citation1986), outer surface of plasma membrane (Šrejber et al. Citation2018), and other cell organelle membranes (McMillan DM and Tyndale Citation2018; Song et al. Citation2021). However, the ER and mitochondrial inner membrane are the main locations among these (Walther et al. Citation1986; Šrejber et al. Citation2018). For instance, CYP1A1, CYP1A2 (Dutheil et al. Citation2008), CYP1B1, CYP2A6 (Dutheil et al. Citation2008), CYP2D6, CYP2E1 (Dutheil et al. Citation2008), CYP2J2, CYP2U1, and CYP46A1 have been observed in the mitochondrial and microsomal fractions of neurons and glial cells in various brain regions (Dutheil et al. Citation2009). In general, UGTs are predominantly located on the ER in both brain cells (Ouzzine et al. Citation2014) and liver cells (Liu Y and Coughtrie Citation2017; Kiiski et al. Citation2021), with their substrate binding sites exposed to the luminal side (Jancova et al. Citation2010). Based on the specificity of their expression sites on ER (UGTs on the luminal side, CYPs on the cytoplasmic side), it is reasonable to speculate they have functional correlation. Indeed, research has shown that UGTs can metabolize functional groups added by CYP enzymes to drug molecules (Kaur et al. Citation2020). The interactions and intra-membrane co-localization of CYPs and UGTs ensure an effective stepwise drug biotransformation (Ouzzine et al. Citation2014). specifies the main locations of CYPs and UGTs in the brain cell.
Figure 1. The majority subcellular locations of CYPs and UGTs in brain cell. The expression of CYPs was detected on the plasma membrane, but mainly in the cytoplasmic side of ER (Zhang et al. Citation2016) and the inner membrane of the mitochondria (Walther et al. Citation1986). However, the substrate binding sites are deeply buried in the phospholipid bilayer membranes (Šrejber et al. Citation2018). UGTs are predominantly located on the luminal side of the ER (Ouzzine et al. Citation2014).
To summarize, CYP and UGT enzymes exhibit differential cellular and subcellular distribution within the CNS. The subcellular localization of CYPs and UGTs in brain cells further highlights their functional significance in drug metabolism.
2.2. Regional distribution of CYP and UGTs
The distribution of DMEs in the brain is not uniform and varies across CNS anatomical regions. These variations arise due to differences in cell types, cell density, and functions within the brain (Ghersi-Egea et al. Citation1994; Miksys S, Rao, et al. Citation2000; Miksys SL and Tyndale Citation2002; Ghosh et al. Citation2016). In general, drug metabolism occurs at the BBB (Eyal et al. Citation2009; De Gregori et al. Citation2012), blood–cerebral–spinal fluid barrier (BCSFB) (Eyal et al. Citation2009; Wang Q and Zuo Citation2018), and within the brain itself (Minn et al. Citation1991; Agarwal et al. Citation2008; Fanni et al. Citation2021). From the literature on DMEs in the brain, we summarized two lists of major types of DMEs in human, rat, and mouse brains regions ( and ) presenting the heterogeneous distributions of CYPs and UGTs in different brain regions.
Table 1. Distribution of major CYP family DMEs in different regions and cell types in human, rat, and mouse brains rat, mouse and human CYPs that are present in several distinct brain localizations.
Table 2. Distribution of major UGT family DMEs in different regions and cell types in human, rat, and mouse brains rat, mouse and human UGT DMEs that are present in several distinct brain localizations.
2.2.1. CYP isoforms
The distribution of CYPs within specific brain regions is of particular interest. CYP enzymes exhibit distinct patterns of distribution across different regions of the brain, like in , reflecting the regional variations in drug metabolism and response. In general, the cortex, hippocampus, cerebellum, substantia nigra, basal ganglia, medulla oblongata, and pons are the major brain regions where CYP enzymes are predominantly found (Dutheil et al. Citation2008). Studies have shown that the highest total content of CYP enzymes in the human brain is observed in the cerebellum and brain stem, while the hippocampus and striatum exhibit relatively lowest levels (Bhamre et al. Citation1992; Tirumalai et al. Citation1998). CYP1B1, CYP2D6, and CYP2E1 are the major CYP enzymes expressed in brain microvasculature (Dauchy et al. Citation2008).
However, it is important to note that discrepancies exist in the reported data on CYP expression within specific brain regions. For instance, studies investigating the presence of specific CYP isoforms in the brain have yielded conflicting results. Some studies have reported the absence of Cyp1a2 mRNA in the cortex, hippocampus and cerebellum of rats (Schilter and Omiecinski Citation1993; Stamou et al. Citation2014), while another study detected the presence of CYP1A2 protein in the cortex and cerebellum (Iba et al. Citation2003). Similar inconsistencies have been observed regarding the expression of CYP2B1 and CYP2B2. Schilter and Omiecinski detected their presence in the rat cerebellum and cortex at the mRNA level (Schilter and Omiecinski Citation1993), while Miksys et al. found CYP2B1 protein in rat cortex and hippocampus (Miksys S, Hoffmann, et al. Citation2000), and Stamou et al. reported the absence of Cyp2b1 and 2b2 mRNA in the rat cortex, hippocampus, and cerebellum (Stamou et al. Citation2014). Furthermore, contrasting findings have emerged regarding the expression of CYP2D6 in human and rat brains. McFadyen et al. reported that CYP2D6 RNA was only expressed in the midbrain of the human brain (McFadyen et al. Citation1998). In contrast, the Human Protein Atlas database indicated its RNA expression was also present in the medulla oblongata (Sjöstedt et al. Citation2020), consistent with the findings of Siegle et al. (Citation2001), but contradicting the report by Dutheil et al. (Citation2008). Notably, in protein levels, CYP2D6 is predominantly detected in the cerebral cortex, the hippocampus, cerebellum (Siegle et al. Citation2001; Miksys S et al. Citation2002). Similarly, in rat brains, CYP2D exhibited robust immunoreactivity in the neocortex, substantia nigra, cerebellum, olfactory bulb and pons, and choroid plexus (Norris et al. Citation1996; Miksys S, Rao, et al. Citation2000; Miksys SL et al. Citation2005). CYP2D6 is human only enzyme in the brain. Instead, six genes (Cyp2d1-5 and Cyp2d18) have been identified in the rat brain (Gonzalez et al. Citation1987; Matsunaga et al. Citation1990; Nelson et al. Citation1993; Kawashima et al. Citation1996; Miksys S, Rao, et al. Citation2000). One article claimed that only Cyp2d1, 2d5, and 2d4 mRNAs were detected in rat brain (Tyndale et al. Citation1999). However, another article claimed that only CYP2D2 and CYP2D5 were found in the substantia nigra of the adult rat brain, while CYP2D1, 2D3, 2D4, and 2D5 were found in the fetal rat immunoreactivity (Gilbert et al. Citation2003). Apart from CYP2D6, inconsistencies have also been observed in studies examining CYP3A5. McFadyen et al. detected the expression of CYP3A5 mRNA in the midbrain of the human brain, but not in the cortex, pons, medulla oblongata, or cerebellum (McFadyen et al. Citation1998), which is in complete contrast to the information in the Human Protein Atlas database (Sjöstedt et al. Citation2020). The presence or absence of these isoforms in specific brain regions has been reported differently across studies.
2.2.2. UGT isoforms
Like CYPs, UGTs are expressed at varying levels in different brain regions, like in , including isoforms from the 1A, 2A, 2B, and 3A families. In the brain, UGTs predominantly expressed the BBB, where they serve as a detoxification or metabolic barrier (Engelhardt and Sorokin Citation2009; Ouzzine et al. Citation2014). UGTs are also present in neuro-olfactory tissues, the pineal gland, the circumventricular organ, and the pituitary gland, which are the brain interfaces devoid of the BBB (Ouzzine et al. Citation2014).
Like for CYPs, the expression of UGTs in the brain remains inconsistent across studies (Zhang et al. Citation2016). For instance, Ohno and Nakajin reported the only presence of UGT1A5 and UGT2B17 in the human brain (Ohno and Nakajin Citation2009), while Court et al. detected UGT1A1, 1A3, 1A4, 1A6, 1A7, 1A10, 2B7, and 2B17 in fetal brain samples and UGT1A4, 1A6, and 2B7 in adult brain samples (Court et al. Citation2012). Furthermore, Court et al. and Wahlström et al. observed variability in the presence of UGT1A10 (Court et al. Citation2012) and UGT2B7 (Wahlström et al. Citation1988) respectively across different brain samples. This could be due to inter-individual differences or the degradation of the enzyme over time in the sample storage.
Discrepancies between studies and the Human Protein Atlas database (Sjöstedt et al. Citation2020) are also evident for UGT1A3, UGT1A4, UGT1A10, and UGT2B17 in terms of their mRNA expression in the human brain. UGT1A3, 1A4, 1A10, and 2B17 mRNA are absent in Human Protein Atlas database (Sjöstedt et al. Citation2020), but UGT1A3 was detected in the study of Kutsuno et al. (Citation2015) study and UGT1A4, 1A10, and 2B17 were found in the study of Court et al. (Citation2012).
In mouse brain samples, Chen et al. reported the presence of UGT2B5 protein (Chen J et al. Citation2017), contradicting the information in the NCBI gene database (Sayers et al. Citation2022). Similarly, Ugt2b7 mRNA was detected in rat brain according to the NCBI gene database (Yu Y et al. Citation2014). However, another scientist Suleman et al. failed to detect UGT2B7 activity in rat basal layer (Suleman et al. Citation1993). This may because of the nonlinear relationship between mRNA and protein. Moreover, UGT2B7 mRNA was found in the human cerebellum but not in the cerebral cortex (King et al. Citation1999), which is not consistent with the data reported in Human Protein Atlas (Sjöstedt et al. Citation2020). In another experiment conducted by Wahlström et al., morphine glucuronidation activity was identified in three out of 19 human brain samples (Wahlström et al. Citation1988), indicating individual variations in the expression of UGT2B7 protein in the human brain. Moreover, Yueh et al. demonstrated through experimental results in a transgenic mouse model of human UGT2B7 that the brain exhibited a lower degree of activity and differential expression (Yueh et al. Citation2011).
In summary, although the regional distribution of CYP and UGT enzymes in the brain has been extensively investigated, discrepancies between studies have also been found. These discrepancies may be attributed to individual, sex, racial, or environmental differences of samples, variations in experimental techniques, and the high homology between different subfamily isoforms, which can make their distinction challenging (Miksys SL and Tyndale Citation2002; Dutheil et al. Citation2008). For example, the cellular specificity of nicotine-induced CYP2D6 was evident in the cerebellum, where CYP2D6 was increased in Purkinje cells but not in cells of the molecular or granular layers (Ferguson and Tyndale Citation2011), consistent with higher staining levels in human Purkinje cells in smokers compared to nonsmokers (Ferguson and Tyndale Citation2011). More factors that could affect the enzyme expression and activities are described in Section 3 ‘Factors that affect CYP and UGT activities in the brain’.
Besides, only a limited number of UGT isoforms are expressed in the mammalian and human brain, with selective expression patterns observed in different brain regions. The inconsistencies in CYP and UGT expression across studies and the presence of inter-individual differences underscore the complexity of CYP- and UGT-mediated metabolism in the brain. Absolute quantification of DMEs in the brain, both at the mRNA and protein levels, is scarce. Further research utilizing rigorous methodologies and comprehensive analyses is needed to elucidate the precise expression patterns, functional roles, and substrate specificities of CYP and UGT enzymes in specific brain regions.
2.3. Differential expression: contrasting liver and brain
Certain neurons within the brain exhibit comparable or even higher expression levels of CYP enzymes when compared to hepatocytes, likely due to distinct cellular organization and function (Miksys S, Hoffmann, et al. Citation2000). Dutheil et al. conducted an mRNA quantification analysis of CYP enzymes and revealed that CYP1B1, CYP2D6, CYP2E1, CYP2J2, CYP2U1, and CYP46A1 accounted for over 90% of all P450s at the mRNA level and exhibited selective distribution in various human brain regions (Dutheil et al. Citation2009). Although the relatively modest expression levels of these enzymes in brain regions may have minimal impact on system metabolism of drugs, brain CYP localized to specific regions and cell types may have considerable effects on the metabolism of certain brain microenvironments and the brain as a whole (Britto and Wedlund Citation1992; Ferguson and Tyndale Citation2011; Ouzzine et al. Citation2014). For example, when treated under the same conditions as liver sections, nicotine-induced CYP2B expression in rat frontal cortical neurons appeared to exceed that in hepatocytes (Miksys S, Hoffmann, et al. Citation2000; Ferguson and Tyndale Citation2011). Furthermore, it is noteworthy that the expression levels of CYPs in specific neurons can be equally or even more significant than those observed in hepatocytes, such as CYP2D6 (Miksys S et al. Citation2002). This indicates the divergent importance attributed to cellular organizations and functions (Miksys S, Hoffmann, et al. Citation2000).
The total content of brain CYP enzymes was initially assessed in rat brains using microsomal preparations, revealing a value of 30 pmol/mg of protein. This measurement is considerably lower than the corresponding liver microsomal content, which is approximately 3% (Sasame et al. Citation1977). In contrast, the human brain exhibits a CYP total content reaching approximately 10 pmol/mg, representing about 10% of the level observed in the liver microsomes (Ravindranath et al. Citation1990). There are relatively rare studies on the brain content of UGT, which may be because the BBB/BCSFB in its main distribution is not easy to separate and extract, or it may be because the content is lower than the minimum detection standard compared to the whole brain. These findings suggest that metabolism in human brains may have a greater contribution compared to that in experimental animals.
2.4. Species and sex dependencies of CYPs and UGTs
In preclinical experiments, various experimental animals are commonly used for research purposes to ‘predict’ the human situation. However, we now recognize that there are differences in drug metabolism between the human brain and animal brains. Therefore, when conducting studies, it is essential to consider the disparities between human and animal brains to ensure accurate interpretation of the results. To gain a better understanding of these differences, we have integrated and summarized the expression profiles of major CYP and UGT subfamily DMEs genes in the human, rat, and mouse brains by searching the NCBI database (Sayers et al. Citation2022) and relevant literature.
2.4.1. CYP isoforms
Based on , the existence of CYP enzymes in the brain shows considerable consistency across species, particularly for the CYP1A, 1B, and 2E subfamilies of DMEs. Notably, the CYP2D enzyme has been identified in the brains of rats, mice, dogs, monkeys, and humans (Tyndale et al. Citation1999; Siegle et al. Citation2001; Miksys S et al. Citation2002; Miksys SL et al. Citation2005). The region and cell-specific expression of CYP2D in the brain demonstrate a remarkable similarity among species. For example, expression of CYP2D in both human and rat brains is found in pyramidal neurons, Purkinje cells, and glial cells (Norris et al. Citation1996; Miksys S, Rao, et al. Citation2000; Siegle et al. Citation2001; Miksys S et al. Citation2002; Miksys SL et al. Citation2005).
Table 3. Major CYP family DME genes in human, rat, and mouse brains.
To facilitate cross-species studies and translational research, orthologous enzymes have also been investigated. Orthology refers to the evolutionary relationship between genes in different species that share a common ancestor. Orthologous CYPs can be found in various species and can be compared to understand the evolution and function of these enzymes across species. For example, Cyp2b10 and 3a11 in mice are orthologs of human CYP2B6 and 3A4, respectively (Kutsuno et al. Citation2015), while Cyp2d22 in mice is the orthologous gene of CYP2D6 in humans (Singh et al. Citation2009). Generally, orthologous genes in different species may exhibit similar or divergent functions, with the level of conservation varying depending on the specific enzyme and species. Studying orthologous CYPs can provide insights into the evolution and adaptation of these enzymes to different environmental conditions and aid in predicting potential drug–drug interactions and toxicity in different species.
Notably, the expression of CYP enzymes in the brain differs not only between species but also between sex. For instance, CYP2C6/2C11/2C13 are specific to male rats, while CYP2C12 is specific to female rats (Riedl et al. Citation2000). Similarly, CYP3A9 and CYP3A62 are specific to female rats, whereas CYP3A1/3A2/3A18 are specific to male rats (Woodland et al. Citation2008). However, some controversies exist. For example, the expression of CYP2C6 in the brain remains contentious. Kimura et al. detected Cyp2c6 mRNA in the brains of female rats but not male rats (Kimura et al. Citation1988), whereas Zaphiropoulos and Wood detected Cyp2c6 mRNA in the brains of male rats (Zaphiropoulos and Wood Citation1993). To date, there is no reported information on the distribution of CYP2C6 protein in the rat brain (Riedl et al. Citation2000).
In addition to these, functional counterparts across species are also of interest. Certain rat enzymes can be considered as functional counterparts of their human counterparts. For instance, rat CYP2C11/6, and CYP3A1/2 can be regarded as functional counterparts of human CYP2C9, and CYP3A4, respectively (Sadakierska-Chudy et al. Citation2013; Wójcikowski et al. Citation2013).
2.4.2. UGT isoforms
provides a comparative summary of UGT genes to illustrate the variations of UGT DMEs across different species. As mentioned earlier, approximately 11 UGTs are identified as the primary DMEs.
Table 4. Major UGT family DME genes in human, rat, and mouse brains.
Despite the presence of several enzyme genes expressed in both rats and humans, species-specific distinctions still exist. For example, the presence of UGT1A6 in rat brain microvessels was not consistently confirmed by all studies (Ouzzine et al. Citation2014). Moreover, the presence of UGT1A6 in the microvasculature of the human brain was not revealed, suggesting either its non-expression or extremely faint expression compared to rat brain microvessels (Ouzzine et al. Citation2014).
Furthermore, the existence of orthologous enzymes across different species, which perform similar metabolic functions, was observed. For instance, UGT2B1 in rats serves as the orthologous enzyme of UGT2B7 in humans (Abdullah and Ismail Citation2018). Additionally, the UGT1A family of genes demonstrates high conservation across species, with similar gene sequences between species (Buckley and Klaassen Citation2007). In contrast, the UGT2B family does not exhibit orthology between species, except for UGT2B1 in rats and mice (Mackenzie et al. Citation2005). This lack of orthology in the UGT2B family highlights the diversity and complexity of the UGT2B gene family across different species, contrasting with the well-conserved UGT1A family.
Moreover, UGT2B7 has been demonstrated to catalyze the glucuronidation of morphine in various animal species and humans. A development includes a transgenic mouse model expressing human UGT2B7 (Yueh et al. Citation2011), which serves as an effective tool for understanding the in vivo function of UGT2B7 and the regulatory processes governing its expression and activity under different experimental conditions (Ouzzine et al. Citation2014).
In summary, the expression patterns of CYP and UGT enzymes in the brain exhibit both similarities and differences across species. The CYP1A, 1B, 2D, and 2E and UGT1A6 enzymes are present in multiple species, but CYP2D specific isoforms vary between humans and rats. Additionally, orthologous enzymes offer valuable insights into the evolutionary and functional aspects of enzymes across species. Furthermore, variances in CYP expression between sexes further contribute to the intricacies of brain enzyme expression. Understanding these variations is crucial for interpreting research findings accurately and for considering the translational implications between species. After integrating the information of CYP and UGT DMEs in the brain across species, we found the rat should be more suitable to investigate drug metabolism and conversion as experimental animals compared to the mice.
3. Methods for identifying and quantifying enzyme activity
After gaining an understanding of DMEs presence and localization in brains, it is crucial to quantify enzyme activity in order to comprehend the impact of brain DMEs on drug exposure in the brain. In this section, we would like to outline the general experimental methods and techniques available for the assessment of enzyme activity.
Here, in , we selectively summarized some methods that are widely used and have been shown to be effective in measuring enzyme activity ex vivo and in vivo. Except the methods listed in , there are also other techniques available for measuring the relative activities of DMEs. For instance, Haduch et al. measured the formation of metabolites to assess the relative activities of enzymes while being inhibited by certain selected drugs (Haduch et al. Citation2011). Apart from experimental methods, there are some in silico approaches to estimate metabolic conversion, such as PK modeling (van den Brink et al. Citation2017). Despite the existence of various methods, data on the activity of DMEs, like enzyme concentration, enzyme kinetic parameters (Vmax, Km, etc.), in the brain are still very limited, especially for the human brain. This is not only because of the scarcity of brain samples but also because brain metabolism does not attract a lot of attention. Some studies aim to utilize gene expression level data to quantify the activities of enzymes in drug elimination in the brain, like in PK-sim (Cordes and Rapp Citation2023). However, it is important to recognize that the translation of mRNA into protein and the translation of protein expression level to protein activity are not necessarily linear and can be influenced by various factors. These are discussed in the next section. Moreover, there are significant interindividual variations in protein activities, which are influenced by host genetics and medical/environmental exposures (Neafsey et al. Citation2009).
Table 5. Comparison of ex vivo and in vivo enzyme activity measurement methods.
4. Factors that can affect CYP and UGT activities in the brain
The substantial diversity in the expression and activity of CYP and UGT enzymes among individuals is influenced by a range of factors. These include genetic and epigenetic variants, physiological considerations, pathophysiological factors, environmental elements (like diet, smoking, and alcohol consumption), and various other influencing factors (Eichelbaum et al. Citation2006; Song et al. Citation2021; Zhao et al. Citation2021). The resulting differences in catalytic activity play a pivotal role in shaping drug efficacy, ultimately contributing to variations in treatment outcomes among individuals (Nebert and Russell Citation2002).
4.1. Genetic polymorphism
Enzyme polymorphism refers to the occurrence of genetic variations within a population that result in different phenotypes or variants of a single enzyme. These polymorphisms play a significant role in drug metabolism, particularly in CYPs and UGTs. Genetic variations in the CYP450 and UGT genes can lead to alterations in enzyme activity, resulting in enhanced, reduced, or complete loss of function (Fanni et al. Citation2014). Consequently, these polymorphisms are one of the most important factors contributing to individual variations in drug response and metabolism, accounting for 15–30% of interindividual differences (Carpenter et al. Citation2017). The metabolic capacity of patients, at standard doses, can be categorized into four groups: ultra-rapid metabolizer (UM) (rapid metabolism, maybe too quick to provide symptom relief), extensive metabolizer (normal metabolism), intermediate metabolizer (slow metabolism, potential side effects), and poor metabolizer (PM) (very slow metabolism, potential side effects) (Deardorff et al. Citation2018). It is worth noting that variations at the genetic level affect the expression and activity of enzymes in various parts of the body, not just the brain.
Exemplified by the CYP2D6 gene, with over 70 allelic variants, CYP2D6 exhibits substantial interethnic variability, impacting allele frequencies across populations (Bertilsson et al. Citation2002). Notably, the prevalence of PMs varies, such as 7% in Western Europe, 0–5% in Africans, and 0–1% in Asians (Zhou S-F et al. Citation2009), while UMs are prevalent in the Mediterranean region (10% in Portugal, Spain, Italy) (Ingelman-Sundberg Citation2004b, Citation2005) and 1–2% in Northern Europe (Kirchheiner and Brockmöller Citation2005; Eichelbaum et al. Citation2006). CYP2D6 plays a pivotal role in metabolizing drugs like antidepressants, tranquillizers, some antiarrhythmics, lipophilic β-adrenergic receptor blockers, and opioids (Bertilsson et al. Citation2002), leading to necessary dosage adjustments ranging from 28% to 60% for PMs and 180% to 140% for UMs (Eichelbaum et al. Citation2006). Overall, CYP2D6 significantly impacts 20–30% of clinically used drugs (Ingelman-Sundberg Citation2004b), contributing to 10–12% with notable PK changes (Kirchheiner et al. Citation2004).
Other polymorphic CYP genes, including CYP1A1, 1A2, 2A6, 2A13, 2C8, 2C9, 2C19, 3A4, and 3A5, are crucial in phase I drug metabolism, collectively impacting nearly 80% of drugs in use. Key enzymes like 1A2, 2D6, 2C9, and 2C19 are particularly noteworthy (Zhou S-F et al. Citation2009; Preissner et al. Citation2013).
Moving to UGT polymorphism, UGT1A1 stands out for its crucial role in bilirubin glucuronidation. Its genetic polymorphism is well-documented, with significant phenotypic consequences in bilirubin-related disorders (Burchell and Hume Citation1999; Miners et al. Citation2002). Exploration of UGT polymorphism extends to UGT1A3, UGT1A6, UGT1A7, UGT2B4, UGT2B7, and UGT2B15. For instance, UGT1A6 exhibits potential in vivo metabolism alterations (Ciotti et al. Citation1997), and UGT1A7 carries an increased risk of exposure to polycyclic aromatic hydrocarbons for low-activity allele carriers (Guillemette et al. Citation2000).
Understanding the broader implications of UGT polymorphisms, especially in UGT1A3, UGT1A6, UGT1A7, UGT2B4, UGT2B7, and UGT2B15, requires comprehensive research. Such insights are essential for advancing personalized medicine, ensuring effective drug therapies, and addressing issues related to drug metabolism, toxicity, and susceptibility to diseases.
4.1.1. Physiological aspects
Physiological factors also contribute to inter-individual variability in drug responses, such as age and sex, by influencing the DMEs’ expression and activities.
The levels of certain brain CYPs exhibit significant variations with age (Miksys S and Tyndale Citation2013). Specifically, the expression of CYP2D6 in the brain is relatively low at birth but gradually increases over time. In individuals aged 65 and above, the levels of CYP2D6 reach their highest point (Mann et al. Citation2012). In contrast, hepatic CYP2D6 rapidly increases after birth, reaching adult levels, and remains relatively stable with age (Parkinson et al. Citation2004).
While there are known sex-based differences in the expression levels of hepatic CYP enzymes, studies on sex differences in brain CYP enzymes are limited (Ferguson and Tyndale Citation2011). In rat models, as previously discussed, there are sex-specific differences in the expression of CYP enzymes (Riedl et al. Citation2000; Woodland et al. Citation2008).
Regarding the enzymatic activities, there was a noteworthy inverse correlation observed between the activity of CYP2C19 and age. Conversely, CYP2E1 activity exhibited a positive association with age, indicating an increase over time. Additionally, it was observed that the onset of CYP2E1 activity occurred earlier in male subjects compared to their female counterparts (Bebia et al. Citation2004). Besides, scientists investigated that CYP2D activity was higher in some adult female rat brain regions (brain stem, hippocampus, cortex, and striatum) compared to male Dark Agouti WT rats (Haduch et al. Citation2022).
Understanding the influence of age and sex on DME activity is crucial for personalized medicine and optimizing drug therapy. Further research is needed to elucidate the mechanisms underlying these effects and their implications for therapeutic strategies and medication dosing.
4.1.2. Pathophysiological aspects
4.1.2.1. Infection and inflammation
Infections and inflammation are common pathological conditions that can lead to individual variations in drug responses. These conditions can modulate the activity of DMEs, particularly the CYP enzymes (Renton Citation2005). The modulation of CYP enzyme activity during infection or inflammation often results in changes in the expression levels of hepatic and extrahepatic CYP enzymes, like brain, with a predominant downregulation of CYP activity (Stavropoulou et al. Citation2018). This downregulation can have implications for drug metabolism, as decreased CYP activity may lead to reduced drug clearance and increased bioavailability (Morgan et al. Citation2008; Morgan Citation2009), consequently, potentially increasing the risk of drug adverse reactions. It is important to note that there are also rare cases where the expression levels of CYP enzymes are upregulated under inflammatory conditions. For instance, CYP2E1 is upregulated in brain astroglia, while CYP1A1 is downregulated (Tindberg et al. Citation2004). These alterations in brain CYP activity further highlight the complexity of drug responses during infection and inflammation.
Therefore, infection and inflammation have a profound impact on DME activity, especially CYP enzymes. The modulation of CYP activity in CNS during infection and inflammation can lead to alterations in drug metabolism and subsequently affect clinical drug responses. Further investigation is required to explore the precise mechanisms underlying these changes and develop strategies to mitigate potential risks and optimize therapeutic outcomes in patients experiencing infection and inflammation.
4.1.2.2. Parkinson’s disease
Parkinson’s disease (PD) is a progressive neurodegenerative disorder marked by the depletion of neurons that produce dopamine in the substantia nigra (Ur Rasheed et al. Citation2017), and it exhibits a significant interplay with DMEs. Among these, CYP2D6, a key player in PD and associated risk factors, is significantly expressed in affected brain regions, particularly dopamine-producing neurons in the substantia nigra (Siegle et al. Citation2001).
Poor metabolizer or impaired metabolism of CYP2D6 increases the risk of PD (McCann et al. Citation1997; Lu et al. Citation2014), particularly in individuals exposed to pesticides (Elbaz et al. Citation2004). Compared with healthy control individuals, PD patients had lower levels of CYP2D6 protein in several brain regions by about 40% (Mann et al. Citation2012). It appears that as PD progresses, CYP2D6 protein expression decreases. However, some studies suggest mitochondria-targeted CYP2D6’s role in generating neurotoxic substances, selectively killing dopaminergic neurons in a mouse model (Chattopadhyay et al. Citation2019; Christensen et al. Citation2020). Thus, the causal relationship between DME activity changes and PD development remains unclear.
Other CYP enzymes, including CYP1A2 and CYP19, are also implicated in PD (Morale et al. Citation2008; Popat et al. Citation2011). CYP1A2-mediated caffeine metabolism correlates negatively with PD risk (Popat et al. Citation2011), suggesting a potential protective role. Furthermore, the deficiency of CYP19, responsible for the formation of the neuroprotective steroid 17β-estradiol in the dopaminergic system, is identified as a potential risk factor (Simpson et al. Citation1994).
Understanding the intricate relationship between PD and DME activity, particularly the role of CYP enzymes, is crucial for unraveling the disease’s mechanisms and developing targeted therapeutic interventions. Investigating these complex interactions may also contribute to personalized medicine strategies, advancing PD management.
4.1.2.3. Epilepsy
Epilepsy is a prevalent neurological disorder. It is characterized by recurrent seizures. The disease can have important effects on the activity of DMEs, which in turn affect the efficacy of treatment. For example, UGT1A4 is highly expressed in the BBB endothelial cells and neurons of epilepsy brains (Ghosh et al. Citation2013). Increased activity of UGT1A4 has been observed in the metabolism of lamotrigine in epilepsy brains compared to the normal brain, suggesting that this phenotype may contribute to antiepileptic drug resistance in individuals with epilepsy (Ouzzine et al. Citation2014).
These findings shed light on the impact of epilepsy on DMEs, which has important implications for our understanding of epilepsy pathogenesis and for the development of more effective treatments. For epilepsy patients, the rapid metabolism of drugs may lead to poor drug efficacy and even lead to resistance to antiepileptic drugs. Further research on the relationship between epilepsy and DMEs will help optimize epilepsy treatment regimens and provide a basis for developing individualized treatment strategies. Epilepsy is a complex neurological disease, and its etiology and pathogenesis still need to be further studied in order to provide more effective treatment and management methods.
4.1.2.4. Alzheimer’s disease
Alzheimer’s disease (AD) is a progressive neurodegenerative disorder marked by amyloid beta-protein plaques and neurofibrillary tangles in the brain. The relationship between DMEs and neurodegenerative diseases has attracted much attention (Chik et al. Citation2022).
Neurosteroids are integral to neurotransmitter regulation and neuroprotection, and exhibit alterations in synthetases during AD progression. In an AD rat model induced by streptozotocin (STZ), upregulation of key UGT enzyme transcripts (Ugt1a1, Ugt1a7c, Ugt1a6, Ugt2b35, and Ugt2b17) was observed in STZ-12-week old rats (Chik et al. Citation2022).
These findings suggest a connection between AD progression, neurosteroid metabolism, and altered DMEs, impacting neurotransmission and neuroprotection. Investigating DME changes in AD holds significance for understanding pathogenesis and developing treatments.
4.1.2.5. Stress
Stress is a prevalent element of contemporary life and has emerged as one of the foremost health concerns in today’s society. It influences various DMEs in the body, encompassing isoforms from CYP1A, CYP2A, CYP3A, CYP2C, and CYP2D subfamilies. These isoforms are essential for metabolizing a majority of drugs available on the market (over 70%). Additionally, stress plays a pivotal role in the PK and multifaceted regulation of drugs within the body (Konstandi et al. Citation2022). Findings from the chronic mild stress (CMS) rat model further demonstrate that CMS triggers an elevation in the CYP2D enzyme within the hippocampus of rat brains, potentially augmenting the metabolism of CYP2D substrates in the rat brain (Haduch et al. Citation2018).
4.2. Environmental factors
Environmental factors play a crucial role in modulating the activity of DMEs, thereby influencing drug metabolism and response. Several key environmental factors, including diet, smoking, and drinking alcohol, have been implicated in altering the activity of various CYP enzymes involved in drug metabolism. Diet mostly affects enzyme activity in the digestive tract, but the link to enzyme activity in the brain is unclear.
4.2.1. Smoking
Nicotine, the primary psychoactive component of cigarette smoke (Stolerman and Jarvis Citation1995), is predominantly metabolized by CYP2A6 in the liver (Yamazaki et al. Citation1999). However, in the brain, CYP2A6 has minimal expression, and CYP2B6 is involved in nicotine metabolism (Ferguson and Tyndale Citation2011). Polymorphisms in the CYP2B6 gene, which result in slow metabolizer phenotypes, are associated with increased nicotine dependence, and lower quit rates of placebo (bupropion) (Lerman et al. Citation2002; Lee et al. Citation2007). The higher levels of CYP2D6 in the brains of smokers, compared to nonsmokers, may contribute to reduced sensitivity to neurotoxic effects caused by the metabolites of nicotine (Alves et al. Citation2004).
4.2.2. Drinking behavior
Alcohol can also influence the activity of specific CYP isoforms (Zhou S-F et al. Citation2009). CYP enzymes in the brain are more susceptible to modulation by alcohol consumption. Ethanol affects the expression of CYP subtypes differently in the brain and liver (Yue J et al. Citation2009). Generally, smokers and alcohol drinkers exhibit higher levels of CYP2E1, CYP2D6, and CYP2B6 in the brain (Ingelman-Sundberg Citation2004a; Almazroo et al. Citation2017; Albertolle et al. Citation2018). These altered enzyme levels in the brain may contribute to different responses to certain drugs and toxins among smokers and alcohol drinkers.
Understanding the impact of these environmental factors on DME activity is crucial for predicting individual variations in drug response and optimizing drug therapy. Further research is needed to explore the mechanisms by which different environmental factors modulate DMEs. Such knowledge can be applied in clinical practice to enhance the effectiveness and safety of drug therapy, ultimately leading to improved patient outcomes.
5. Examples of CYP- and UGT-mediated local metabolism in the brain on CNS-active drugs
DMEs play a crucial role in the activation or elimination of CNS-active drugs from the brain. CYPs and UGTs in the brain may even have more relatively effective biotransformation abilities locally than those in the liver. Sometimes poor correlation was observed between plasma concentrations and treatment outcomes (Song et al. Citation2021), suggesting a role for local metabolism as a potential modulator of drug response.
CYP2D6, for instance, plays a role in transforming codeine into morphine – the active metabolite of codeine (Smith Citation2009). Studies have shown that the initial analgesic impact of codeine, at least, stems from morphine generation in the rat brain rather than the liver (Chen ZR et al. Citation1990).
Propofol sedation, metabolized by CYP2B, correlates with cerebral drug concentration, not plasma concentration (Khokhar and Tyndale Citation2011). BBB-expressed CYP isoforms constrain drug concentration by limiting entry into the brain (Dauchy et al. Citation2008).
As another example, the anti-anxiety drug alprazolam (ALP) can usually be metabolized by CYP3A43 and CYP3A4 to α-hydroxy alprazolam (α-OHALP, active metabolite) (Sethy and Harris Citation1982) and 4-hydroxy alprazolam (4-OHALP, less active metabolite metabolites) (Greenblatt and Wright Citation1993). Research has shown inherent distinctions in the biotransformation of ALP between the brain and liver. The brain tends to produce a relatively higher amount of α-OHALP compared to the liver (Agarwal et al. Citation2008). This is attributed to the relatively high expression of CYP3A43 in the brain, particularly in the pons and cervical cord. Higher expression of CYP3A43 leads to distinct metabolite profiles within the human brain compared to the liver, affecting pharmacodynamics of psychoactive drugs at their sites of action (Agarwal et al. Citation2008).
There are many other examples providing evidence that metabolism in the brain does occur. Morphine, a well-known analgesic, is metabolized primarily through UGT-catalyzed glucuronidation. UGT2B7 is the predominant isoform accountable for the 3- and 6-glucuronidation of morphine (M3G, M6G) in humans (De Gregori et al. Citation2012). Despite in vitro findings suggesting a potential role for UGT1A1 in M3G formation, the primary DME of morphine in vivo continues to be the UGT2B7 isoform (Stone et al. Citation2003). Morphine produces nanomolar levels of M3G and M6G in human brain tissue homogenates and rat primary microglia, increasing local M6G concentrations (Yamada et al. Citation2003; Togna et al. Citation2013). Thus, M6G can be formed directly in the CNS (Yamada et al. Citation2003). There is also evidence proving that morphine glucuronides in the CSF were formed locally (Ouzzine et al. Citation2014). Although UGT2B7 also appears to play a role in the formation of M6G from endogenous morphine, the enzymology of this metabolism in the brain still needs to be elucidated more thoroughly (De Gregori et al. Citation2012).
Besides, as mentioned before, brain metabolism of lamotrigine was observed in both normal and epilepsy brains. UGT1A4 and UGT2B7 play a role in the metabolism of lamotrigine, broad-spectrum antiepileptic drug, within the brain (Suzuki et al. Citation2019). UGT1A4 expression was observed in both normal human brain microvascular endothelial cells and drug-resistant epilepsy patient brain endothelial cells in vitro (Ghosh et al. Citation2013). UGT2B7 was also observed in human brain (Ouzzine et al. Citation2014). Before the drug reaches the target tissue, it can be metabolized by the BBB or by the neuron itself in the target tissue, thereby affecting its distribution in the brain tissue and the exertion of the drug effect. Under disease conditions, expression of the enzyme is induced.
Moreover, studies conducted on rats have shown that CYP2D-mediated brain drug metabolism plays opposite roles in the acute and chronic effects of fluphenazine, highlighting the importance of CYP enzymes in drug response (Miksys et al. Citation2017). The findings suggest that extrahepatic tissues in target organs with low levels of drug-metabolizing CYP enzymes may also influence treatment outcomes after clinical drug induction. In addition to their role as protective barriers against exogenous substances, further research is warranted to investigate the impact of brain CYP enzymes on commonly used drugs (Ding and Kaminsky Citation2003). Therefore, summarizes the substrates of these general DMEs expressed in the brain. This table provides a list of substrates and corresponding DMEs and suggests the presence of possible brain metabolism.
Table 6. DMEs in human brains and corresponding CNS-active drugs as substrates.
6. Discussion
Although drug metabolism in the brain is relatively low compared to the liver, a wide variety of metabolizing enzymes are expressed in the brain and the relatively high levels of DMEs due to their abundant expression in specific brain regions or cells (Ferguson and Tyndale Citation2011), that result in brain metabolism of some CNS-active drugs cannot be ignored. There is growing evidence that the brain metabolism of some centrally active drugs has a crucial influence on efficacy (Agarwal et al. Citation2008). However, there are controversies among studies regarding the cellular and regional location of DMEs expression, sex-specific information, species-specific information, etc. These conflicting findings underscore the challenges associated with characterizing CYPs and UGTs expression in specific brain regions. These differences may be attributed to variations in experimental techniques, differences in sample sources, sample storage conditions, preparations, or individual differences, and the high similarity between CYPs and UGTs isoforms. The presence of CYPs and UGTs in specific brain anatomical regions indicates its potential role in drug metabolism within these areas. Further research is warranted to elucidate the functional significance of CYPs and UGTs in these brain regions and their implications for drug response and metabolism. Thus, to establish a clearer understanding of the presence and distribution of DMEs, future studies should employ robust methodologies and examine both mRNA and protein levels consistently and comprehensively.
In addition, the expression and activity of DMEs are also of interest, but data on absolute quantification values, neither in expression nor in activities, of metabolic enzymes in the brain are very sparse. Many expression values of DMEs have a lot of variabilities in reported data between different papers, because of various reasons: such as different sample conditions (healthy, disease, individual differences, different developmental stages) (Choudhary et al. Citation2005), different technologies used, high homology between superfamily members (Dutheil et al. Citation2008; Fanni et al. Citation2021). Besides, the relationships between mRNA expression, protein expression, and enzyme activity are almost impossible to be linear, because they are regulated by various factors as mentioned before (such as genetic and epigenetic variants, CNS diseases, environmental and physiological factors, etc.) (Dutheil et al. Citation2008; Ghosh et al. Citation2016; Fanni et al. Citation2021). Understanding the function of DMEs in the brain and their changes, under different conditions, may provide unique strategies for the development of therapeutic drugs acting on the CNS that are locally metabolized in the brain, as well as those that directly target brain DMEs (McMillan DM and Tyndale Citation2018). Additionally, the absolute quantification of brain CYP enzymes, particularly at the protein and activity level, remains a subject of limited research. Future studies should focus on comprehensively characterizing the distribution and abundance of CYP enzymes within specific brain regions, considering both protein and activity levels, to gain a deeper understanding of their role in drug metabolism and response.
Besides, DMEs can not only affect drug metabolism (Agarwal et al. Citation2008; Ghosh et al. Citation2013), and disease (Ur Rasheed et al. Citation2017; Chik et al. Citation2022) in the brain, but also affect the drug–drug interactions. For instance, tricyclic antidepressants can increase antipyrine clearance and speed up the metabolism of benzphetamine and ketotifen (O’Malley et al. Citation1973; Cresteil et al. Citation1983), while phenothiazine neuroleptics can inhibit steroid metabolism and have some negative endocrine effects (Meltzer Citation1985; Rane et al. Citation1996). Thus, it is essential to consider the effects of DMEs when developing and administering CNS-acting drugs. For example, researchers and clinicians may choose to use drugs that are metabolized more slowly in order to prolong their therapeutic effect. Alternatively, they may use drugs that are rapidly metabolized in order to minimize the risk of toxicity and reduce the duration of drug action.
In conclusion, understanding the effects of DMEs on CNS-acting drugs is critical for optimizing the efficacy and safety of these drugs in the brain. Careful consideration of the PK, pharmacodynamics, and potential drug–drug interactions of CNS-acting drugs is essential for ensuring their appropriate use and minimizing the risk of adverse effects.
With increased understanding of the importance of DMEs in the brain, brain metabolism should also be considered in PK models, especially the PBPK models. Currently, also our comprehensive LeiCNS-PK 3.0 (Saleh et al. Citation2021), does not yet specify the contribution of DMEs in the brain. This model could be further improved by incorporating equations for brain metabolism, to better predict potential impact of brain metabolism of CNS target site concentration and the further CNS effects of drugs and active metabolites.
Acknowledgements
The first author gratefully acknowledges the financial support for doctoral study provided by the China Scholarship Council (CSC).
Disclosure statement
No potential conflict of interest was reported by the author(s).
Additional information
Funding
References
- Abdullah NH, Ismail S. 2018. Inhibition of UGT2B7 enzyme activity in human and rat liver microsomes by herbal constituents. Molecules. 23(10):2696. doi: 10.3390/molecules23102696.
- Agarwal V, Kommaddi RP, Valli K, Ryder D, Hyde TM, Kleinman JE, Strobel HW, Ravindranath V. 2008. Drug metabolism in human brain: high levels of cytochrome P4503A43 in brain and metabolism of anti-anxiety drug alprazolam to its active metabolite. PLOS One. 3(6):e2337. doi: 10.1371/journal.pone.0002337.
- Albertolle ME, Phan TT, Pozzi A, Guengerich FP. 2018. Sulfenylation of human liver and kidney microsomal cytochromes P450 and other drug-metabolizing enzymes as a response to redox alteration. Mol Cell Proteomics. 17(5):889–900. doi: 10.1074/mcp.RA117.000382.
- Alkayed NJ, Narayanan J, Gebremedhin D, Medhora M, Roman RJ, Harder DR. 1996. Molecular characterization of an arachidonic acid epoxygenase in rat brain astrocytes. Stroke. 27(5):971–979. doi: 10.1161/01.str.27.5.971.
- Almazroo OA, Miah MK, Venkataramanan R. 2017. Drug metabolism in the liver. Clin Liver Dis. 21(1):1–20. doi: 10.1016/j.cld.2016.08.001.
- Alves G, Kurz M, Lie SA, Larsen JP. 2004. Cigarette smoking in Parkinson’s disease: influence on disease progression. Mov Disord. 19(9):1087–1092. doi: 10.1002/mds.20117.
- Bebia Z, Buch SC, Wilson JW, Frye RF, Romkes M, Cecchetti A, Chaves-Gnecco D, Branch RA. 2004. Bioequivalence revisited: influence of age and sex on CYP enzymes. Clin Pharmacol Ther. 76(6):618–627. doi: 10.1016/j.clpt.2004.08.021.
- Bertilsson L, Dahl M-L, Dalén P, Al-Shurbaji A. 2002. Molecular genetics of CYP2D6: clinical relevance with focus on psychotropic drugs. Br J Clin Pharmacol. 53(2):111–122. doi: 10.1046/j.0306-5251.2001.01548.x.
- Bhagwat SV, Boyd MR, Ravindranath V. 2000. Multiple forms of cytochrome P450 and associated monooxygenase activities in human brain mitochondria. Biochem Pharmacol. 59(5):573–582. doi: 10.1016/s0006-2952(99)00362-7.
- Bhamre S, Anandatheerthavarada HK, Shankar SK, Ravindranath V. 1992. Microsomal cytochrome P450 in human brain regions. Biochem Pharmacol. 44(6):1223–1225. doi: 10.1016/0006-2952(92)90390-5.
- Bibi Z. 2008. Role of cytochrome P450 in drug interactions. Nutr Metab. 5(1):27. doi: 10.1186/1743-7075-5-27.
- Booth Depaz IM, Toselli F, Wilce PA, Gillam EM. 2015. Differential expression of cytochrome P450 enzymes from the CYP2C subfamily in the human brain. Drug Metab Dispos. 43(3):353–357. doi: 10.1124/dmd.114.061242.
- Boussadia B, Ghosh C, Plaud C, Pascussi JM, de Bock F, Rousset MC, Janigro D, Marchi N. 2014. Effect of status epilepticus and antiepileptic drugs on CYP2E1 brain expression. Neuroscience. 281:124–134. doi: 10.1016/j.neuroscience.2014.09.055.
- Britto MR, Wedlund PJ. 1992. Cytochrome P-450 in the brain. Potential evolutionary and therapeutic relevance of localization of drug-metabolizing enzymes. Drug Metab Dispos. 20(3):446–450.
- Brodie MJ, Mintzer S, Pack AM, Gidal BE, Vecht CJ, Schmidt D. 2013. Enzyme induction with antiepileptic drugs: cause for concern? Epilepsia. 54(1):11–27. doi: 10.1111/j.1528-1167.2012.03671.x.
- Buckley DB, Klaassen CD. 2007. Tissue- and gender-specific mRNA expression of UDP-glucuronosyltransferases (UGTs) in mice. Drug Metab Dispos. 35(1):121–127. doi: 10.1124/dmd.106.012070.
- Burchell B, Hume R. 1999. Molecular genetic basis of Gilbert’s syndrome. J Gastroenterol Hepatol. 14(10):960–966. doi: 10.1046/j.1440-1746.1999.01984.x.
- Carpenter C, Zestos AG, Altshuler R, Sorenson RJ, Guptaroy B, Showalter HD, Kennedy RT, Jutkiewicz E, Gnegy ME. 2017. Direct and systemic administration of a CNS-permeant tamoxifen analog reduces amphetamine-induced dopamine release and reinforcing effects. Neuropsychopharmacology. 42(10):1940–1949. doi: 10.1038/npp.2017.95.
- Chattopadhyay M, Chowdhury AR, Feng T, Assenmacher CA, Radaelli E, Guengerich FP, Avadhani NG. 2019. Mitochondrially targeted cytochrome P450 2D6 is involved in monomethylamine-induced neuronal damage in mouse models. J Biol Chem. 294(26):10336–10348. doi: 10.1074/jbc.RA119.008848.
- Chen J, Zheng H, Zeng S, Xie C, Li X, Yan T, Gong X, Lu L, Qi X, Wang Y, et al. 2017. Profiles and gender-specifics of UDP-glucuronosyltransferases and sulfotransferases expressions in the major metabolic organs of wild-type and efflux transporter knockout FVB mice. Mol Pharm. 14(9):2967–2976. doi: 10.1021/acs.molpharmaceut.7b00435.
- Chen ZR, Irvine RJ, Bochner F, Somogyi AA. 1990. Morphine formation from codeine in rat brain: a possible mechanism of codeine analgesia. Life Sci. 46(15):1067–1074. doi: 10.1016/0024-3205(90)90415-n.
- Chik MW, Hazalin N, Singh GKS. 2022. Regulation of phase I and phase II neurosteroid enzymes in the hippocampus of an Alzheimer’s disease rat model: a focus on sulphotransferases and UDP-glucuronosyltransferases. Steroids. 184:109035. doi: 10.1016/j.steroids.2022.109035.
- Chinta SJ, Pai HV, Upadhya SC, Boyd MR, Ravindranath V. 2002. Constitutive expression and localization of the major drug metabolizing enzyme, cytochrome P4502D in human brain. Brain Res Mol Brain Res. 103 (1–2):49–61. doi: 10.1016/s0169-328x(02)00177-8.
- Choudhary D, Jansson I, Stoilov I, Sarfarazi M, Schenkman JB. 2005. Expression patterns of mouse and human CYP orthologs (families 1–4) during development and in different adult tissues. Arch Biochem Biophys. 436(1):50–61. doi: 10.1016/j.abb.2005.02.001.
- Christensen C, Þorsteinsson H, Maier VH, Karlsson KÆ. 2020. Multi-parameter behavioral phenotyping of the MPP + model of Parkinson’s disease in zebrafish. Front Behav Neurosci. 14:623924. doi: 10.3389/fnbeh.2020.623924.
- Ciotti M, Marrone A, Potter C, Owens IS. 1997. Genetic polymorphism in the human UGT1A6 UDP-glucuronosyltransferase: pharmacological implications. Pharmacogenetics. 7(6):485–495.
- Cordes H, Rapp H. 2023. Gene expression databases for physiologically based pharmacokinetic modeling of humans and animal species. CPT Pharmacometr Syst Pharmacol. 12(3):311–319. doi: 10.1002/psp4.12904.
- Court MH, Zhang X, Ding X, Yee KK, Hesse LM, Finel M. 2012. Quantitative distribution of mRNAs encoding the 19 human UDP-glucuronosyltransferase enzymes in 26 adult and 3 fetal tissues. Xenobiotica. 42(3):266–277. doi: 10.3109/00498254.2011.618954.
- Cresteil T, Célier C, Kremers P, Flinois JP, Beaune P, Leroux JP. 1983. Induction of drug-metabolizing enzymes by tricyclic antidepressants in human liver: characterization and partial resolution of cytochromes P-450. Br J Clin Pharmacol. 16(6):651–657. doi: 10.1111/j.1365-2125.1983.tb02236.x.
- Dauchy S, Dutheil F, Weaver RJ, Chassoux F, Daumas-Duport C, Couraud PO, Scherrmann JM, De Waziers I, Decleves X. 2008. ABC transporters, cytochromes P450 and their main transcription factors: expression at the human blood–brain barrier. J Neurochem. 107(6):1518–1528. doi: 10.1111/j.1471-4159.2008.05720.x.
- De Gregori S, De Gregori M, Ranzani GN, Allegri M, Minella C, Regazzi M. 2012. Morphine metabolism, transport and brain disposition. Metab Brain Dis. 27(1):1–5. doi: 10.1007/s11011-011-9274-6.
- Deardorff OG, Jenne V, Leonard L, Ellingrod VL. 2018. Making sense of CYP2D6 and CYP1A2 genotype vs phenotype. Curr Psychiatry. 17:41–45.
- Decleves X, Jacob A, Yousif S, Shawahna R, Potin S, Scherrmann JM. 2011. Interplay of drug metabolizing CYP450 enzymes and ABC transporters in the blood–brain barrier. Curr Drug Metab. 12(8):732–741. doi: 10.2174/138920011798357024.
- Dey A, Jones JE, Nebert DW. 1999. Tissue- and cell type-specific expression of cytochrome P450 1A1 and cytochrome P450 1A2 mRNA in the mouse localized in situ hybridization. Biochem Pharmacol. 58(3):525–537. doi: 10.1016/s0006-2952(99)00110-0.
- Ding X, Kaminsky LS. 2003. Human extrahepatic cytochromes P450: function in xenobiotic metabolism and tissue-selective chemical toxicity in the respiratory and gastrointestinal tracts. Annu Rev Pharmacol Toxicol. 43(1):149–173. doi: 10.1146/annurev.pharmtox.43.100901.140251.
- Dona AC, Kyriakides M, Scott F, Shephard EA, Varshavi D, Veselkov K, Everett JR. 2016. A guide to the identification of metabolites in NMR-based metabonomics/metabolomics experiments. Comput Struct Biotechnol J. 14:135–153. doi: 10.1016/j.csbj.2016.02.005.
- Dutheil F, Beaune P, Loriot MA. 2008. Xenobiotic metabolizing enzymes in the central nervous system: contribution of cytochrome P450 enzymes in normal and pathological human brain. Biochimie. 90(3):426–436. doi: 10.1016/j.biochi.2007.10.007.
- Dutheil F, Dauchy S, Diry M, Sazdovitch V, Cloarec O, Mellottée L, Bièche I, Ingelman-Sundberg M, Flinois J-P, de Waziers I, et al. 2009. Xenobiotic-metabolizing enzymes and transporters in the normal human brain: regional and cellular mapping as a basis for putative roles in cerebral function. Drug Metab Dispos. 37(7):1528–1538. doi: 10.1124/dmd.109.027011.
- Eichelbaum M, Ingelman-Sundberg M, Evans WE. 2006. Pharmacogenomics and individualized drug therapy. Annu Rev Med. 57(1):119–137. doi: 10.1146/annurev.med.56.082103.104724.
- Elbaz A, Levecque C, Clavel J, Vidal JS, Richard F, Amouyel P, Alpérovitch A, Chartier-Harlin MC, Tzourio C. 2004. CYP2D6 polymorphism, pesticide exposure, and Parkinson’s disease. Ann Neurol. 55(3):430–434. doi: 10.1002/ana.20051.
- Engelhardt B, Sorokin L. 2009. The blood–brain and the blood–cerebrospinal fluid barriers: function and dysfunction. Semin Immunopathol. 31(4):497–511. doi: 10.1007/s00281-009-0177-0.
- Eyal S, Hsiao P, Unadkat JD. 2009. Drug interactions at the blood–brain barrier: fact or fantasy? Pharmacol Ther. 123(1):80–104. doi: 10.1016/j.pharmthera.2009.03.017.
- Fanni D, Ambu R, Gerosa C, Nemolato S, Castagnola M, Van Eyken P, Faa G, Fanos V. 2014. Cytochrome P450 genetic polymorphism in neonatal drug metabolism: role and practical consequences towards a new drug culture in neonatology. Int J Immunopathol Pharmacol. 27(1):5–13. doi: 10.1177/039463201402700102.
- Fanni D, Pinna F, Gerosa C, Paribello P, Carpiniello B, Faa G, Manchia M. 2021. Anatomical distribution and expression of CYP in humans: neuropharmacological implications. Drug Dev Res. 82(5):628–667. doi: 10.1002/ddr.21778.
- Farin FM, Omiecinski CJ. 1993. Regiospecific expression of cytochrome P-450s and microsomal epoxide hydrolase in human brain tissue. J Toxicol Environ Health. 40(2–3):317–335. doi: 10.1080/15287399309531797.
- Ferguson CS, Tyndale RF. 2011. Cytochrome P450 enzymes in the brain: emerging evidence of biological significance. Trends Pharmacol Sci. 32(12):708–714. doi: 10.1016/j.tips.2011.08.005.
- Fernandes TB, Damião MCF, Polli M, Parise-Filho R. 2016. Analysis of the applicability and use of Lipinski’s rule for central nervous system drugs. Lett Drug Des Discov. 13(10):999–1006. doi: 10.2174/1570180813666160622092839.
- Frommer WB, Davidson MW, Campbell RE. 2009. Genetically encoded biosensors based on engineered fluorescent proteins. Chem Soc Rev. 38(10):2833–2841. doi: 10.1039/b907749a.
- Funae Y, Kishimoto W, Cho T, Niwa T, Hiroi T. 2003. CYP2D in the brain. Drug Metab Pharmacokinet. 18(6):337–349. doi: 10.2133/dmpk.18.337.
- Galis ZS, Sukhova GK, Lark MW, Libby P. 1994. Increased expression of matrix metalloproteinases and matrix degrading activity in vulnerable regions of human atherosclerotic plaques. J Clin Invest. 94(6):2493–2503. doi: 10.1172/JCI117619.
- Gambaro SE, Robert MC, Tiribelli C, Gazzin S. 2016. Role of brain cytochrome P450 mono-oxygenases in bilirubin oxidation-specific induction and activity. Arch Toxicol. 90(2):279–290. doi: 10.1007/s00204-014-1394-4.
- Ghersi-Egea JF, Leninger-Muller B, Suleman G, Siest G, Minn A. 1994. Localization of drug-metabolizing enzyme activities to blood–brain interfaces and circumventricular organs. J Neurochem. 62(3):1089–1096. doi: 10.1046/j.1471-4159.1994.62031089.x.
- Ghosh C, Hossain M, Puvenna V, Martinez-Gonzalez J, Alexopolous A, Janigro D, Marchi N. 2013. Expression and functional relevance of UGT1A4 in a cohort of human drug-resistant epileptic brains. Epilepsia. 54(9):1562–1570. doi: 10.1111/epi.12318.
- Ghosh C, Hossain M, Solanki J, Dadas A, Marchi N, Janigro D. 2016. Pathophysiological implications of neurovascular P450 in brain disorders. Drug Discov Today. 21(10):1609–1619. doi: 10.1016/j.drudis.2016.06.004.
- Gilbert EA, Edwards RJ, Boobis AR, Rose S, Jenner P. 2003. Differential expression of cytochrome P450 enzymes in cultured and intact foetal rat ventral mesencephalon. J Neural Transm. 110(10):1091–1101. doi: 10.1007/s00702-003-0029-3.
- Gonzalez FJ, Matsunaga T, Nagata K, Meyer UA, Nebert DW, Pastewka J, Kozak CA, Gillette J, Gelboin HV, Hardwick JP. 1987. Debrisoquine 4-hydroxylase: characterization of a new P450 gene subfamily, regulation, chromosomal mapping, and molecular analysis of the DA rat polymorphism. DNA. 6(2):149–161. doi: 10.1089/dna.1987.6.149.
- Gradinaru D, Minn AL, Artur Y, Minn A, Heydel JM. 2009. Drug metabolizing enzyme expression in rat choroid plexus: effects of in vivo xenobiotics treatment. Arch Toxicol. 83(6):581–586. doi: 10.1007/s00204-008-0386-7.
- Granberg L, Ostergren A, Brandt I, Brittebo EB. 2003. CYP1A1 and CYP1B1 in blood–brain interfaces: CYP1A1-dependent bioactivation of 7,12-dimethylbenz(a)anthracene in endothelial cells. Drug Metab Dispos. 31(3):259–265. doi: 10.1124/dmd.31.3.259.
- Greenblatt DJ, Wright CE. 1993. Clinical pharmacokinetics of alprazolam: therapeutic implications. Clin Pharmacokinet. 24(6):453–471. doi: 10.2165/00003088-199324060-00003.
- Greis KD. 2007. Mass spectrometry for enzyme assays and inhibitor screening: an emerging application in pharmaceutical research. Mass Spectrom Rev. 26(3):324–339. doi: 10.1002/mas.20127.
- Guillemette C, Ritter JK, Auyeung DJ, Kessler FK, Housman DE. 2000. Structural heterogeneity at the UDP-glucuronosyltransferase 1 locus: functional consequences of three novel missense mutations in the human UGT1A7 gene. Pharmacogenet Genomics. 10(7):629–644. doi: 10.1097/00008571-200010000-00006.
- Gundert-Remy U, Bernauer U, Blömeke B, Döring B, Fabian E, Goebel C, Hessel S, Jäckh C, Lampen A, Oesch F, et al. 2014. Extrahepatic metabolism at the body’s internal–external interfaces. Drug Metab Rev. 46(3):291–324. doi: 10.3109/03602532.2014.900565.
- Haduch A, Bromek E, Daniel WA. 2011. The effect of psychotropic drugs on cytochrome P450 2D (CYP2D) in rat brain. Eur J Pharmacol. 651(1–3):51–58. doi: 10.1016/j.ejphar.2010.10.077.
- Haduch A, Danek PJ, Kuban W, Pukło R, Alenina N, Gołębiowska J, Popik P, Bader M, Daniel WA. 2022. Cytochrome P450 2D (CYP2D) enzyme dysfunction associated with aging and serotonin deficiency in the brain and liver of female Dark Agouti rats. Neurochem Int. 152:105223. doi: 10.1016/j.neuint.2021.105223.
- Haduch A, Rysz M, Papp M, Daniel WA. 2018. The activity of brain and liver cytochrome P450 2D (CYP2D) is differently affected by antidepressants in the chronic mild stress (CMS) model of depression in the rat. Biochem Pharmacol. 156:398–405. doi: 10.1016/j.bcp.2018.09.005.
- Hagemeyer CE, Rosenbrock H, Ditter M, Knoth R, Volk B. 2003. Predominantly neuronal expression of cytochrome P450 isoforms CYP3A11 and CYP3A13 in mouse brain. Neuroscience. 117(3):521–529. doi: 10.1016/s0306-4522(02)00955-7.
- Heydel JM, Holsztynska EJ, Legendre A, Thiebaud N, Artur Y, Le Bon AM. 2010. UDP-glucuronosyltransferases (UGTs) in neuro-olfactory tissues: expression, regulation, and function. Drug Metab Rev. 42(1):74–97. doi: 10.3109/03602530903208363.
- Huang P, Rannug A, Ahlbom E, Håkansson H, Ceccatelli S. 2000. Effect of 2,3,7,8-tetrachlorodibenzo-p-dioxin on the expression of cytochrome P450 1A1, the aryl hydrocarbon receptor, and the aryl hydrocarbon receptor nuclear translocator in rat brain and pituitary. Toxicol Appl Pharmacol. 169(2):159–167. doi: 10.1006/taap.2000.9064.
- Iba MM, Storch A, Ghosal A, Bennett S, Reuhl KR, Lowndes HE. 2003. Constitutive and inducible levels of CYP1A1 and CYP1A2 in rat cerebral cortex and cerebellum. Arch Toxicol. 77(10):547–554. doi: 10.1007/s00204-003-0488-1.
- Imaoka S, Hashizume T, Funae Y. 2005. Localization of rat cytochrome P450 in various tissues and comparison of arachidonic acid metabolism by rat P450 with that by human P450 orthologs. Drug Metab Pharmacokinet. 20(6):478–484. doi: 10.2133/dmpk.20.478.
- Ingelman-Sundberg M. 2004a. Human drug metabolising cytochrome P450 enzymes: properties and polymorphisms. Naunyn Schmiedebergs Arch Pharmacol. 369(1):89–104. doi: 10.1007/s00210-003-0819-z.
- Ingelman-Sundberg M. 2004b. Pharmacogenetics of cytochrome P450 and its applications in drug therapy: the past, present and future. Trends Pharmacol Sci. 25(4):193–200. doi: 10.1016/j.tips.2004.02.007.
- Ingelman-Sundberg M. 2005. Genetic polymorphisms of cytochrome P450 2D6 (CYP2D6): clinical consequences, evolutionary aspects and functional diversity. Pharmacogenomics J. 5(1):6–13. doi: 10.1038/sj.tpj.6500285.
- Isin EM, Guengerich FP. 2007. Complex reactions catalyzed by cytochrome P450 enzymes. Biochim Biophys Acta. 1770(3):314–329. doi: 10.1016/j.bbagen.2006.07.003.
- Issa NT, Wathieu H, Ojo A, Byers SW, Dakshanamurthy S. 2017. Drug metabolism in preclinical drug development: a survey of the discovery process, toxicology, and computational tools. Curr Drug Metab. 18(6):556–565.
- Jacob A, Hartz AM, Potin S, Coumoul X, Yousif S, Scherrmann J-M, Bauer B, Declèves X. 2011. Aryl hydrocarbon receptor-dependent upregulation of Cyp1b1 by TCDD and diesel exhaust particles in rat brain microvessels. Fluids Barriers CNS. 8(1):23. doi: 10.1186/2045-8118-8-23.
- Jancova P, Anzenbacher P, Anzenbacherova E. 2010. Phase II drug metabolizing enzymes. Biomed Pap Med Fac Univ Palacky Olomouc Czech Repub. 154(2):103–116. doi: 10.5507/bp.2010.017.
- Johansson MK, Cook RM. 2003. Intramolecular dimers: a new design strategy for fluorescence-quenched probes. Chemistry. 9(15):3466–3471. doi: 10.1002/chem.200304941.
- Kanamori K, Ross BD. 2005. Suppression of glial glutamine release to the extracellular fluid studied in vivo by NMR and microdialysis in hyperammonemic rat brain. J Neurochem. 94(1):74–85. doi: 10.1111/j.1471-4159.2005.03170.x.
- Kanamori K. 2017. In vivo N-15 MRS study of glutamate metabolism in the rat brain. Anal Biochem. 529:179–192. doi: 10.1016/j.ab.2016.08.025.
- Kaur G, Gupta SK, Singh P, Ali V, Kumar V, Verma M. 2020. Drug-metabolizing enzymes: role in drug resistance in cancer. Clin Transl Oncol. 22(10):1667–1680. doi: 10.1007/s12094-020-02325-7.
- Kawashima H, Sequeira DJ, Nelson DR, Strobel HW. 1996. Genomic cloning and protein expression of a novel rat brain cytochrome P-450 CYP2D18* catalyzing imipramine N-demethylation. J Biol Chem. 271(45):28176–28180. doi: 10.1074/jbc.271.45.28176.
- Khokhar JY, Tyndale RF. 2011. Drug metabolism within the brain changes drug response: selective manipulation of brain CYP2B alters propofol effects. Neuropsychopharmacology. 36(3):692–700. doi: 10.1038/npp.2010.202.
- Kiang TK, Ensom MH, Chang TK. 2005. UDP-glucuronosyltransferases and clinical drug–drug interactions. Pharmacol Ther. 106(1):97–132. doi: 10.1016/j.pharmthera.2004.10.013.
- Kiiski I, Ollikainen E, Artes S, Järvinen P, Jokinen V, Sikanen T. 2021. Drug glucuronidation assays on human liver microsomes immobilized on microfluidic flow-through reactors. Eur J Pharm Sci. 158:105677. doi: 10.1016/j.ejps.2020.105677.
- Kimura H, Yoshioka H, Sogawa K, Sakai Y, Fujii-Kuriyama Y. 1988. Complementary DNA cloning of cytochrome P-450s related to P-450(M-1) from the complementary DNA library of female rat livers. Predicted primary structures for P-450f, PB-1, and PB-1-related protein with a bizarre replacement block and their mode of transcriptional expression. J Biol Chem. 263(2):701–707. doi: 10.1016/S0021-9258(19)35409-2.
- King CD, Rios GR, Assouline JA, Tephly TR. 1999. Expression of UDP-glucuronosyltransferases (UGTs) 2B7 and 1A6 in the human brain and identification of 5-hydroxytryptamine as a substrate. Arch Biochem Biophys. 365(1):156–162. English. doi: 10.1006/abbi.1999.1155.
- Kirchheiner J, Brockmöller J. 2005. Clinical consequences of cytochrome P450 2C9 polymorphisms. Clin Pharmacol Ther. 77(1):1–16. doi: 10.1016/j.clpt.2004.08.009.
- Kirchheiner J, Nickchen K, Bauer M, Wong M-L, Licinio J, Roots I, Brockmöller J. 2004. Pharmacogenetics of antidepressants and antipsychotics: the contribution of allelic variations to the phenotype of drug response. Mol Psychiatry. 9(5):442–473. doi: 10.1038/sj.mp.4001494.
- Knights KM, Rowland A, Miners JO. 2013. Renal drug metabolism in humans: the potential for drug–endobiotic interactions involving cytochrome P450 (CYP) and UDP-glucuronosyltransferase (UGT). Br J Clin Pharmacol. 76(4):587–602. doi: 10.1111/bcp.12086.
- Koehbach J, Gruber CW, Becker C, Kreil DP, Jilek A. 2016. MALDI TOF/TOF-based approach for the identification of d-amino acids in biologically active peptides and proteins. J Proteome Res. 15(5):1487–1496. doi: 10.1021/acs.jproteome.5b01067.
- Konstandi M, Johnson EO, Lang MA. 2022. Stress as a potential regulatory factor in the outcome of pharmacotherapy. Front Neurosci. 16:737716. doi: 10.3389/fnins.2022.737716.
- Kumar S. 2010. Engineering cytochrome P450 biocatalysts for biotechnology, medicine and bioremediation. Expert Opin Drug Metab Toxicol. 6(2):115–131. doi: 10.1517/17425250903431040.
- Kutsuno Y, Hirashima R, Sakamoto M, Ushikubo H, Michimae H, Itoh T, Tukey RH, Fujiwara R. 2015. Expression of UDP-glucuronosyltransferase 1 (UGT1) and glucuronidation activity toward endogenous substances in humanized UGT1 mouse brain. Drug Metab Dispos. 43(7):1071–1076. doi: 10.1124/dmd.115.063719.
- Kwan DH, Chen HM, Ratananikom K, Hancock SM, Watanabe Y, Kongsaeree PT, Samuels AL, Withers SG. 2011. Self-immobilizing fluorogenic imaging agents of enzyme activity. Angew Chem Int Ed Engl. 50(1):300–303. doi: 10.1002/anie.201005705.
- Lee AM, Jepson C, Hoffmann E, Epstein L, Hawk LW, Lerman C, Tyndale RF. 2007. CYP2B6 genotype alters abstinence rates in a bupropion smoking cessation trial. Biol Psychiatry. 62(6):635–641. doi: 10.1016/j.biopsych.2006.10.005.
- Lerman C, Shields PG, Wileyto EP, Audrain J, Pinto A, Hawk L, Krishnan S, Niaura R, Epstein L. 2002. Pharmacogenetic investigation of smoking cessation treatment. Pharmacogenet Genomics. 12(8):627–634. doi: 10.1097/00008571-200211000-00007.
- Liu M, Zhu Q, Wu J, Yu X, Hu M, Xie X, Yang Z, Yang J, Feng YQ, Yue J. 2017. Glutamate affects the production of epoxyeicosanoids within the brain: the up-regulation of brain CYP2J through the MAPK–CREB signaling pathway. Toxicology. 381:31–38. doi: 10.1016/j.tox.2017.02.008.
- Liu Y, Coughtrie MWH. 2017. Revisiting the latency of uridine diphosphate-glucuronosyltransferases (UGTs)—how does the endoplasmic reticulum membrane influence their function? Pharmaceutics. 9(3):32. doi: 10.3390/pharmaceutics9030032.
- Lu Y, Peng Q, Zeng Z, Wang J, Deng Y, Xie L, Mo C, Zeng J, Qin X, Li S. 2014. CYP2D6 phenotypes and Parkinson’s disease risk: a meta-analysis. J Neurol Sci. 336(1–2):161–168. doi: 10.1016/j.jns.2013.10.030.
- Mackenzie PI, Bock KW, Burchell B, Guillemette C, Ikushiro S, Iyanagi T, Miners JO, Owens IS, Nebert DW. 2005. Nomenclature update for the mammalian UDP glycosyltransferase (UGT) gene superfamily. Pharmacogenet Genomics. 15(10):677–685. doi: 10.1097/01.fpc.0000173483.13689.56.
- Magistretti PJ, Allaman I. 2015. A cellular perspective on brain energy metabolism and functional imaging. Neuron. 86(4):883–901. doi: 10.1016/j.neuron.2015.03.035.
- Mann A, Miksys SL, Gaedigk A, Kish SJ, Mash DC, Tyndale RF. 2012. The neuroprotective enzyme CYP2D6 increases in the brain with age and is lower in Parkinson’s disease patients. Neurobiol Aging. 33(9):2160–2171. doi: 10.1016/j.neurobiolaging.2011.08.014.
- Martignoni M, Groothuis GM, de Kanter R. 2006. Species differences between mouse, rat, dog, monkey and human CYP-mediated drug metabolism, inhibition and induction. Expert Opin Drug Metab Toxicol. 2(6):875–894. doi: 10.1517/17425255.2.6.875.
- Matsunaga E, Umeno M, Gonzalez FJ. 1990. The rat P450 IID subfamily: complete sequences of four closely linked genes and evidence that gene conversions maintained sequence homogeneity at the heme-binding region of the cytochrome P450 active site. J Mol Evol. 30(2):155–169. doi: 10.1007/BF02099942.
- McCann S, Pond S, James K, Le Couteur D. 1997. The association between polymorphisms in the cytochrome P-450 2D6 gene and Parkinson’s disease: a case-control study and meta-analysis. J Neurol Sci. 153(1):50–53. doi: 10.1016/s0022-510x(97)00179-2.
- McFadyen MCE, Melvin WT, Murray GI. 1998. Regional distribution of individual forms of cytochrome P450 mRNA in normal adult human brain. Biochem Pharmacol. 55(6):825–830. doi: 10.1016/s0006-2952(97)00516-9.
- McMillan D. 2018. Brain CYP2D metabolism of opioids impacts brain levels, analgesia, and tolerance [Doctoral dissertation]. University of Toronto, TSpace Repository. https://hdl.handle.net/1807/89858
- McMillan DM, Tyndale RF. 2018. CYP-mediated drug metabolism in the brain impacts drug response. Pharmacol Ther. 184:189–200. doi: 10.1016/j.pharmthera.2017.10.008.
- Meech R, Hu DG, McKinnon RA, Mubarokah SN, Haines AZ, Nair PC, Rowland A, Mackenzie PI. 2019. The UDP-glycosyltransferase (UGT) superfamily: new members, new functions, and novel paradigms. Physiol Rev. 99(2):1153–1222. doi: 10.1152/physrev.00058.2017.
- Meltzer HY. 1985. Long-term effects of neuroleptic drugs on the neuroendocrine system. Adv Biochem Psychopharmacol. 40:59–68.
- Meyer RP, Knoth R, Schiltz E, Volk B. 2001. Possible function of astrocyte cytochrome P450 in control of xenobiotic phenytoin in the brain: in vitro studies on murine astrocyte primary cultures. Exp Neurol. 167(2):376–384. doi: 10.1006/exnr.2000.7553.
- Meyer RP, Podvinec M, Meyer UA. 2002. Cytochrome P450 CYP1A1 accumulates in the cytosol of kidney and brain and is activated by heme. Mol Pharmacol. 62(5):1061–1067. doi: 10.1124/mol.62.5.1061.
- Miksys S, Hoffmann E, Tyndale RF. 2000. Regional and cellular induction of nicotine-metabolizing CYP2B1 in rat brain by chronic nicotine treatment. Biochem Pharmacol. 59(12):1501–1511. doi: 10.1016/s0006-2952(00)00281-1.
- Miksys S, Lerman C, Shields PG, Mash DC, Tyndale RF. 2003. Smoking, alcoholism and genetic polymorphisms alter CYP2B6 levels in human brain. Neuropharmacology. 45(1):122–132. doi: 10.1016/s0028-3908(03)00136-9.
- Miksys S, Rao Y, Hoffmann E, Mash DC, Tyndale RF. 2002. Regional and cellular expression of CYP2D6 in human brain: higher levels in alcoholics. J Neurochem. 82(6):1376–1387. doi: 10.1046/j.1471-4159.2002.01069.x.
- Miksys S, Rao Y, Sellers EM, Kwan M, Mendis D, Tyndale RF. 2000. Regional and cellular distribution of CYP2D subfamily members in rat brain. Xenobiotica. 30(6):547–564. doi: 10.1080/004982500406390.
- Miksys S, Tyndale RF. 2013. Cytochrome P450-mediated drug metabolism in the brain. J Psychiatry Neurosci. 38(3):152–163. doi: 10.1503/jpn.120133.
- Miksys S, Wadji FB, Tolledo EC, Remington G, Nobrega JN, Tyndale RF. 2017. Rat brain CYP2D enzymatic metabolism alters acute and chronic haloperidol side-effects by different mechanisms. Prog Neuropsychopharmacol Biol Psychiatry. 78:140–148. doi: 10.1016/j.pnpbp.2017.04.030.
- Miksys SL, Cheung C, Gonzalez FJ, Tyndale RF. 2005. Human CYP2D6 and mouse CYP2Ds: organ distribution in a humanized mouse model. Drug Metab Dispos. 33(10):1495–1502. doi: 10.1124/dmd.105.005488.
- Miksys SL, Tyndale RF. 2002. Drug-metabolizing cytochrome P450s in the brain. J Psychiatry Neurosci. 27(6):406–415.
- Miners JO, McKinnon RA, Mackenzie PI. 2002. Genetic polymorphisms of UDP-glucuronosyltransferases and their functional significance. Toxicology. 181–182:453–456. doi: 10.1016/s0300-483x(02)00449-3.
- Minn A, Ghersi-Egea JF, Perrin R, Leininger B, Siest G. 1991. Drug metabolizing enzymes in the brain and cerebral microvessels. Brain Res Brain Res Rev. 16(1):65–82. doi: 10.1016/0165-0173(91)90020-9.
- Morale MC, L’Episcopo F, Tirolo C, Giaquinta G, Caniglia S, Testa N, Arcieri P, Serra P-A, Lupo G, Alberghina M, et al. 2008. Loss of aromatase cytochrome P450 function as a risk factor for Parkinson’s disease? Brain Res Rev. 57(2):431–443. doi: 10.1016/j.brainresrev.2007.10.011.
- Morgan ET, Goralski KB, Piquette-Miller M, Renton KW, Robertson GR, Chaluvadi MR, Charles KA, Clarke SJ, Kacevska M, Liddle C, et al. 2008. Regulation of drug-metabolizing enzymes and transporters in infection, inflammation, and cancer. Drug Metab Dispos. 36(2):205–216. doi: 10.1124/dmd.107.018747.
- Morgan ET. 2009. Impact of infectious and inflammatory disease on cytochrome P450-mediated drug metabolism and pharmacokinetics. Clin Pharmacol Ther. 85(4):434–438. doi: 10.1038/clpt.2008.302.
- Morse DC, Stein AP, Thomas PE, Lowndes HE. 1998. Distribution and induction of cytochrome P450 1A1 and 1A2 in rat brain. Toxicol Appl Pharmacol. 152(1):232–239. doi: 10.1006/taap.1998.8477.
- Murray GI, Pritchard S, Melvin WT, Burke MD. 1995. Cytochrome P450 CYP3A5 in the human anterior pituitary gland. FEBS Lett. 364(1):79–82. doi: 10.1016/0014-5793(95)00367-i.
- Murray GI, Taylor MC, McFadyen MC, McKay JA, Greenlee WF, Burke MD, Melvin WT. 1997. Tumor-specific expression of cytochrome P450 CYP1B1. Cancer Res. 57(14):3026–3031.
- Muskhelishvili L, Thompson PA, Kusewitt DF, Wang C, Kadlubar FF. 2001. In situ hybridization and immunohistochemical analysis of cytochrome P450 1B1 expression in human normal tissues. J Histochem Cytochem. 49(2):229–236. doi: 10.1177/002215540104900210.
- Nagai K, Fukuno S, Suzuki H, Konishi H. 2016. Higher gene expression of CYP1A2, 2B1 and 2D2 in the brain of female compared with male rats. Pharmazie. 71(6):334–336.
- Nakajima M, Yamanaka H, Fujiwara R, Katoh M, Yokoi T. 2007. Stereoselective glucuronidation of 5-(4′-hydroxyphenyl)-5-phenylhydantoin by human UDP-glucuronosyltransferase (UGT) 1A1, UGT1A9, and UGT2B15: effects of UGT-UGT interactions. Drug Metab Dispos. 35(9):1679–1686. doi: 10.1124/dmd.107.015909.
- Navarro-Mabarak C, Loaiza-Zuluaga M, Hernández-Ojeda SL, Camacho-Carranza R, Espinosa-Aguirre JJ. 2020. Neuroinflammation is able to downregulate cytochrome P450 epoxygenases 2J3 and 2C11 in the rat brain. Brain Res Bull. 163:57–64. doi: 10.1016/j.brainresbull.2020.07.016.
- Neafsey P, Ginsberg G, Hattis D, Sonawane B. 2009. Genetic polymorphism in cytochrome P450 2D6 (CYP2D6): population distribution of CYP2D6 activity. J Toxicol Environ Health B Crit Rev. 12(5–6):334–361. doi: 10.1080/10937400903158342.
- Nebert DW, Russell DW. 2002. Clinical importance of the cytochromes P450. Lancet. 360(9340):1155–1162. doi: 10.1016/S0140-6736(02)11203-7.
- Nelson DR, Kamataki T, Waxman DJ, Guengerich FP, Estabrook RW, Feyereisen R, Gonzalez FJ, Coon MJ, Gunsalus IC, Gotoh O. 1993. The P450 superfamily: update on new sequences, gene mapping, accession numbers, early trivial names of enzymes, and nomenclature. DNA Cell Biol. 12(1):1–51. doi: 10.1089/dna.1993.12.1.
- Niwa T, Yanai M, Matsumoto M, Shizuku M. 2018. Effect of cytochrome P450 (CYP) 2D6 genetic polymorphism on the inhibitory action of antidepressants on CYP2D6-mediated dopamine formation from p-tyramine. J Pharm Pharm Sci. 21(1):135–142. doi: 10.18433/jpps29673.
- Norris PJ, Hardwick JP, Emson PC. 1996. Regional distribution of cytochrome P450 2D1 in the rat central nervous system. J Comp Neurol. 366(2):244–258. doi: 10.1002/(SICI)1096-9861(19960304)366:2<244::AID-CNE5>3.0.CO;2-5.
- Oguro A, Ishihara Y, Siswanto FM, Yamazaki T, Ishida A, Imaishi H, Imaoka S. 2021. Contribution of DHA diols (19,20-DHDP) produced by cytochrome P450s and soluble epoxide hydrolase to the beneficial effects of DHA supplementation in the brains of rotenone-induced rat models of Parkinson’s disease. Biochim Biophys Acta Mol Cell Biol Lipids. 1866(2):158858. doi: 10.1016/j.bbalip.2020.158858.
- Ohno S, Nakajin S. 2009. Determination of mRNA expression of human UDP-glucuronosyltransferases and application for localization in various human tissues by real-time reverse transcriptase-polymerase chain reaction. Drug Metab Dispos. 37(1):32–40. doi: 10.1124/dmd.108.023598.
- Oliw EH, Oates JA. 1981. Oxygenation of arachidonic acid by hepatic microsomes of the rabbit. Biochim Biophys Acta. 666(3):327–340. doi: 10.1016/0005-2760(81)90291-5.
- O’Malley K, Browning M, Stevenson I, Turnbull MJ. 1973. Stimulation of drug metabolism in man by tricyclic antidepressants. Eur J Clin Pharmacol. 6(2):102–106. doi: 10.1007/BF00562435.
- OuYang C, Chen B, Li L. 2015. High throughput in situ DDA analysis of neuropeptides by coupling novel multiplex mass spectrometric imaging (MSI) with gas-phase fractionation. J Am Soc Mass Spectrom. 26(12):1992–2001. doi: 10.1007/s13361-015-1265-0.
- Ouzzine M, Gulberti S, Ramalanjaona N, Magdalou J, Fournel-Gigleux S. 2014. The UDP-glucuronosyltransferases of the blood–brain barrier: their role in drug metabolism and detoxication. Front Cell Neurosci. 8:349. doi: 10.3389/fncel.2014.00349.
- Parkinson A, Mudra DR, Johnson C, Dwyer A, Carroll KM. 2004. The effects of gender, age, ethnicity, and liver cirrhosis on cytochrome P450 enzyme activity in human liver microsomes and inducibility in cultured human hepatocytes. Toxicol Appl Pharmacol. 199(3):193–209. doi: 10.1016/j.taap.2004.01.010.
- Pavek P, Dvorak Z. 2008. Xenobiotic-induced transcriptional regulation of xenobiotic metabolizing enzymes of the cytochrome P450 superfamily in human extrahepatic tissues. Curr Drug Metab. 9(2):129–143. doi: 10.2174/138920008783571774.
- Popat RA, Van Den Eeden SK, Tanner CM, Kamel F, Umbach DM, Marder K, Mayeux R, Ritz B, Ross GW, Petrovitch H, et al. 2011. Coffee, ADORA2A, and CYP1A2: the caffeine connection in Parkinson’s disease. Eur J Neurol. 18(5):756–765. doi: 10.1111/j.1468-1331.2011.03353.x.
- Preissner SC, Hoffmann MF, Preissner R, Dunkel M, Gewiess A, Preissner S. 2013. Polymorphic cytochrome P450 enzymes (CYPs) and their role in personalized therapy. PLOS One. 8(12):e82562. doi: 10.1371/journal.pone.0082562.
- Rackayova V, Cudalbu C, Pouwels PJW, Braissant O. 2017. Creatine in the central nervous system: from magnetic resonance spectroscopy to creatine deficiencies. Anal Biochem. 529:144–157. doi: 10.1016/j.ab.2016.11.007.
- Rane A, Liu Z, Levol R, Bjelfman C, Thyr C, Ericson H, Hansson T, Henderson C, Wolf CR. 1996. Differential effects of neuroleptic agents on hepatic cytochrome P-450 isozymes in the male rat. Biochim Biophys Acta. 1291(1):60–66. doi: 10.1016/0304-4165(96)00046-3.
- Ravindranath V, Anandatheerthavarada HK, Shankar SK. 1990. NADPH cytochrome P-450 reductase in rat, mouse and human brain. Biochem Pharmacol. 39(6):1013–1018. doi: 10.1016/0006-2952(90)90279-t.
- Renton KW. 2005. Regulation of drug metabolism and disposition during inflammation and infection. Expert Opin Drug Metab Toxicol. 1(4):629–640. doi: 10.1517/17425255.1.4.629.
- Rieder CR, Ramsden DB, Williams AC. 1998. Cytochrome P450 1B1 mRNA in the human central nervous system. Mol Pathol. 51(3):138–142. doi: 10.1136/mp.51.3.138.
- Rieder CRM, Parsons RB, Fitch NJS, Williams AC, Ramsden DB. 2000. Human brain cytochrome P450 1B1: immunohistochemical localization in human temporal lobe and induction by dimethylbenz(a)anthracene in astrocytoma cell line (MOG-G-CCM). Neurosci Lett. 278(3):177–180. doi: 10.1016/s0304-3940(99)00932-5.
- Riedl AG, Watts PM, Douek DC, Edwards RJ, Boobis AR, Rose S, Jenner P. 2000. Expression and distribution of CYP2C enzymes in rat basal ganglia. Synapse. 38(4):392–402. doi: 10.1002/1098-2396(20001215)38:4<392::AID-SYN4>3.0.CO;2-Z.
- Riedl AG, Watts PM, Edwards RJ, Schulz-Utermoehl T, Boobis AR, Jenner P, Marsden CD. 1999. Expression and localisation of CYP2D enzymes in rat basal ganglia. Brain Res. 822(1–2):175–191. doi: 10.1016/s0006-8993(99)01113-0.
- Rowland A, Miners JO, Mackenzie PI. 2013. The UDP-glucuronosyltransferases: their role in drug metabolism and detoxification. Int J Biochem Cell Biol. 45(6):1121–1132. doi: 10.1016/j.biocel.2013.02.019.
- Rupert AE, Ou Y, Sandberg M, Weber SG. 2013. Electroosmotic push–pull perfusion: description and application to qualitative analysis of the hydrolysis of exogenous galanin in organotypic hippocampal slice cultures. ACS Chem Neurosci. 4(5):838–848. doi: 10.1021/cn400082d.
- Sadakierska-Chudy A, Haduch A, Rysz M, Gołembiowska K, Daniel WA. 2013. The role of brain noradrenergic system in the regulation of liver cytochrome P450 expression. Biochem Pharmacol. 86(6):800–807. doi: 10.1016/j.bcp.2013.07.017.
- Sakakibara Y, Katoh M, Kondo Y, Nadai M. 2016. Effects of beta-naphthoflavone on Ugt1a6 and Ugt1a7 expression in rat brain. Biol Pharm Bull. 39(1):78–83. doi: 10.1248/bpb.b15-00578.
- Saleh MAA, Loo CF, Elassaiss-Schaap J, De Lange ECM. 2021. Lumbar cerebrospinal fluid-to-brain extracellular fluid surrogacy is context-specific: insights from LeiCNS-PK3.0 simulations. J Pharmacokinet Pharmacodyn. 48(5):725–741. doi: 10.1007/s10928-021-09768-7.
- Sasame HA, Ames MM, Nelson SD. 1977. Cytochrome P-450 and NADPH cytochrome C reductase in rat brain: formation of catechols and reactive catechol metabolites. Biochem Biophys Res Commun. 78(3):919–926. doi: 10.1016/0006-291x(77)90510-1.
- Sayers EW, Beck J, Bolton EE, Bourexis D, Brister JR, Canese K, Comeau DC, Funk K, Kim S, Klimke W, et al. 2021. Database resources of the National Center for Biotechnology Information. Nucleic Acids Res. 49(D1):D10–D17. doi: 10.1093/nar/gkaa892.
- Sayers EW, Bolton EE, Brister JR, Canese K, Chan J, Comeau DC, Connor R, Funk K, Kelly C, Kim S, et al. 2022. Database resources of the national center for biotechnology information. Nucleic Acids Res. 50(D1):D20–D26. doi: 10.1093/nar/gkab1112.
- Schilter B, Omiecinski CJ. 1993. Regional distribution and expression modulation of cytochrome P-450 and epoxide hydrolase mRNAs in the rat brain. Mol Pharmacol. 44(5):990–996.
- Sethy VH, Harris DW. 1982. Determination of biological activity of alprazolam, triazolam and their metabolites. J Pharm Pharmacol. 34(2):115–116. doi: 10.1111/j.2042-7158.1982.tb04197.x.
- Shelby MK, Cherrington NJ, Vansell NR, Klaassen CD. 2003. Tissue mRNA expression of the rat UDP-glucuronosyltransferase gene family. Drug Metab Dispos. 31(3):326–333. doi: 10.1124/dmd.31.3.326.
- Sheng Y, Yang H, Wu T, Zhu L, Liu L, Liu X. 2021. Alterations of cytochrome P450s and UDP-glucuronosyltransferases in brain under diseases and their clinical significances. Front Pharmacol. 12:650027. doi: 10.3389/fphar.2021.650027.
- Siegle I, Fritz P, Eckhardt K, Zanger UM, Eichelbaum M. 2001. Cellular localization and regional distribution of CYP2D6 mRNA and protein expression in human brain. Pharmacogenetics. 11(3):237–245. doi: 10.1097/00008571-200104000-00007.
- Simpson ER, Mahendroo MS, Means GD, Kilgore MW, Hinshelwood MM, Graham-Lorence S, Amarneh B, Ito Y, Fisher CR, Michael MD. 1994. Aromatase cytochrome P450, the enzyme responsible for estrogen biosynthesis. Endocr Rev. 15(3):342–355.
- Singh S, Singh K, Patel DK, Singh C, Nath C, Singh VK, Singh RK, Singh MP. 2009. The expression of CYP2D22, an ortholog of human CYP2D6, in mouse striatum and its modulation in 1-methyl 4-phenyl-1,2,3,6-tetrahydropyridine-induced Parkinson’s disease phenotype and nicotine-mediated neuroprotection. Rejuvenat Res. 12(3):185–197. doi: 10.1089/rej.2009.0850.
- Sjöstedt E, Zhong W, Fagerberg L, Karlsson M, Mitsios N, Adori C, Oksvold P, Edfors F, Limiszewska A, Hikmet F, et al. 2020. An atlas of the protein-coding genes in the human, pig, and mouse brain. Science. 367(6482). doi: 10.1126/science.aay5947.
- Smith HS. 2009. Opioid metabolism. Mayo Clin Proc. 84(7):613–624. doi: 10.1016/S0025-6196(11)60750-7.
- Song Y, Li C, Liu G, Liu R, Chen Y, Li W, Cao Z, Zhao B, Lu C, Liu Y. 2021. Drug-metabolizing cytochrome P450 enzymes have multifarious influences on treatment outcomes. Clin Pharmacokinet. 60(5):585–601. doi: 10.1007/s40262-021-01001-5.
- Šrejber M, Navrátilová V, Paloncýová M, Bazgier V, Berka K, Anzenbacher P, Otyepka M. 2018. Membrane-attached mammalian cytochromes P450: an overview of the membrane’s effects on structure, drug binding, and interactions with redox partners. J Inorg Biochem. 183:117–136. doi: 10.1016/j.jinorgbio.2018.03.002.
- Stamou M, Wu X, Kania-Korwel I, Lehmler HJ, Lein PJ. 2014. Cytochrome p450 mRNA expression in the rodent brain: species-, sex-, and region-dependent differences. Drug Metab Dispos. 42(2):239–244. doi: 10.1124/dmd.113.054239.
- Stavropoulou E, Pircalabioru GG, Bezirtzoglou E. 2018. The role of cytochromes P450 in infection. Front Immunol. 9:89. doi: 10.3389/fimmu.2018.00089.
- Stolerman IP, Jarvis M. 1995. The scientific case that nicotine is addictive. Psychopharmacology. 117(1):2–10. doi: 10.1007/BF02245088.
- Stone AN, Mackenzie PI, Galetin A, Houston JB, Miners JO. 2003. Isoform selectivity and kinetics of morphine 3- and 6-glucuronidation by human UDP-glucuronosyltransferases: evidence for atypical glucuronidation kinetics by UGT2B7. Drug Metab Dispos. 31(9):1086–1089. doi: 10.1124/dmd.31.9.1086.
- Suleman FG, Ghersi-Egea JF, Leininger-Muller B, Minn A. 1993. Uridine diphosphate-glucuronosyltransferase activities in rat brain microsomes. Neurosci Lett. 161(2):219–222. doi: 10.1016/0304-3940(93)90298-y.
- Suzuki T, Mihara K, Nagai G, Kagawa S, Nakamura A, Nemoto K, Kondo T. 2019. Relationship between UGT1A4 and UGT2B7 polymorphisms and the steady-state plasma concentrations of lamotrigine in patients with treatment-resistant depressive disorder receiving lamotrigine as augmentation therapy. Ther Drug Monit. 41(1):86–90. doi: 10.1097/FTD.0000000000000577.
- Swinney R, Hsu S, Tomlinson G. 2006. Phase I and phase II enzyme polymorphisms and childhood cancer. J Investig Med. 54(6):303–320. doi: 10.2310/6650.2006.05062.
- Sychev DA, Ashraf GM, Svistunov AA, Maksimov ML, Tarasov VV, Chubarev VN, Otdelenov VA, Denisenko NP, Barreto GE, Aliev G. 2018. The cytochrome P450 isoenzyme and some new opportunities for the prediction of negative drug interaction in vivo. Drug Des Devel Ther. 12:1147–1156. doi: 10.2147/DDDT.S149069.
- Thelen K, Dressman JB. 2009. Cytochrome P450-mediated metabolism in the human gut wall. J Pharm Pharmacol. 61(5):541–558. doi: 10.1211/jpp/61.05.0002.
- Thuerl C, Otten U, Knoth R, Meyer RP, Volk B. 1997. Possible role of cytochrome P450 in inactivation of testosterone in immortalized hippocampal neurons. Brain Res. 762(1–2):47–55. doi: 10.1016/s0006-8993(97)00259-x.
- Tindberg N, Bengtsson I, Hu Y. 2004. A novel lipopolysaccharide-modulated Jun binding repressor in intron 2 of CYP2E1. J Neurochem. 89(6):1336–1346. doi: 10.1111/j.1471-4159.2004.02449.x.
- Tirumalai PS, Bhamre S, Upadhya SC, Boyd MR, Ravindranath V. 1998. Expression of multiple forms of cytochrome P450 and associated mono-oxygenase activities in rat brain regions. Biochem Pharmacol. 56(3):371–375. doi: 10.1016/s0006-2952(98)00036-7.
- Togna AR, Antonilli L, Dovizio M, Salemme A, De Carolis L, Togna GI, Patrignani P, Nencini P. 2013. In vitro morphine metabolism by rat microglia. Neuropharmacology. 75:391–398. doi: 10.1016/j.neuropharm.2013.08.019.
- Toselli F, Booth Depaz IM, Worrall S, Etheridge N, Dodd PR, Wilce PA, Gillam EM. 2015. Expression of CYP2E1 and CYP2U1 proteins in amygdala and prefrontal cortex: influence of alcoholism and smoking. Alcohol Clin Exp Res. 39(5):790–797. doi: 10.1111/acer.12697.
- Tyndale RF, Li Y, Li NY, Messina E, Miksys S, Sellers EM. 1999. Characterization of cytochrome P-450 2D1 activity in rat brain: high-affinity kinetics for dextromethorphan. Drug Metab Dispos. 27(8):924–930.
- Ur Rasheed MS, Mishra AK, Singh MP. 2017. Cytochrome P450 2D6 and Parkinson’s disease: polymorphism, metabolic role, risk and protection. Neurochem Res. 42(12):3353–3361. doi: 10.1007/s11064-017-2384-8.
- van den Brink WJ, Wong YC, Gülave B, van der Graaf PH, de Lange ECM. 2017. Revealing the neuroendocrine response after remoxipride treatment using multi-biomarker discovery and quantifying it by PK/PD modeling. AAPS J. 19(1):274–285. doi: 10.1208/s12248-016-0002-3.
- Vandooren J, Geurts N, Martens E, Van den Steen PE, Opdenakker G. 2013. Zymography methods for visualizing hydrolytic enzymes. Nat Methods. 10(3):211–220. doi: 10.1038/nmeth.2371.
- Vences-Mejía A, Gómez-Garduño J, Caballero-Ortega H, Dorado-González V, Nosti-Palacios R, Labra-Ruíz N, Espinosa-Aguirre JJ. 2012. Effect of mosquito mats (pyrethroid-based) vapor inhalation on rat brain cytochrome P450s. Toxicol Mech Methods. 22(1):41–46. doi: 10.3109/15376516.2011.591448.
- Vences-Mejía A, Labra-Ruíz N, Hernández-Martínez N, Dorado-González V, Gómez-Garduño J, Pérez-López I, Nosti-Palacios R, Camacho Carranza R, Espinosa-Aguirre JJ. 2006. The effect of aspartame on rat brain xenobiotic-metabolizing enzymes. Hum Exp Toxicol. 25(8):453–459. doi: 10.1191/0960327106het646oa.
- Voirol P, Jonzier-Perey M, Porchet F, Reymond MJ, Janzer RC, Bouras C, Strobel HW, Kosel M, Eap CB, Baumann P. 2000. Cytochrome P-450 activities in human and rat brain microsomes. Brain Res. 855(2):235–243. doi: 10.1016/s0006-8993(99)02354-9.
- Volk B, Meyer RP, von Lintig F, Ibach B, Knoth R. 1995. Localization and characterization of cytochrome P450 in the brain. In vivo and in vitro investigations on phenytoin- and phenobarbital-inducible isoforms. Toxicol Lett. 82–83:655–662. doi: 10.1016/0378-4274(95)03511-7.
- Wahlström A, Winblad B, Bixo M, Rane A. 1988. Human brain metabolism of morphine and naloxone. Pain. 35(2):121–127. doi: 10.1016/0304-3959(88)90219-9.
- Walther B, Ghersi-Egea JF, Minn A, Siest G. 1986. Subcellular distribution of cytochrome P-450 in the brain. Brain Res. 375(2):338–344. doi: 10.1016/0006-8993(86)90754-7.
- Wang H, Kawashima H, Strobel HW. 1996. cDNA cloning of a novel CYP3A from rat brain. Biochem Biophys Res Commun. 221(1):157–162. doi: 10.1006/bbrc.1996.0562.
- Wang Q, Zuo Z. 2018. Impact of transporters and enzymes from blood–cerebrospinal fluid barrier and brain parenchyma on CNS drug uptake. Expert Opin Drug Metab Toxicol. 14(9):961–972. doi: 10.1080/17425255.2018.1513493.
- Wang Y, Zagorevski DV, Lennartz MR, Loegering DJ, Stenken JA. 2009. Detection of in vivo matrix metalloproteinase activity using microdialysis sampling and liquid chromatography/mass spectrometry. Anal Chem. 81(24):9961–9971. doi: 10.1021/ac901703g.
- Weissleder R, Tung CH, Mahmood U, Bogdanov AJr. 1999. In vivo imaging of tumors with protease-activated near-infrared fluorescent probes. Nat Biotechnol. 17(4):375–378. doi: 10.1038/7933.
- Wishart DS, Feunang YD, Guo AC, Lo EJ, Marcu A, Grant JR, Sajed T, Johnson D, Li C, Sayeeda Z, et al. 2018. DrugBank 5.0: a major update to the DrugBank database for 2018. Nucleic Acids Res. 46(D1):D1074–D1082. doi: 10.1093/nar/gkx1037.
- Wójcikowski J, Haduch A, Daniel WA. 2013. Effect of antidepressant drugs on cytochrome P450 2C11 (CYP2C11) in rat liver. Pharmacol Rep. 65(5):1247–1255. doi: 10.1016/s1734-1140(13)71482-8.
- Woodland C, Huang TT, Gryz E, Bendayan R, Fawcett JP. 2008. Expression, activity and regulation of CYP3A in human and rodent brain. Drug Metab Rev. 40(1):149–168. doi: 10.1080/03602530701836712.
- Wu J, Xu K, Landers JP, Weber SG. 2013. An in situ measurement of extracellular cysteamine, homocysteine, and cysteine concentrations in organotypic hippocampal slice cultures by integration of electroosmotic sampling and microfluidic analysis. Anal Chem. 85(6):3095–3103. doi: 10.1021/ac302676q.
- Yamada H, Ishii K, Ishii Y, Ieiri I, Nishio S, Morioka T, Oguri K. 2003. Formation of highly analgesic morphine-6-glucuronide following physiologic concentration of morphine in human brain. J Toxicol Sci. 28(5):395–401. doi: 10.2131/jts.28.395.
- Yamazaki H, Inoue K, Hashimoto M, Shimada T. 1999. Roles of CYP2A6 and CYP2B6 in nicotine C-oxidation by human liver microsomes. Arch Toxicol. 73(2):65–70. doi: 10.1007/s002040050588.
- Yu X, Wu J, Hu M, Wu J, Zhu Q, Yang Z, Xie X, Feng YQ, Yue J. 2019. Glutamate affects the CYP1B1- and CYP2U1-mediated hydroxylation of arachidonic acid metabolism via astrocytic mGlu5 receptor. Int J Biochem Cell Biol. 110:111–121. doi: 10.1016/j.biocel.2019.03.001.
- Yu Y, Fuscoe JC, Zhao C, Guo C, Jia M, Qing T, Bannon DI, Lancashire L, Bao W, Du T, et al. 2014. A rat RNA-Seq transcriptomic BodyMap across 11 organs and 4 developmental stages. Nat Commun. 5(1):3230. doi: 10.1038/ncomms4230.
- Yue F, Cheng Y, Breschi A, Vierstra J, Wu W, Ryba T, Sandstrom R, Ma Z, Davis C, Pope BD, et al. 2014. A comparative encyclopedia of DNA elements in the mouse genome. Nature. 515(7527):355–364. doi: 10.1038/nature13992.
- Yue J, Khokhar J, Miksys S, Tyndale RF. 2009. Differential induction of ethanol-metabolizing CYP2E1 and nicotine-metabolizing CYP2B1/2 in rat liver by chronic nicotine treatment and voluntary ethanol intake. Eur J Pharmacol. 609(1–3):88–95. doi: 10.1016/j.ejphar.2009.03.015.
- Yueh MF, Mellon PL, Tukey RH. 2011. Inhibition of human UGT2B7 gene expression in transgenic mice by the constitutive androstane receptor. Mol Pharmacol. 79(6):1053–1060. doi: 10.1124/mol.110.070649.
- Zaphiropoulos PG, Wood T. 1993. Identification of the major cytochrome P450s of subfamily 2C that are expressed in brain of female rats and in olfactory lobes of ethanol treated male rats. Biochem Biophys Res Commun. 193(3):1006–1013. doi: 10.1006/bbrc.1993.1725.
- Zhang ZQ, Sheng L, Li Y. 2016. Drug glucuronidation and disposition in brain. Yao Xue Xue Bao. 51(11):1674–1680.
- Zhao M, Ma J, Li M, Zhang Y, Jiang B, Zhao X, Huai C, Shen L, Zhang N, He L. 2021. Cytochrome P450 enzymes and drug metabolism in humans. Int J Mol Sci. 22(23):12808.
- Zhou S-F, Liu J-P, Chowbay B. 2009. Polymorphism of human cytochrome P450 enzymes and its clinical impact. Drug Metab Rev. 41(2):89–295. doi: 10.1080/03602530902843483.