
 ?Mathematical formulae have been encoded as MathML and are displayed in this HTML version using MathJax in order to improve their display. Uncheck the box to turn MathJax off. This feature requires Javascript. Click on a formula to zoom.
Abstract
Objective
To investigate the in-situ physicochemical interaction of Rifampicin and Ritonavir - Lopinavir Solid dispersion administered for the treatment of comorbid conditions i.e. Tuberculosis and HIV/AIDS.
Methods
pH-shift dissolution of Rifampicin (RIF) in presence of Ritonavir-Lopinavir solid dispersion (RL-SD) was carried out in USP phosphate buffer 6.8 and FaSSIF. Equilibrium and amorphous solubility were determined for the drugs. Pure drugs, their physical mixtures, and pH-shifted co-precipitated samples were characterized using DSC, PXRD, and FTIR. Fluorescence spectroscopy was used to investigate drug-rich and drug-lean phases. In-vitro and ex-vivo flux studies were also carried out.
Results
The results showed significant differences in the solubility and dissolution profiles of RTV and LOP in the presence of RIF, while RIF profile remained unchanged. Amorphicity, intermolecular interaction and aggregate formation in pH-shifted samples were revealed in DSC, XRD and FTIR analysis. Fluorescence spectroscopy confirmed the formation of drug-rich phase upon pH-shift. In-vitro and ex-vivo flux studies revealed significant reduction in the flux of all the drugs when studied in presence of second drug.
Conclusion
RIF, RTV and LOP in presence of each other on pH-shift, results in co-precipitation in the amorphous form (miscible) which leads to reduction in the highest attainable degree of supersaturation. This reduction corresponds to the mole fraction of the RIF, RTV and LOP within the studied system. These findings suggest that the concomitant administration of these drugs may lead to physicochemical interactions and possible ineffective therapy.
Introduction
As per World Health Organization (WHO), in year 2021, Tuberculosis (TB) caused an estimated 1.4 million fatalities while comorbid HIV/TB caused ∼187,000 deaths (cumulative 1.6 million deaths) [Citation1]. Rifampicin, Isoniazid, Ethambutol, and Pyrazinamide are the first-line drugs against TB [Citation2]. Lopinavir/Ritonavir protease inhibitors are the second-line anti-retrovirals for the treatment of HIV and HIV/TB cases [Citation3,Citation4]. As TB and HIV are comorbid conditions, the treatment regimen includes concomitant administration of Rifampicin and Lopinavir/Ritonavir [Citation5]. One of the challenges of treating TB-infected HIV patients is the treatment regimen due to polypharmacy [Citation6]. Rifampicin is a powerful inducer of cytochrome P450A enzyme which metabolizes many HIV drugs including Lopinavir/Ritonavir. Rifampicin promotes the efflux of the drugs from cells by P-glycoprotein expression [Citation7]. Lopinavir/Ritonavir combination has been clinically explored in different ratios to explore maximum efficacy [Citation2,Citation3,Citation8]. Rifampicin can exist in different forms depending on the solution pH. Studies have reported that zwitterionic form of rifampicin exists (predominantly between pH 3.0–7.4), due to ansa ring structure, deprotonation of carboxylic acid moiety, and protonation of the nitrogen atom in the piperidine ring [Citation9–14]. This leads to a high possibility of the formation of intra/intermolecular interaction(s), molecular and/or inclusion complex formation [Citation15,Citation16]. Compounds like Ritonavir and Lopinavir have ∼11-15 hydrogen acceptor sites and ∼3–6 hydrogen donor sites which can likely form H-bonds with Rifampicin. Studies have shown that, on pH-shift of Rifampicin, amorphous precipitates are formed which are molecular aggregates of Rifampicin [Citation17]. Physicochemical interactions of drugs given concomitantly/FDCs may play a part in the formation of molecular aggregates, inclusion or supramolecular complexes and drug rich phase. The drug rich phase of individual molecules may or may not interact with each other and affect each other’s concentration. If one of the drug rich phases formed is more lipophilic than the other, probability of physicochemical interaction is more. In case of ideal mixing of multiple drugs in drug rich phase, free drug concentration and chemical potential is changed. If the chemical potential of the components decreases, it is proportional to mole fraction of each component present in the system [Citation18–20]. Such proportional lowering of maximum attainable supersaturation has been observed in multicomponent system of Ritonavir-Lopinavir [Citation19,Citation21,Citation22], Ritonavir-Atazanavir [Citation23], Ritonavir-Darunavir [Citation24], and Rifampicin-Pioglitazone [Citation17].
Solubility and dissolution are paramount factors affecting the bioavailability of drugs. For weakly basic drugs with pKa of 5–8 (like RTV, LOP, and RIF), due to the varied pH throughout the gastrointestinal tract (1–2 to 5–7), pH-dependent solubility can be observed [Citation25–29]. At higher GIT pH, weakly basic compounds would exist as unionized species and precipitate. If the precipitates do not crystallize immediately, it will lead to a supersaturated condition, keeping the solution concentration at the level of amorphous solubility. This in-vivo supersaturation can increase the availability of drug and thereby increase the bioavailability of the drug at the site [Citation30]. Several studies have shown that amorphous solubility is maintained for some drugs which undergo rapid supersaturation [Citation22,Citation31–34]. Research has also shown that drug-rich phase formed within the solution has the capability to interact with other compounds present in the solution [Citation17,Citation22,Citation32]. Recently researchers have also found similar observations in ASDs of RTV[Citation35–37] and RTV-LOP [Citation38,Citation39]. Similarly, concomitantly administered drugs and FDCs can be affected by this phenomenon, leading to delivery of lower dose of either one or both the drugs depending on their individual physicochemical property and extent of supersaturation [Citation32,Citation40]. This drastically affects the supersaturation and solution phase behavior of the drug system. In order to investigate this phenomenon in co-administered drug system, Rifampicin (RIF) in presence of Ritonavir-Lopinavir solid dispersion (RL-SD) was considered.
Materials
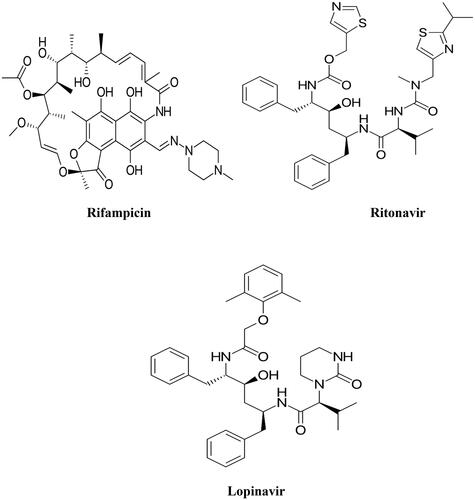
RIF, RTV, and LOP () was a gift sample from Lupin Ltd., Tarapur, and Micro Labs Ltd, Bengaluru, India. Acetonitrile and methanol (HPLC grade) were obtained from Merck Life Sciences Private Limited, India. Regenerated cellulose semipermeable dialysis membrane with a molecular weight cutoff of 3.5 Dalton was purchased from Spectrum Laboratories, Inc., USA. Ready-to-use biorelevant media FaSSIF was purchased from Biorelevant.com, Mumbai, India.
Figure 1. Chemical structures of Rifampicin (RIF), Ritonavir (RTV), and Lopinavir (LOP).
Methods
Solubility parameter calculation
The van krevelen group contribution approach was used to calculate solubility parameters (δ) for RIF, RTV, LOP, and PVP VA 64, with cohesive energy serving as an indicator of attractive forces between constituent molecules in a system. The sum of three types of forces, namely dispersion forces (Ed), polar forces (Ep), and hydrogen bonding (Eh), is considered the total cohesive energy. Solubility parameter was calculated using the equation:
(Equation 1)
(Equation 1)
Fdi: molar attraction constant due to dispersive components; Fpi: dipole–dipole interactions; Ehi: hydrogen bonding contribution in the chemical structure; and Vm is the molar volume [Citation22,Citation24, Citation41–44].
Preparation of RL-SD
RL-SD was prepared using the quench cooling technique [Citation22]. RTV and LOP were taken in ratios similar to the marketed formulation (). For 250 mg of the solid dispersion, weighed 12.5 mg of RTV, 50 mg of LOP, and 187.5 mg of polyvinylpyrrolidone/vinyl acetate (PVP-VA 64) in a porcelain crucible and uniformly mixed [Citation39]. The mixture was melted in a heating mantle with a steady increase in temperature of 10 °C/minute. The resulting molten mixture in the porcelain crucible was transferred into a glass desiccator that had been pre-cooled. This desiccator was then tightly sealed and placed inside − 80 °C freezer for a duration for 4 h. The obtained sample was further processed by pulverizing finely using a ceramic mortar and pestle. The amorphous material was stored in a vacuum desiccator under dry condition until further use [Citation22].
Table 1. Dose of marketed formulations.
Measurement of equilibrium solubility and amorphous solubility
Equilibrium solubility of RIF, RTV, and LOP in USP phosphate buffer pH 6.8 was ascertained using shake flask technique. In each vial excess amount of the respective drugs were added to 3 ml of phosphate buffer and agitated using an orbital shaker (Remi C24) at 37 °C, 120 rpm for 24h. Subsequently, the suspensions were centrifugation at 10,000 rpm for 10 min; the supernatant was diluted with the diluent (mobile phase) & analyzed using the HPLC method [Citation22].
Assessment of the amorphous solubility of the RIF, RTV and LOP was done by the solvent quench method. A concentration of 10 mg/mL of methanolic solution of the respective drugs were spiked (100 μL) in to pH 6.8 USP phosphate buffer (10 ml) containing HPMC (10 μg/mL) as a crystallization inhibitor. The solution was stirred for 10 min at 37 °C, samples were taken, centrifuged at 10,000 rpm/10 min, supernatant was diluted using diluent and analyzed by HPLC [Citation22].
RP-HPLC
For RP-HPLC analysis, Purospher® STAR RP-18 endcapped-Hibar®RT (250 × 4.6 mm ID x 5 µm) column was used. The mobile phase constituted a mixture of acetonitrile and 20 mM disodium hydrogen phosphate buffer pH 6.8 (55:45% v/v), isocratically delivered at a flow rate of 1.0 ml/min. The column was kept at 30 °C, and UV detection was performed at 220 nm and 254 nm. The developed method was validated as per ICHQ2(R1) guidelines. The chromatographic conditions for the simultaneous estimation of RIF, and RL-SD are given in .
Table 2. Chromatographic conditions for the simultaneous estimation of RIF, RTV, and LOP.
Solid-State characterization of pure drugs, their physical mixtures, and pH-shifted co-precipitated sample
For pH-shifted co-precipitated sample preparation, refer the method in supersaturation studies
X-ray diffraction (XRPD)
Using a Rigaku miniflex 600 X-ray diffractometer, XRPD patterns were acquired. The instrument was configured to run at 600 watts for the X-ray tube, a steady tube current of 15 mA and voltage of 40 kV. The instrument had a graphite monochromator while the detector was standard scintillation counter. Diffraction intensities were recorded using a fixed time step scanning approach spanning from 5–80° (2ϴ) [Citation17].
Differential scanning calorimetry (DSC)
Shimadzu DT-60 apparatus was used to record DSC thermograms. Approximately 5 mg of the prepared substance was carefully measured and placed into a flat bottom aluminum pan (thickness 0.1 mm). The pan was sealed with an aluminum lid, loaded into the sample holder and subjected to a controlled heating process, starting from 25 °C and gradually increasing to 300 °C at 10 °C per minute, all while maintaining a constant nitrogen flow of 10 cc/minute [Citation17].
Fourier Transform Infrared Spectroscopy (FTIR)
FTIR spectra spanning the range from 4000 to 500 cm−1 were acquired for the samples using a Shimadzu FTIR IR Affinity-1 spectrophotometer (25 scans with a resolution of 4 cm−1). Sample disks were prepared in KBr by compressing under ∼1000 psig [Citation17].
Fluorescence probe method
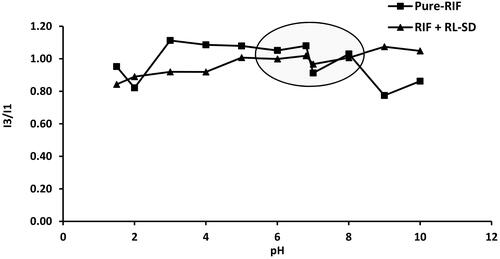
Fluorescence tests were performed using a Shimadzu spectro-fluorophotometer [Citation45]. Pyrene was utilized as a probe to detect the change in surrounding chemical environment. From 1 mg/mL methanolic pyrene stock, 0.202 µg/mL solution of pyrene was prepared using diluent 100 mM phosphate buffer (pH 1.5). Supersaturated solutions of RIF, and RIF + RL-SD were prepared in 100 ml of diluent, pH was shifted gradually using KOH solution. Samples were collected at various pH levels: 1.5, 2.0, 3.0, 4.0, 5.0, 6.0, 6.8, 7.0, 8.0, 9.0, and 10.0. The analysis involved placing the sample in a quartz cuvette with a path length of 1 cm. An excitation wavelength of 339 nm was used and the emission spectrum was observed between 350 - 450 nm. Depending on the polarity of the surrounding, pyrene exhibits multiple peaks in this spectral region. The ratio of the intensity of emission peak at 384 nm (I3) and the peak at 373 nm (I1) was used, and this ratio was plotted against the pH of the drug solution [Citation45].
Supersaturation studies: Supersaturation assay in phosphate buffer solution (PBS), FaSSIF media by pH-shift method
RIF, RL-SD, and RIF in presence of RL-SD (RIF + RL-SD) were studied for supersaturation assay using the pH-shift method [Citation17]. Drug equivalent to the highest dosage available in the market was allowed to equilibrate under stirring in 5 ml 0.1 N HCl (pH 1.5) at 37 °C for 10 min. After the initial 10-min (time-T0), the first sample was collected. Subsequently, this bulk solution was transferred into 15 ml of 50 mM KH2PO4 buffer adjusted the pH to 6.8 using KOH. The stirring process continued at 37 °C for an additional 120 min. Similarly, supersaturation assay in pH 6.8 FaSSIF media was performed. Samples were taken at specific time intervals: 0, 5, 10, 15, 30, 45, 60, 90, and 120 min. These collected samples were centrifuged for 10 min, 10,000 rpm at 37 °C. The resulting supernatants were diluted and subjected to HPLC[Citation17].
Flux Studies
In-vitro flux Studies
Diffusion investigation was conducted using Franz diffusion cell apparatus employing a semipermeable regenerated cellulose dialysis membrane with an effective surface area of 4.2cm2. In the donor compartment, 3 ml pH-shifted solutions containing RIF, RL-SD, and RIF + RL-SD in FaSSIF media was placed. The receiver compartment was loaded with 15 ml of USP phosphate buffer (pH 6.8), agitation of 60 rpm at 37 °C. A precise temperature-control magnetic stirrer was used for the study. At 0, 5, 10, 15, 30, 45, 60, 90, 120 min samples were withdrawn from receiver compartment and processed for analysis by HPLC17. Diffusion/flux at mentioned time points were found out by using the following formula,
(Equation 2)
(Equation 2)
where dc/dt is the rate of change of concentration in the receiver compartment and A is the area available for permeation [Citation17,Citation41].
Ex-vivo flux studies
Ex-vivo experiments were carried using male Wistar rats with body weight of 220 ± 10 mg. These experiments adhered with the guidelines established by the Committee for the Purpose of the Control and Supervision of Experiments on Animals (CPSEA) and received approval from the Institutional Animal Ethics Committee (IAEC/KMC/126/2020) of Manipal Academy of Higher Education (MAHE). The test animals were subjected to a fasting period of 12–16h before the study. Following the study, animals were euthanised by cervical dislocation. An incision along the midline of the abdomen was made to access and extract the small intestine, which was then rinsed with saline solution. By cutting ∼5cm above the ileo-cecal junction, the ileum segment was obtained. A 3 cm length ileal segment was taken, washed and prepared for subsequent experiments. To investigate the absorption flux from mucosal to serosal side, the ileal segment was securely tied to a receptor tube, while the distal end was tightly ligated to establish a sealed compartment. To maintain the segment in a vertical position during the whole experiment, a clean stainless-steel weight was suspended from the distal end. The prepped segments were hung in the permeation assembly, which was filled with 60 ml pH-shifted test solution. The pH-shifted test solution consisted of drugs RIF, RL-SD, and RIF + RL-SD, equivalent to the highest marketed dose, equilibrated in 60 ml of Krebs Ringer Buffer (KRB) maintained at pH 7.4. The complete assembly was kept at a steady temperature of 37 °C under continuous oxygen in the donor compartment to preserve tissue viability. The receiver compartment, which consisted of the everted sac, was filled with 1.5 ml KRB. Samples were collected from approximately the midpoint of the sac at 5, 10, 15, 30, 45, 60, 90, and 120 min using a syringe attached to long-necked oral gavage. Following each withdrawal, an equal volume of KRB was immediately replenished [Citation17]. Flux was found out by using Equation 2, where, represents the rate of change in the concentration at the serosal side, and A is the area of the ileum (Sac) available for permeation [Citation41].
Results
Solubility parameter calculation
Hansen approach by van krevelen group contribution method was used to study the miscibility and theoretical solubility parameter of drugs. The contributions of polarity δp, dispersibility δd, and hydrogen bonding δh are considered for the calculation. The solubility parameter value, δ for RIF, RTV, LOP was obtained as 20.15, 17.57 and 23.47 Mpa1/2 respectively. The system shows complete miscibility as difference in the calculated solubility parameter value (Δδ) was found be less than 7 Mpa1/2 [Citation41–44]. Also, the δ value of PVP-VA64 was found to be 23.07, indicating the miscibility between the RTV, LOP, and the polymer [Citation46–48] ().
Table 3. Solubility parameter calculation for RIF, RTV, LOP and PVP VA using Hansen solubility parameter method.
Preparation of RL-SD
After sample preparation, 98.8% yield of RL-SD was obtained, which was used for subsequent experiments.
Measurement of equilibrium solubility and amorphous solubility
In USP pH 6.8 phosphate buffer, the crystalline solubility of RIF was found to be 2799 ± 89.0 µg/mL and amorphous solubility was found to be 3398 ± 50.25 µg/mL. In the case of RTV and LOP, crystalline solubility was 12 ± 4.40 µg/mL and 8.6 ± 0.80 µg/mL, respectively. Amorphous solubility of RTV and LOP was found to be 40 ± 0.30 µg/mL and 18 ± 0.60 µg/mL respectively ().
Table 4. Experimental solubility data of pure RIF, RTV, and LOP (n = 3).
Solid-State characterization of the pure drugs, their physical mixtures, and pH-shifted co-precipitated samples
X-ray diffraction (XRPD)
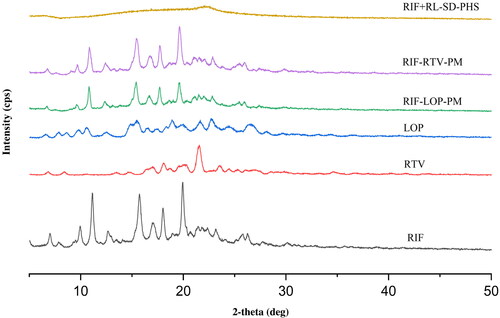
The diffraction patterns for RIF, RTV, LOP, RIF- RTV-PM, RIF-LOP-PM, and RIF + RL-SD-PHS (co-precipitated sample) are represented in . Evident Bragg’s diffraction pattern was noted for RIF, RTV, LOP, and their physical mixture signifying the existence of a crystalline phase. Diffractograms with diffused halo pattern for the pH-shifted co-precipitated sample of RIF + RL-SD indicated disordered amorphous phase.
Figure 2. X-ray diffractograms of RIF, RTV, LOP, RIF-LOP-PM, RIF-RTV-PM, and RIF + RL-SD-PHS.
Differential scanning calorimetry (DSC)
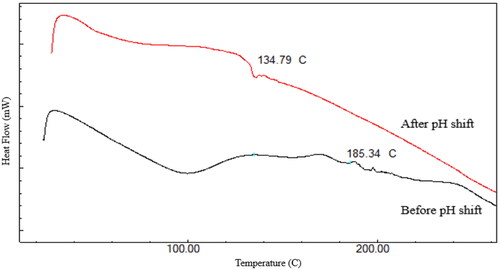
represents, the thermograms of RIF in presence of RL-SD co-precipitate obtained before and after the pH-shift. Before pH-shift, there is no precipitation resulting in minimum effect of RIF seen on the thermogram of RIF + RL-SD. Endothermic peaks are not observed in the before pH-shift sample as physical mixture of the RIF and RL-SD shows miscibility. The thermogram shows that the after pH-shift precipitate is in an amorphous disordered phase when compared to before pH-shift sample.
Figure 3. Overlay of DSC thermogram of before and after pH-shifted sample of RIF in presence of RL-SD.
Fourier transform infrared spectroscopy (FTIR)
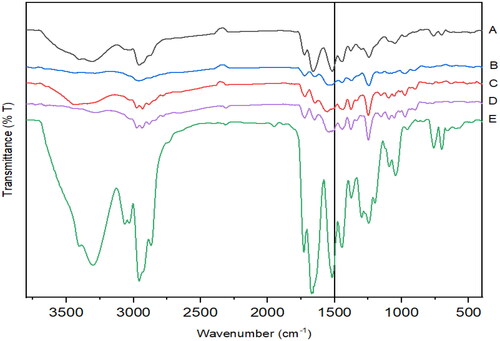
FTIR spectra of RL-SD shows strong broad peaks from 3200–3500 cm−1, indicating O-H stretching which is attributed to the intermolecular interaction between RTV and LOP due to co-amorphization. Between 2800–3000 cm−1, a strong broad N-H stretch of amide linkage is observed which is attributed to carbonyl functional groups like amide and esters in RTV and LOP. The broad peaks at 1664 cm−1 and 1519 cm−1 may be due to amide stretching. The aforementioned spectral pattern can also be observed in RIF + RL-SD sample after pH-shift [Citation12]. A weak broad peak was observed between 2750–3000 cm−1 in RIF-RTV-PM & RL-SD but absent in RIF-LOP-PM. These observations suggest that intermolecular interactions are observed in the pH-shifted sample of RIF + RL-SD ().
Figure 4. Overlay of FTIR spectra of A. RIF + RL-SD-PHS, B. RIF-LOP-PM, C. RIF-RTV-PM, D. RIF and E. RL–SD.
Fluorescence probe method
An elevated ratio of I3/I1 indicates an increase in the formation of lipophilic drug phase. For pure RIF initially a lower I3/I1 value is observed, and eventually on pH-shift and increase in the pH till pH 6.8, the ratio of I3/I1 is maintained (). This indicates that the drug-rich phase formed on pH-shift is maintained. However, RIF in presence of RL-SD shows a decreased ratio of I3/I1 when compared to pure RIF, indicating the interaction of drug-rich phases of RIF and RL-SD.
Figure 5. Possible interaction(s) of RIF with RL-SD in amorphous phase on pH-shift.
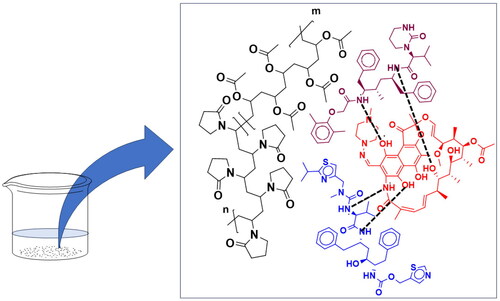
Figure 6. Schematic for interaction of RIF and RL-SD drug rich phase during the dissolution.
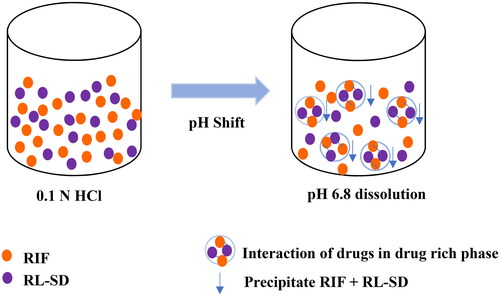
Figure 7. pH-shift Fluorescence pyrene probe method for RIF and RIF + RL–SD.
Supersaturation studies: Supersaturation assay in phosphate buffer solution (PBS), FaSSIF media by pH-shift method
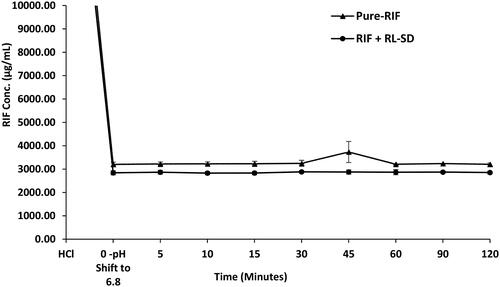
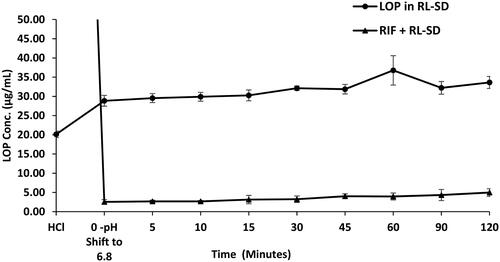
RIF pure exhibited nearly 16.9-fold higher solubility in 0.1 N HCl than in USP phosphate buffer pH 6.8 and FaSSIF media. The order of RIF solubility was observed as, 0.1 N HCL > USP phosphate buffer > FaSSIF, with statistically significant differences in the solubility of each system (p < 0.05, unpaired t-test). Notably, presence of RL-SD had no impact on the dissolution of RIF in both USP phosphate buffer pH 6.8 and FaSSIF. The molar solubility of pure RIF and RIF in presence of RL-SD was calculated based on the obtained solubility value in USP phosphate buffer pH 6.8. Even in terms of molar concentration, no significant difference was observed for RIF. indicates the amorphous solubility and molar solubility of RIF in PBS. Similarly, in case of FaSSIF supersaturation assay for pure RIF and RIF in presence of RL-SD, the RIF concentration was maintained well within the amorphous solubility. The dissolution gap between the RIF in presence of RL-SD and RIF pure was minimized to a 1-fold difference; which was found to be statistically insignificant (p > 0.05, unpaired t-test) (). These results indicated that RL-SD did not have any significant impact on the amorphous solubility or molar solubility of RIF.
Figure 8. Supersaturation assay of RIF in pure RIF, and RIF + RL–SD in PBS (n = 3).
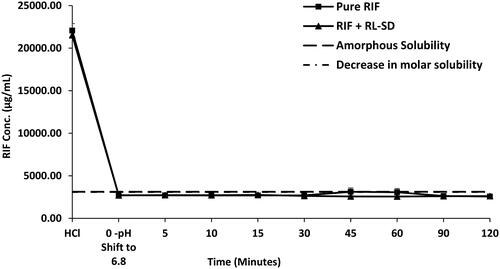
Figure 9. Supersaturation assay of RIF in pure-RIF, and RIF + RL–SD in FaSSIF (n = 3).
In case of RL-SD, when studied in USP phosphate buffer pH 6.8, amorphous solubility of RTV was maintained at 40 µg/mL (). On pH-shift, significant reduction with 2.5-fold decrease of RTV concentration was observed when RL-SD was studied in presence of RIF (p < 0.05, unpaired t-test). For LOP in RL-SD, 12.5-fold decrease in the concentration of LOP was observed when compared with RL-SD in presence of RIF in USP buffer (p < 0.05, unpaired t-test), represented in . In FaSSIF media, a significant 3.4-fold decrease (p < 0.05, unpaired t-test) in RTV concentration in RL-SD was observed in presence of RIF (). Similarly, a 9.0-fold decline in the LOP concentration was observed when RL-SD was studied in presence with RIF (). The reductions in the molar solubilities was significantly notable for RTV and LOP in presence of RIF, underscoring that the reduction in chemical potential of the drug is directly related to respective mole fraction within the system.
Figure 10. Supersaturation assay of RTV in RL-SD, and RIF + RL-SD in PBS (n = 3).
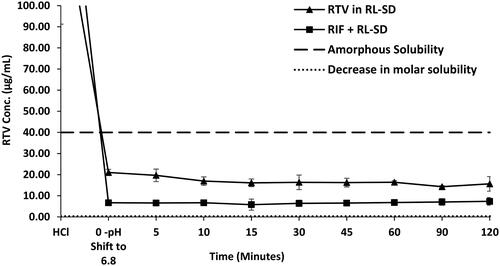
Figure 11. Supersaturation assay of LOP in RL-SD, and RIF + RL-SD in PBS (n = 3).
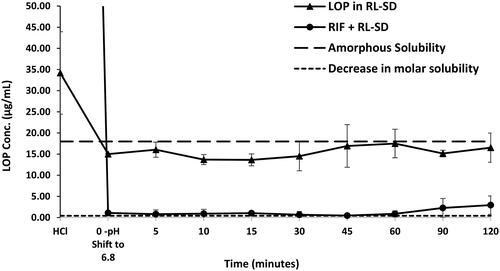
Figure 12. Supersaturation assay of RTV in RL-SD, and RIF + RL–SD in FaSSIF (n = 3).
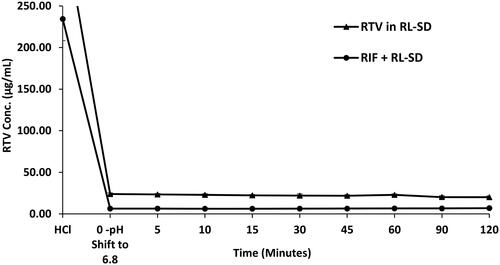
Figure 13. Supersaturation assay of LOP in RL-SD, and RIF + RL–SD in FaSSIF (n = 3).
Flux Studies
In-vitro flux/diffusion Studies
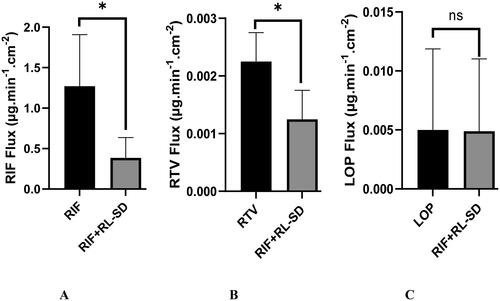
Approximately 2-fold decrease in the flux of RIF was observed in presence of RL-SD when compared to RIF pure. The decrease in flux/diffusion of RTV and LOP in presence of RIF, when compared to pure RL-SD was found to be 4.2-fold and 2.1-fold, respectively (). Significant decrease in the flux of all the molecules was observed when studied in presence of each other (p < 0.05, unpaired t-test). The higher flux for the pH-shifted pure sample is due to higher solubility and higher gradient across the permeable membrane.
Figure 14. In-vitro flux study of A. RIF in pure RIF & RIF + RL–SD, B. RTV in RL-SD & RIF + RL–SD & C. LOP in RL-SD & RIF + RL–SD (*-statistically significant; n = 3).
Ex-vivo flux Studies
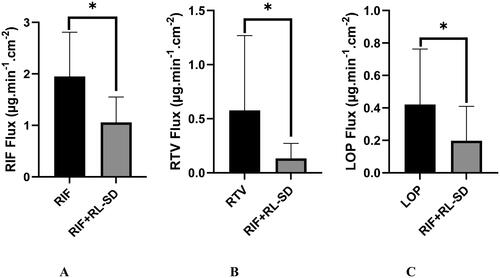
illustrates the flux of pure RIF, RTV and LOP and the effect of RIF and RL-SD on each other after pH-shift. Notably, individual drugs exhibited maximal flux/diffusion, whereas the presence of second drug(s) in the same solution led to a reduction of the flux/diffusion. A statistically significant 3.2-fold reduction in the RIF flux was observed in presence of RL-SD when compared to pure RIF (p < 0.05, unpaired t-test). Likewise, the RTV flux demonstrated a significant decrease of 1.7-fold in RIF + RL-SD when compared with RL-SD (p < 0.05, unpaired t-test). These results align with the in-vitro flux data for both RIF and RTV. This drop in permeability of both drugs correlates with the concentration of the free drug(s) observed during the pH-shift dissolution experiments. However, the decrease in LOP flux in RIF + RL-SD was only 1-fold and found to be insignificant when compared with the LOP in RL-SD (p > 0.05, unpaired t-test).
Figure 15. Ex-vivo flux study of A. RIF in pure RIF & RIF + RL–SD, B. RTV in RL-SD & RIF + RL–SD & C. LOP in RL-SD & RIF + RL–SD (*-statistically significant & ‘ns’-statistical insignificance; n = 3).
Discussion
Pharmacokinetic and pharmacodynamic interactions are studied extensively in literature when compared to the physicochemical interactions of drugs which are administered for comorbid conditions. Due to the unique physiology of the GIT, physicochemical interactions between drugs is possible even before their entry into the blood stream. These types of interactions can lead to altered absorption of the drug(s) and are rarely studied. During multi-drug therapy, these effects are elevated. Drugs with pH dependent solubility and pKa of 3 to 7 are most affected due to physicochemical interaction. As pH shifts from acidic to basic in the gastric lumen, unionized form of the weakly basic drugs predominates. Drugs with pKa of 4–7 precipitate in the neutral environment of the intestine [Citation28,Citation50]. The precipitated phase can exist in 2 different form based on the arrangement of molecule in the phase - either a crystalline which is type-1 or an amorphous precipitate which is type 2 precipitate. Mostly, amorphous precipitate of weakly basic drug is formed in the intestine, which leads to inadvertent consequences [Citation51].
Rifampicin can exist in different forms depending on the pH of the solution. Studies have reported that rifampicin exists in zwitterionic form due to ansa ring structure, deprotonation of the carboxylic acid moiety, and protonation of the nitrogen atom in the piperidine ring, which is prominently observed in between pH 3.0 to 7.4 [Citation9–14]. Due to this structure, a high possibility of the formation of intra/intermolecular interaction, molecular complex, and inclusion complex is observed with Rifampicin [Citation15,Citation16]. As mentioned previously, studies have shown on pH-shift (from lower to higher) of Rifampicin, amorphous precipitates are formed, which are the molecular aggregates of Rifampicin [Citation17]. Compounds like Ritonavir and Lopinavir has ∼11-15 numbers of hydrogen acceptor sites and ∼3–6 hydrogen donor sites which can likely form hydrogen bonds with the ansa ring/carboxylic acid/piperidine ring in Rifampicin ( and ). In the current study, we observed that on pH-shift, RIF in presence of RL-SD precipitated in amorphous form. This is observed when the drugs are studied in presence of each other and not when drugs are pH-shifted individually. This amorphous precipitate is probably observed due to formation of intermolecular hydrogen bonding interaction between RIF and RL-SD (). The precipitation of RIF and RL-SD in presence of each other, after pH-shift from pH 1.5 to 6.8 can be classified as type-2 precipitate. The formation of amorphous phase is indicated by a single glass transition temperature in the thermogram of after pH-shifted sample which also shows phase solubility. This phase solubility is also theoretically proven using Hansen solubility parameter value (). For after pH-shift sample, glass transition temperature may be underneath the dehydration endotherm from 50 to 100 °C [Citation17]. The amorphous nature of pH-shifted sample is also proven in the diffractogram. In this study, the formation of type-2 precipitate led to decrease in the concentration of RTV and LOP in presence of RIF in PBS as well as FaSSIF. However, no decrease in the concentration of RIF was observed in presence of RL-SD. The elevated solubility of RIF in acidic medium is attributed to the protonation of carboxylic acid group within the RIF molecule. Nevertheless, precipitation became apparent after shifting from lower pH to higher pH i.e. shift from 0.1 N HCl to USP phosphate buffer pH 6.8, and biorelevant media [Citation52]. This suggests molecular aggregate formation of RIF and RIF in presence of RL-SD at higher pH levels [Citation17]. To understand the decrease in the molar solubility on pH-shift for pure RIF and in combination with RL-SD, the following formula was used.
(Equation 3)
(Equation 3)
Where, is the solubility of RIF from multicomponent drug systems,
is the solubility of amorphous RIF form, and X is the mole fraction of the RIF in the multi-component drug system [Citation32]. Similarly, the decrease in molar solubility of RTV and LOP was also calculated. The reduction in the molar solubility was significantly notable for RTV and LOP, underscoring that the reduction in chemical potential of the drug is directly related to respective mole fraction within the system. In the presence of RIF, a remarkable reduction in the solubility of RTV & LOP suggest the formation of molecular aggregates involving RIF via intermolecular interaction [Citation17]. Consequently, this results in the creation of drug-rich phase and influences the phase solubility of the RTV and LOP in presence of RIF. A comparable finding has been reported by Sakhare et al. where a pH-shift from lower to higher pH results in Saquinavir and RTV forming a unified homogenous phase [Citation32]. Studies have reported the use of environment-sensitive pyrene probe to comprehend the development of drug-rich phases [Citation19,Citation24]. Both RTV and LOP in presence of RIF precipitated when transitioning from lower to higher pH due to their weakly basic nature, leading to emergence of drug-rich phase of the drug [Citation32]. The interaction of drug-rich phase of all the 3 drugs can be observed with change in the ratio of I3/I1 when studied in presence of each other.
Bioavailability of a drug depends on both its permeability and solubility, making them critical factors [Citation52]. An optimal diffusion pattern is distinguished by an initial lag time, during which the permeation rate gradually increases, leading to a subsequent establishment of a consistent flux at a steady state [Citation50]. An approximately 2-fold decrease in the in-vitro flux of RIF, 4.2-fold decrease in RTV and 2.1-fold decrease in LOP was observed when studied in presence of each other. The higher flux for the pH-shifted pure sample is due to higher solubility and higher gradient across the permeable membrane [Citation17]. However, pH-shifted solution containing drug rich phase of RTV and LOP could be interacting with RIF and the formation of molecular aggregates using hydrogen bonding creates an environment where the availability of the free drug is very less for the permeation (). Studies have indicated that there is a high probability of impact of CYP3A4 and the efflux protein P-glycoprotein on RIF pure, RL-SD, and RIF in presence of RL-SD flux when studied using everted intestinal sac method [Citation53]. Individual drugs exhibited maximal flux/diffusion, whereas the presence of RIF and RL-SD in the same solution led to a reduction of their flux/diffusion. This highlights the substantial impact of the drug-rich phase’s on flux/diffusion. Similar results were observed in in-vitro flux studies for saquinavir [Citation32].
In case of ex-vivo studies, a 3.2-fold reduction in the RIF flux in presence of RL-SD was found to be statistically significant. Likewise, the flux of RTV demonstrated a significant decrease in presence of RIF, aligning with the in-vitro flux data of RIF and RTV. This drop in the permeability correlates with the concentration of the free drug observed during the pH-shift dissolution experiments. Intriguingly, the reduction in the LOP flux/diffusion was found to be insignificant when compared to the SD counterpart, contradicting with its in-vitro flux data. This incongruity is explained by the generation of a lesser amount of drug-rich LOP phase in ex-vivo studies. These results indicate that RIF and RTV may have significant impact on each other’s bioavailability on clinical administration. Multiple studies have reported flux reduction of RTV and LOP in the multi-component solution-phase, unlike the flux observed for the individual amorphous drugs [Citation17,Citation19,Citation23,Citation24]. With the decrease in the solubility and flux of the drugs in a multidrug therapy like TB and HIV, delivering a sub-therapeutic range of the drug for long term can lead to complications. This makes the management of therapies challenging as this may lead to treatment failure.
Conclusions
The solution phase behavior of RIF, and RL-SD was studied using pH-shift dissolution. RIF, RTV, and LOP were found to precipitate in amorphous forms on shift in pH from 1.5 to 6.8, generating a supersaturated state. It was observed that the supersaturation benefit of RTV and LOP is reduced in the presence of RIF. From a thermodynamic and kinetic perspective, the presence of drugs that precipitates in amorphous-drug rich phase are miscible with each other. This results in a reduction in the highest attainable degree of supersaturation. The present study proves that the reduction in the supersaturation corresponds to the mole fraction of the RIF, RTV, and LOP. This is also reflected in the in-vitro and ex-vivo flux studies. These findings bear significance as they indicate potential occurrence of physicochemical interactions among concomitantly administered drugs, as well as for treatment involving fixed-dose combinations in in-situ conditions. Such circumstances could potentially result in failure of extended therapeutic interventions.
Authors’ contributions
Athira R Nair: investigation, experimentation, data curation, conceptualization, and writing of original draft; Vullendula Sai Krishna Anand, Dani Lakshman Yarlagadda, Bheemisetty Brahmam: experimentation, reviewing, Swapnil J. Dengale: conceptualization, and supervision, Krishnamurthy Bhat: conceptualization, reviewing, and supervision.
Acknowledgments
The authors would like to acknowledge Lupin Limited and Hetero Drugs Limited for providing gift samples of drugs for the research. The authors would also like to acknowledge that this research work was presented as poster in Manipal Research Colloquium (MRC 2023), Manipal Academy of Higher Education, Manipal by the same authors.
Disclosure statement
The authors declare that there are no conflicts of interest regarding the publication of this article.
Additional information
Funding
References
- Global Tuberculosis reporT 2022. 2022.
- Grobbelaar M, Louw GE, Sampson SL, et al. Evolution of rifampicin treatment for tuberculosis. Infect Genet Evol. 2019;74:103937. doi: 10.1016/j.meegid.2019.103937.
- Bobat R. HIV infection in children and adolescents. Cham: Springer International Publishing; 2020.
- Masquelier B, Breilh D, Neau D, et al. Human immunodeficiency virus type 1 genotypic and pharmacokinetic determinants of the virological response to lopinavir-ritonavir-containing therapy in protease inhibitor-experienced patients. Antimicrob Agents Chemother. 2002;46(9):2926–2932. doi: 10.1128/AAC.46.9.2926-2932.2002.
- Dean GL, Edwards SG, Ives NJ, et al. Treatment of tuberculosis in HIV-infected persons in the era of highly active antiretroviral therapy. AIDS. 2002;16(1):75–83. doi: 10.1097/00002030-200201040-00010.
- Singh S, Mariappan TT, Sankar R, et al. A critical review of the probable reasons for the poor/variable bioavailability of rifampicin from anti-tubercular fixed-dose combination (FDC) products, and the likely solutions to the problem. 2001;228(1–2):5–17. doi: 10.1016/s0378-5173(01)00754-2.
- Abulfathi AA, Decloedt EH, Svensson EM, et al. Clinical pharmacokinetics and pharmacodynamics of rifampicin in human tuberculosis. Clin Pharmacokinet. 2019;58(9):1103–1129. doi: 10.1007/s40262-019-00764-2.
- McIlleron H, Meintjes G, Burman WJ, et al. Complications of antiretroviral therapy in patients with tuberculosis: drug interactions, toxicity, and immune reconstitution inflammatory syndrome. J Infect Dis. 2007;196 (Suppl 1):S63–75. doi: 10.1086/518655.
- Becker C, Dressman JB, Junginger HE, et al. Biowaiver monographs for immediate release solid oral dosage forms: rifampicin. J Pharm Sci. 2009;98(7):2252–2267. doi: 10.1002/jps.21624.
- de Pinho Pessoa Nogueira L, de Oliveira YS, de C. Fonseca J, et al. Crystalline structure of the marketed form of rifampicin: a case of conformational and charge transfer polymorphism. J Mol Struct. 2018;1155:260–266. doi: 10.1016/j.molstruc.2017.10.083.
- Gadret M, Goursolle M, Leger JM, et al. Structure cristalline de la rifampicine C43N4O12H58.5H2O. Acta Crystallogr B Struct Crystallogr Cryst Chem. 1975;31(5):1454–1462. doi: 10.1107/S0567740875005407.
- Przybylski P, Pyta K, Klich K, et al. 13C and 15N CP/MAS, 1H-15N SCT CP/MAS and FTIR spectroscopy as tools for qualitative detection of the presence of zwitterionic and nonionic forms of ansa-macrolide 3-formylrifamycin SV and its derivatives in solid state+. Magn Reson Chem. 2014;52(1-2):10–21. doi: 10.1002/mrc.4028.
- Pyta K, Przybylski P, Wicher B, et al. Intramolecular proton transfer impact on antibacterial properties of ansamycin antibiotic rifampicin and its new amino analogues. Org Biomol Chem. 2012;10(12):2385–2388. doi: 10.1039/c2ob00008c.
- Wicher B, Pyta K, Przybylski P, et al. Redetermination of rifampicin penta-hydrate revealing a zwitterionic form of the anti-biotic. Acta Crystallogr C. 2012;68(5):209–212.
- Henwood SQ, Liebenberg W, Tiedt LR, et al. Characterization of the solubility and dissolution properties of several new rifampicin polymorphs. Solvates Hydrates. 2001;27(10):1017–1030. doi: 10.1081/ddc-100108364.
- Angiolini L, Agnes M, Cohen B, et al. Formation, characterization and pH dependence of rifampicin: heptakis(2,6-di-O-methyl)-β-cyclodextrin complexes. Int J Pharm. 2017;531(2):668–675. doi: 10.1016/j.ijpharm.2017.06.015.
- Londhe O, Sanjay Mane S, Umesh Hirlekar B, et al. In vitro, in-vivo, and in-silico investigation of physicochemical interactions between pioglitazone and rifampicin. Eur J Pharm Biopharm. 2023;188:54–65. doi: 10.1016/j.ejpb.2023.05.006.
- Hurst S, Loi C-M, Brodfuehrer J, et al. Impact of physiological, physicochemical and biopharmaceutical factors in absorption and metabolism mechanisms on the drug oral bioavailability of rats and humans. Expert Opin Drug Metab Toxicol. 2007;3(4):469–489. doi: 10.1517/17425255.3.4.469.
- Trasi NS, Taylor LS. Thermodynamics of highly supersaturated aqueous solutions of poorly Water-Soluble Drugs - Impact of a second drug on the solution phase behavior and implications for combination products. J Pharm Sci. 2015;104(8):2583–2593. doi: 10.1002/jps.24528.
- Taylor LS, Zhang GGZ. Physical chemistry of supersaturated solutions and implications for oral absorption. Adv Drug Deliv Rev. 2016;101:122–142. doi: 10.1016/j.addr.2016.03.006.
- Trasi NS, Taylor LS. Dissolution performance of binary amorphous drug combinations - Impact of a second drug on the maximum achievable supersaturation. Int J Pharm. 2015;496(2):282–290. doi: 10.1016/j.ijpharm.2015.10.026.
- Sai Krishna Anand V, Sakhare SD, Navya Sree KS, et al. The relevance of co-amorphous formulations to develop supersaturated dosage forms: in-vitro, and ex-vivo investigation of Ritonavir-Lopinavir co-amorphous materials. Eur J Pharm Sci. 2018;123:124–134. doi: 10.1016/j.ejps.2018.07.046.
- Alhalaweh A, Bergström CAS, Taylor LS. Compromised in vitro dissolution and membrane transport of multidrug amorphous formulations. J Control Release. 2016;229:172–182. doi: 10.1016/j.jconrel.2016.03.028.
- Shete S, Reddy SC, Lakshman YD, et al. Implications of phase solubility/miscibility and drug-rich phase formation on the performance of co-amorphous materials: the case of darunavir co-amorphous materials with ritonavir and indomethacin as co-formers. Int J Pharm. 2021;608:121119. doi: 10.1016/j.ijpharm.2021.121119.
- Sugawara M, Kadomura S, He X, et al. The use of an in vitro dissolution and absorption system to evaluate oral absorption of two weak bases in pH-independent controlled-release formulations. Eur J Pharm Sci. 2005;26(1):1–8. doi: 10.1016/j.ejps.2005.02.017.
- Kostewicz ES, Brauns U, Becker R, et al. Forecasting the oral absorption behavior of poorly soluble weak bases using solubility and dissolution studies in biorelevant media. Pharm Res. 2002;19(3):345–349. doi: 10.1023/a:1014407421366.
- Vertzoni M, Dressman J, Butler J, et al. Simulation of fasting gastric conditions and its importance for the in vivo dissolution of lipophilic compounds. Eur J Pharm Biopharm. 2005;60(3):413–417. doi: 10.1016/j.ejpb.2005.03.002.
- Hsieh YL, Ilevbare GA, Van Eerdenbrugh B, et al. PH-Induced precipitation behavior of weakly basic compounds: determination of extent and duration of supersaturation using potentiometric titration and correlation to solid state properties. Pharm Res. 2012;29(10):2738–2753. doi: 10.1007/s11095-012-0759-8.
- Culen M, Rezacova A, Jampilek J, et al. Designing a dynamic dissolution method: a review of instrumental options and corresponding physiology of stomach and small intestine. J Pharm Sci. 2013;102(9):2995–3017. doi: 10.1002/jps.23494.
- Psachoulias D, Vertzoni M, Goumas K, et al. Precipitation in and supersaturation of contents of the upper small intestine after administration of two weak bases to fasted adults. Pharm Res. 2011;28(12):3145–3158. doi: 10.1007/s11095-011-0506-6.
- Indulkar AS, Gao Y, Raina SA, et al. Exploiting the phenomenon of liquid–liquid phase separation for enhanced and sustained membrane transport of a poorly water-soluble drug. Mol Pharm. 2016;13(6):2059–2069. doi: 10.1021/acs.molpharmaceut.6b00202.
- Sakhare SD, Anand VSK, Karan A, et al. The assessment of pH-induced supersaturation and impact of an additional drug on the solution phase behavior of saquinavir. J Pharm Innov. 2019;14(4):305–315. doi: 10.1007/s12247-018-9357-6.
- Sugihara H, Taylor LS. Evaluation of pazopanib phase behavior following pH-induced supersaturation. Mol Pharm. 2018;15(4):1690–1699. doi: 10.1021/acs.molpharmaceut.8b00081.
- Mosquera-Giraldo LI, Taylor LS. Glass-liquid phase separation in highly supersaturated aqueous solutions of telaprevir. Mol Pharm. 2015;12(2):496–503. doi: 10.1021/mp500573z.
- Siriwannakij N, Heimbach T, Serajuddin ATM. Aqueous dissolution and dispersion behavior of polyvinylpyrrolidone vinyl acetate-based amorphous solid dispersion of ritonavir prepared by hot-melt extrusion with and without added surfactants. J Pharm Sci. 2021;110(4):1480–1494. doi: 10.1016/j.xphs.2020.08.007.
- Wu H, Wang Z, Zhao Y, et al. Effect of different seed crystals on the supersaturation state of ritonavir tablets prepared by hot-melt extrusion. Eur J Pharm Sci. 2023;185:106440. doi: 10.1016/j.ejps.2023.106440.
- Zhao Y, Xie X, Zhao Y, et al. Effect of plasticizers on manufacturing ritonavir/copovidone solid dispersions via hot-melt extrusion: preformulation, physicochemical characterization, and pharmacokinetics in rats. Eur J Pharm Sci. 2019;127:60–70. doi: 10.1016/j.ejps.2018.10.020.
- Moreira Pinheiro LB, Tao S, Culbertson E, et al. Evaluation of the polymorphic forms of ritonavir and lopinavir in raw materials and co-milled systems. Int J Pharm. 2022;628:122329. doi: 10.1016/j.ijpharm.2022.122329.
- Trasi NS, Bhujbal S, Zhou QT, et al. Amorphous solid dispersion formation via solvent granulation – a case study with ritonavir and lopinavir. Int J Pharm X. 2019;1:100035. doi: 10.1016/j.ijpx.2019.100035.
- Chegireddy M, Hanegave GK, Lakshman D, et al. The significance of utilizing in vitro transfer model and media selection to study the dissolution performance of weak ionizable bases: investigation using saquinavir as a model drug. AAPS PharmSciTech. 2020;21(2):47. doi: 10.1208/s12249-019-1563-0.
- Yarlagadda DL, Anand VSK, Nair AR, et al. A computational-based approach to fabricate ceritinib co-amorphous system using a novel co-former rutin for bioavailability enhancement. Eur J Pharm Biopharm. 2023;190:220–230. doi: 10.1016/j.ejpb.2023.07.019.
- Lakshman D, Chegireddy M, Hanegave GK, et al. Investigation of drug-polymer miscibility, biorelevant dissolution, and bioavailability improvement of dolutegravir-polyvinyl caprolactam-polyvinyl acetate-polyethylene glycol graft copolymer solid dispersions. Eur J Pharm Sci. 2020;142:105137. doi: 10.1016/j.ejps.2019.105137.
- Greenhalgh DJ, Williams AC, Timmins P, et al. Solubility parameters as predictors of miscibility in solid dispersions. J Pharm Sci. 1999;88(11):1182–1190. doi: 10.1021/js9900856.
- Forster A, Hempenstall J, Tucker I, et al. Selection of excipients for melt extrusion with two poorly water-soluble drugs by solubility parameter calculation and thermal analysis. Int J Pharm. 2001;226(1–2):147–161. doi: 10.1016/s0378-5173(01)00801-8.
- Purohit HS, Taylor LS. Phase separation kinetics in amorphous solid dispersions upon exposure to water. Mol Pharm. 2015;12(5):1623–1635. doi: 10.1021/acs.molpharmaceut.5b00041.
- Chiou WL, Keyphrases SR. Pharmaceutical applications of solid dispersion systems solid dispersion systems-review 0 dispersions, solid systems-review 0 absorption kinetics-solid dispersion systems, review dosage forms, fast-release solid dispersion systems. Rev Cont. 1971;60(9):1281–302. doi: 10.1002/jps.2600600902.
- Zi P, Zhang C, Ju C, et al. Solubility and bioavailability enhancement study of lopinavir solid dispersion matrixed with a polymeric surfactant - Soluplus. Eur J Pharm Sci. 2019;134:233–245. doi: 10.1016/j.ejps.2019.04.022.
- Bhanderi A, Bari F, Al-Obaidi H. Evaluation of the impact of surfactants on miscibility of griseofulvin in spray dried amorphous solid dispersions. J Drug Deliv Sci Technol. 2021;64:102606. doi: 10.1016/j.jddst.2021.102606.
- Henwood SQ, De Villiers MM, Liebenberg W, et al. Solubility and dissolution properties of generic rifampicin raw materials. Drug Dev Ind Pharm. 2000;26(4):403–408. doi: 10.1081/ddc-100101246.
- Bevernage J, Brouwers J, Annaert P, et al. Drug precipitation-permeation interplay: supersaturation in an absorptive environment. Eur J Pharm Biopharm. 2012;82(2):424–428. doi: 10.1016/j.ejpb.2012.07.009.
- Baird JA, Van Eerdenbrugh B, Taylor LS. A classification system to assess the crystallization tendency of organic molecules from undercooled melts. J Pharm Sci. 2010;99(9):3787–3806. doi: 10.1002/jps.22197.
- Lipinski CA, Lombardo F, Dominy BW, et al. Experimental and computational approaches to estimate solubility and permeability in drug discovery and development q settings. Adv Drug Deliv Rev. 2001;46(1–3):3–26. doi: 10.1016/s0169-409x(00)00129-0.
- Mariappan TT, Singh S. Evidence of efflux-mediated and saturable absorption of rifampicin in rat intestine using the ligated loop and everted gut sac techniques. Mol Pharm. 2004;1(5):363–367. doi: 10.1021/mp049937n.