
 ?Mathematical formulae have been encoded as MathML and are displayed in this HTML version using MathJax in order to improve their display. Uncheck the box to turn MathJax off. This feature requires Javascript. Click on a formula to zoom.
Abstract
Objective
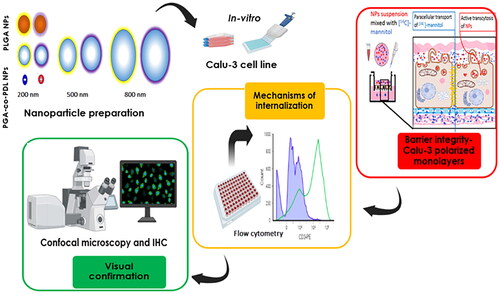
The study evaluated physicochemical properties of eight different polymeric nanoparticles (NPs) and their interaction with lung barrier and their suitability for pulmonary drug delivery.
Methods
Eight physiochemically different NPs were fabricated from Poly lactic-co-glycolic acid (PLGA, PL) and Poly glycerol adipate-co-ω-pentadecalactone (PGA-co-PDL, PG) via emulsification-solvent evaporation. Pulmonary barrier integrity was investigated in vitro using Calu-3 under air-liquid interface. NPs internalization was investigated using a group of pharmacological inhibitors with subsequent microscopic visual confirmation.
Results
Eight NPs were successfully formulated from two polymers using emulsion-solvent evaporation; 200, 500 and 800 nm, negatively-charged and positively-charged. All different NPs did not alter tight junctions and PG NPs showed similar behavior to PL NPs, indicating its suitability for pulmonary drug delivery. Active endocytosis uptake mechanisms with physicochemical dependent manner were observed. In addition, NPs internalization and co-localization with lysosomes were visually confirmed indicating their vesicular transport.
Conclusion
PG and PL NPs had shown no or low harmful effects on the barrier integrity, and with effective internalization and vesicular transport, thus, prospectively can be designed for pulmonary delivery applications.
Graphiacl Abstract
Introduction
Pulmonary drug delivery offers many advantages to improve patient compliance, and quality of life for chronic lung conditions, such as lung cancer, asthma, chronic obstructive pulmonary diseases. Moreover, pulmonary delivery enhances the therapeutic efficiency, with reduced doses, dose frequency, and non-invasive administration [Citation1]. Topical lung delivery attains local high concentrations with limited off-target side-effects [Citation2]. Systemic delivery via the lungs offers a fast alternative to parenteral administration due to the large surface area of the lungs (up to ∼140 m2 in adults), dense vasculature with ultra-thin barrier, fast heart-lung circulation (∼5 L/minute), and hepatic bypass with a limited proteolytic capacity (better option for systemic delivery of aerosolized macromolecules, such as proteins/peptides, and gene therapy) [Citation2]. Hence, alternative approaches such as nano-enabled pulmonary drug delivery (Nanoparticles (NPs): 1–1000 nm) is a very active area of research to maximize its pharmaceutical and clinical potentials [Citation2,Citation3].
Polymeric NPs are very attractive for biomedical applications due to ease of nanofabrication, versatility, biocompatibility, and degradability [Citation3]. Poly lactic-co-glycolic acid (PLGA, PL NPs) is a widely used synthetic biodegradable polymer in biomedical applications [Citation4], such as formulating NPs, with successful loading of different drugs and macromolecules, many of them approved for clinical use [Citation5]. The limitations of PLGA stem from its bulk hydrolytic degradation and accumulation of acidic monomers causing a reduction of pH at the site of drug action, thus, affecting the stability of pH-sensitive drugs, and with chronic use/repeated doses this could promote an inflammatory response [Citation6]. Poly glycerol adipate-co-ω-pentadecalactone (PGA-co-PDL, PG NPs) is an alternative polymer developed and characterized for drug delivery purposes and has been fabricated into NPs loaded with a variety of drugs, macromolecules, vaccines, and gene therapy [Citation7–9].
Numerous studies have emphasized that the NPs characteristics, i.e. size [Citation10], surface charge, chemistry and lipophilicity, and shape [Citation11], all play a critical role in the cellular uptake and subcellular interaction, barrier integrity and trafficking from the site of entry to the distribution and localization in target diseased cells. Hence, elucidating the mechanisms of NPs uptake and ensuring the barrier integrity are critical for subsequent modification of the physicochemical properties to optimize their drug delivery capabilities. To study NPs uptake and internalization, pharmacological inhibitors for certain transport processes are used using in vitro cell models and NPs labeled with fluorescent dyes (such as Nile Red, FITC, and BODIPY-FL) comparing exposure under no inhibition to exposures under selective inhibitors to uncover the underlying mechanism [Citation12].
Air-to-blood lung epithelium is the main rate-limiting factor for the transport of drugs and NPs, and its integrity is vital for successful inhalation delivery [Citation13]. Thus, Calu-3 cells are an in vitro model of human lung bronchial adenocarcinoma derived to study lung barrier permeability. Calu-3 cells can develop polarized monolayers with strong tight junctions (TJs) under air–liquid interface (ALI) to mimic airway epithelium [Citation13] and subsequently evaluated by measuring the transepithelial electrical resistance (TEER) and/or determining the apparent permeability coefficient (Papp) of paracellular markers. TEER is usually measured by epithelial voltohmmeter to ensure the confluent monolayers developed tight polarized monolayers, and post NPs exposure to ensure the integrity of the barrier was maintained. Furthermore, Papp of paracellular markers is to ensure the integrity was preserved throughout the duration of NP exposure [Citation13]. Paracellular markers such as [14C]-mannitol or sodium fluorescein, Lucifer Yellow, are passively transported (small Mw, hydrophilic, small size [Citation14]) through TJs and are commonly used.
The aim of the study was to investigate the physicochemical properties of NPs fabricated from the two polymers; PLGA and PGA-co-PDL, and to assess their effects on the integrity of restructured pulmonary epithelial barrier, to determine the underlying mechanisms for their uptake, and to visually confirm the NPs internalization and their subcellular co-localization.
Materials and methods
Materials
Dynasore hydrate (Inh1:Dynamin-dependent endocytosis: GTPase inhibitor for dynamin1 and 2, prepared in DMSO and final concentration of 12 µM in SFM), Genistein (Inh2; Caveolin-mediated endocytosis inhibitor, prepared in DMSO and final concentration of 25 µM in SFM), Cytochalasin D (Inh3;Cytoskeleton inhibitor: disturbs the polymerization of Actin filaments, prepared in DMSO and final concentration of 25 µM in SFM), Nocodazole (Inh4: Cytoskeleton inhibitor: disturbs the polymerization of microtubules, prepared in DMSO and final concentration of 25 µM in SFM), 5-(N-Ethyl-N-isopropyl) amiloride (EIPA) (Inh5: Macropinocytosis: inhibits the Na+/H+ exchange/Ca++channel blocker, lowers cytoplasmic pH, prepared in DMSO and final concentration of 12 µM in SFM), Methyl-β-cyclodextrin (Inh6:Caveolin-mediated endocytosis inhibitor: cholesterol depletion and inhibition of lipid raft formation, prepared in H2O and final concentration of 50 µM in SFM), Chlorpromazine hydrochloride (Inh7:Clathrin-mediated endocytosis inhibitor: inhibit the Clathrin pits assembly, prepared in H2O and final concentration of 12 µM in SFM), PLGA (50:50) acid terminated with MW of 7000-17000 KDa, Poly (vinyl alcohol) (PVA; MW of 13–23 KDa, 87%–89% hydrolysed), 4′,6-diamidino-2-phenylindole dilactate (DAPI), Nile red (NR) dye, Phosphate buffered saline tablets (PBS) (pH 7.4), FluoromountTM Mounting media- Sigma-Aldrich, UK. 1,2-dioleoyl-3-trimethylammonium-propane (chloride salt) powder (DOTAP) was kindly gifted from Lipoid Company, Germany. Methanol, DMSO, TrypLE™ Express, paraformaldehyde, and Nunc™ Lab-Tek™ II Chamber Slide™ System and chambered cover glass 8-wells were purchased from Thermofishers, UK. LysoTracker® Green DND-26 (LT-26) and Alexa Flour® 488-Phalloidin (AF-488) were purchased from Cell Signaling Technology, UK. CoStar Corning 12-well plates; 12 mm Transwell® with 0.4 µm Pore Polycarbonate Membrane Insert from Corning Lab, UK. Radioactive D-[2-14C]-Mannitol, 50µCi, (MW: 182 Da, selective reactivity of 57.0 mCi/mmol), liquid scintillation cocktails, and vials were purchased from PerkinElmer, USA. Purified water (DW) from a Millipore Purification System (Billerica, MA, USA) was used. Other lab chemicals and solvents were purchased from Sigma unless otherwise specified.
Methods
Polymeric nanoparticles formulations and characterisations:
To achieve three different size groups (∼200, 500, 800 nm), three different formulation parameters were adopted from a previous study [Citation15,Citation16] with some modifications as indicated below. NPs were fabricated from two polymers: PLGA (PL) (50:50) acid terminated with Mw of 7-17 KDa, and PGA-co-PDL (PG) (synthesized and characterized as previously described [Citation17] was 15.7 KDa to facilitate uncovering chemistry-dependent effect.
200 nm size group
NPs were produced using an emulsion-solvent evaporation method with PVA as an anionic emulsifier (PL-2, PG-2) and DOTAP as a cationic emulsifier (PL + 2, PG + 2) using oil in water (O/W) single emulsion method. 200 mg of the polymer was dissolved in 2 ml DCM (cationic NPs were prepared with addition of a cationic emulsifier DOTAP as 10% (w/w) to polymer mass prior to adding DCM) and added dropwise to 5 ml of 10% (w/v) PVA under probe sonication (QSonica sonicator, USA) at 65% amplitude for 2 min in an ice bath. The mixture was added drop wise (within 10 min at 600 rpm) to 20 ml of 0.75% (w/v) PVA with continued magnetic stirring (Jeio Tech MS-53M, South Korea) at 500 rpm for 3 h at room temperature to facilitate evaporation of DCM. NPs (2 ml of the emulsion containing 16 mg) were isolated by centrifugation and washed twice with 5 ml of DW to remove any excess surfactants, at 112,000 xg and 4 °C for 30 min using an Optima L-80 Ultracentrifuge (Beckman CoulterTM, UK) with a 70.1 Ti rotor.
500 nm size group
NPs were formulated from PG polymer using O/W single emulsion method (PG-5, PG + 5). 300 mg of the polymer was dissolved in 1.5 ml DCM and added dropwise to (cationic NPs were prepared with the addition of a cationic emulsifier DOTAP as 10% (w/w) to polymer mass prior to adding DCM) 2.5 ml of 10% PVA under probe sonication at 65% amplitude for 1 min in an ice bath then continue as above for 3 h. NPs (1.2 ml containing 16 mg) were isolated as above with ultracentrifugation at 80,000 ×g, and 4 °C for 30 min.
800 nm size group
Double W/O/W emulsion method was used (PG-8, PG + 8). PG (200 mg) was added to 2 ml DCM (cationic NPs were prepared with the addition of a cationic emulsifier DOTAP as 10% (w/w) to polymer mass prior to adding DCM) and upon adding to the internal aqueous phase of 0.5 ml 10% PVA under probe sonication with amplitude 65% in an ice bath for 30 s. This primary emulsion was then added to external aqueous phase of 25 ml containing 2% PVA drop wise under probe sonication 45% amplitude for 30 s and left under magnetic stirring at 500 rpm for 3 h at room temperature. NPs (2 ml containing 16 mg) were isolated as above with ultracentrifugation at 37,000 xg, and 4 °C for 30 min. Nile Red (Ex/em: 550/647 nm, red fluorescence) labeled NPs (NR-NPs) were formulated by adding NR dye to the polymer mass (2.5% w/w) prior to adding DCM and the formulation was followed as above to achieve the three sizes of polymeric NPs.
Particle size and zeta potential
NPs average size, polydispersity index (PDI), and zeta-potential were measured by Zetasizer Nano ZS, Malvern Instruments Ltd, UK. NPs suspension in DW (4 mg/mL) was sonicated using water bath sonicator (Ultrawave, UK) for 10 min to disperse the NPs [Citation18]. A sample of 100 µL of NPs suspension was diluted in 5 ml DW and subsequently placed into cuvettes to measure the size. A sample of 100 µL of NPs suspension was diluted in 2 ml DW and placed into zetasizer cells for measuring the zeta potential. Measurements were taken at 25 °C (n = 3).
Cell culture maintenance
Human bronchial epithelial Calu-3 cell line (HTB-55™; ATCC): Cells were maintained at 37 °C and 5% CO2 in a humidified atmosphere. Cells were cultured in Dulbecco’s modified Eagle’s medium (DMEM, Sigma-Aldrich) supplemented with 1% penicillin/streptomycin (Sigma), Fungizone® (Thermofishers) (2.5 µg/mL), L-glutamine (GlutaMaxTM, Gibco) (2 mM), sodium pyruvate (Sigma) (1 mM), and 10% fetal bovine serum (FBS, Sigma). The medium was changed every 2 days and cells were passaged at a 1:3 split ratio after detachment by using TrypLE™ Express. Cells with passage numbers from 20-40 were used. Cell confluency was maintained at ∼80% in 75-cm3 flasks prior to splitting or plating. They were seeded at a density of 40 x103 as 200 µL complete media containing 10% FBS (CM) per well in 96 well plates for 48 h, the supernatant was removed prior to treating the cells with serial concentrations of NPs prepared in serum-free media (SFM).
The apparent permeability coefficient (papp)
Culturing the tight polarized monolayers Calu-3 cells were cultured as previously described with modifications [Citation19]. Briefly, Calu-3 cells (80-90% confluent) were trypsinized using TrypLE™ Express. Transwells were pre-conditioned with 0.25 ml CM supplied with 10% FBS in apical and 0.5 ml in basolateral chambers and kept in an incubator (humified air with 5% CO2 at 37 °C) for 30 min. Calu-3 cell suspension (0.5 ml) were seeded at a density of 5 × 10⁵ cells/mL on Transwell apical chambers (1.12 cm2 surface area, 0.4 μm pore, 12 well plate, CoStar Corning, UK), and CM (1 ml) was added to the basolateral chamber prior to incubation. After one day, the medium was removed from both apical and basal compartments and only replaced in the basal compartment with fresh 1 ml to produce ALI. Every other day, renewing the basal compartment media was completed by adding fresh 1 ml prewarmed medium and the apical layer was gently washed with 0.5 ml medium. After 3-4 days, TEER values were measured by chopstick electrodes of an epithelial voltohmmeter (World Precision instruments, precalibrated by standard resistances and tared to zero prior to the measurements) every other day. The chopsticks were initially sterilized by submerging into 70% ethanol for 15 min then left to air dry. Prior to TEER measurements, submerged culture conditions were resumed by adding prewarmed media (0.5 ml) to the apical compartment and (1 ml) to the basolateral compartment and left to equilibrate for 30 min in the incubator. Following TEER measurements, apical medium was removed to retain the ALI. After an additional 10 days, the cell layers were expected to reach maximum confluency of ∼100% on Transwell inserts and TEER values had increased to a minimum value of 800 Ω cm2 under the conditions described earlier. This denoted the formation of tight polarized epithelial layers that can be used to study the NPs effect on integrity of the epithelial barrier.
Permeability experimental procedure The apical layers were washed three times with warm PBS. Prewarmed SFM was used to replenish basal compartment then left to equilibrate for 30 min in the incubator. NPs solutions (Concentrations used: 0.125, 0.5, 2 mg/mL) were added as 300 µL SFM containing (2 µM, 0.1 µCi per mL) radiolabeled mannitol to the apical layers. A control for monolayer integrity was performed using radiolabeled mannitol at 300 µL SFM containing (0.1 µCi per mL) radiolabelled mannitol and added to the apical chamber for untreated cells as a negative control and cell-free Transwell inserts serving as blank. Within 1 min, a sample of 10 μL of the solution was removed from each donor chambers to establish the initial donor concentration (C0), and a sample of 100 μL from each basal compartment was collected to establish initial recipient concentration at T0 that was replaced with fresh 100 μL SFM. The inserts were maintained in the incubators, and samples (100 μL) were taken from the basal compartment at 1, 2, 3, 4, 5, and 24 h intervals with the replacement of sampled solution with fresh 100 μL SFM. At 5 and 24 h, another 10 μL samples from the apical chambers were taken to determine the final donor concentrations. Samples were collected in scintillation vials and 5 ml of scintillation cocktails were added per sample prior to being analyzed by liquid scintillation counter (Beckman Tri-Carb).
The apparent permeability coefficient (Papp) for each type of NPs was calculated according to the following equation:.
where dQ/dt: change rate of radiolabeled mannitol concentration in the basal chamber (mol/sec); C0: was radiolabeled mannitol concentration in the donor chamber (mol/mL) at time T0; S: was the surface area of the PET membrane of the Transwell chamber (1.12 cm2), and Papp is the apparent permeation rate (cm sec−1). The data is presented as mean ± SD, for three independent experiments (n = 3).
Investigation of nanoparticle internalization mechanisms
Calu-3 cells were seeded at a density of 40 x103 per well (200 µL) in 96 well plates and incubated (37 °C and 5% CO2) for 48 h. The supernatant was removed and processed as following:.
To confirm NPs internalization
NR-NPs were added (200 µL per well, in triplicates as 0.5 mg/mL in SFM) and cells incubated (37 °C and 5% CO2) for 1 h. Supernatants were removed followed by washing of the monolayers with ice-cold PBS containing (5%) trypan blue (cell impermeable) to quench the effect of free and surface-bound NPs [Citation20]. After trypsinization by TrypLE™ Express (200 μl for 20 min), cells were collected in Eppendorf’s and centrifuged for 2 min at 4 °C (400 xg). Cell pellets were resuspended in 50 µL of fresh warm CM prior to analysis by flow cytometry. Flow cytometry setting and gating are provided in Supplementary data (). Median fluorescence intensity (MFI) was collected in FL-3 (NR, 550/647 nm on red channel). The results were expressed as a percentage of NP treated cells under no inhibition at 37 °C. MFI of cells internalizing NP-NRs was quantified and used as control (NP treated cells) for the subsequent experiment for NP internalization inhibition by pharmacological inhibitors. NR dye release was excluded by preparing NR-NP suspension (0.5 mg/mL) in SFM and incubated for 1 h prior to centrifuging and filtering through 0.2 µm filter and measuring any fluorescence by plate reader.
Figure 1. Papp of [14C]-mannitol measured under different NPs exposures over time: (A) PG-2, (B) PG + 2, (C) PL-2, (D) PL + 2, (E) PG-5, (F) PG + 5, (G) PG-8, and (H) PG + 8 (Mean ± SD, n = 3).
![Figure 1. Papp of [14C]-mannitol measured under different NPs exposures over time: (A) PG-2, (B) PG + 2, (C) PL-2, (D) PL + 2, (E) PG-5, (F) PG + 5, (G) PG-8, and (H) PG + 8 (Mean ± SD, n = 3).](/cms/asset/47f279eb-8413-47dd-84c8-2d2f0f45d90b/iddi_a_2332889_f0001_c.jpg)
To determination of the mechanism of NP transport
A group of inhibitors was selected to block active endocytic pathways of transport (inhibitors, their mechanisms of actions, and concentration used mentioned in materials section). Initially, a pre-optimization experiment was done via Alamar Blue viability assay to determine the suitable concentration of each of the pharmacological inhibitors (tested concentrations: 50, 25, 12.5, 6.25, 3 µM, for 2 h exposure) to block the transport without inducing overt toxicity (< 20% cell death) on Calu-3 cell lines.
For 4 °C experiment to block the active transport [Citation21], SFM was added to wells then stored at 4 °C for 30 min, then removed prior to adding NP-NRs solutions (0.5 mg/mL) and further stored at 4 °C for 1 h prior to sample processing as above.
For 37 °C experiment, pharmacological inhibitors were added (as 100 µL per well in SFM) and incubated for 30 min then removed prior to adding a solution of NP-NRs (0.5 mg/mL, as 200 µL per well) containing the same concentration of the inhibitors and further incubated for 1 h prior to sample processing as above.
Visual Confirmation of nanoparticle internalization and intracellular trafficking by confocal microscopy (CLSM; carl zeiss LSM 710, UK)
Calu-3 cells (5 × 10⁴ cells per well, 0.5 ml) were seeded in an 8-well chambered cover glass slides (Nunc Lab-Tek, Thermo Scientific, UK) and incubated (37 °C and 5% CO2) for 48 h. The supernatant was removed, and cells were treated with 0.5 mg/mL NR-NPs (red fluorescence, Ex/Em: 550/647 nm) freshly prepared in SFM and further incubated for 1 h, then washed with PBS three times followed by staining the nucleus with blue fluorescence using 4′,6-diamidino-2-phenylindole (strong binding to Adenine-Thymine DNA regions, DAPI, Ex/Em: 358⁄461 nm, Sigma-UK) as100 µL per well of 100 nM in PBS for 15 min, followed by three PBS washes (5 min soaking each wash).
To outline the cell membrane
Cells were fixed with 4% Paraformaldehyde for 10 min followed by three PBS washes (5 min soaking each wash). Outlining cell membranes with green fluorescence using Alexa Flour®488-Phalloidin ((AF488), Ex/Em: 495/518, Cell Signaling Technology, UK) that binds to F-actin filaments of the cytoskeleton) as 100 µL per well 0.33 µM working solution in PBS for 15 min followed by three PBS washes (5 min soaking each wash). The chambers were removed, and coverslips were mounted on the slides using FluoromountTM mounting media (Sigma, UK) then visualize under CLSM.
To determine NP intracellular co-localization
Cells were stained with LysoTracker® Green DND-26 ((LT-26), Ex/Em: 495/518 nm, Cell Signaling Technology, UK) as 100 µL per well of 50 nM prepared in CM to counterstain the lysosomes for 10 min then washed three times with PBS (5 min soaking each wash) and CM added (200 µL per well) prior to visualizing under live conditions.
Visualization under CLSM using a Plan-Apochromat 63× objective lens (numerical aperture 1.40, oil immersion), and pinhole diameter was set near ∼1 AU. Lasers used were a diode laser 405 nm to excite DAPI, an argon laser 488 nm to excite AF488 or LT-26, and a helium neon (HeNe) laser 543 nm to excite NR-NPs. Band pass filters were set to collect the emitted fluorescence 410-480 nm for the blue channel, 490-550 nm for the green channel, and 590-690 nm for the red channel (to avoid channel crosstalk). Autofluorescence from untreated Calu-3 cells was negligible under the acquisition settings and did not interfere with the fluorescently labeled NPs. Images were processed by Fiji software.
Statistical analysis
All statistical analysis was performed using GraphPad Prism 7.04 statistical software using One-way analysis of variance (ANOVA) and applying Dunnett’s multiple comparison test to compare mean of each formulation with the untreated control and Tukey’s multiple comparison to compare the mean of different formulations with each other. All values were expressed as the mean ± standard deviation. The P values are expressed as *p < 0.05, **p < 0.01, ***p < 0.001, ****p < 0.0001.
Results
NPs characterizations
NP Characterization for size, PDI, and zeta potential were evaluated in DW represented in . PL and PG NPs at 200 nm size showed similar size, while the positively charged NPs showed a slight size reduction from their negatively charged counterparts but there was no statistically significant difference. NPs at 200 nm size were statistically smaller from their larger counterparts at 500 nm and 800 nm. NPs at 500 nm were were statistically different from their larger counterparts at 800 nm.
Table 1. Characterization of polymeric of NPs; size, PDI, and zeta potential/charge of 8 different NPs (mean ± SD, n = 3).
The apparent permeability coefficient (papp)
Papp of [14C]-mannitol as a paracellular marker was used to confirm the barrier integrity after exposure to NPs (0.125, 0.5, and 2 mg/mL) over time (1, 2, 3, 4, 5, 24 h). In all time points, all NPs showed a concentration-dependent increase in Papp values in . The highest Papp values were observed at 2 mg/mL concentration for all NPs. These trends were similar to those seen in the untreated cells (NC), but the Papp values were slightly higher in the cells exposed to NPs (TEER values of Calu-3 cells under ALI in Supplementary Figure. S.2).
Different types of NPs at the same concentration and time point were compared. There were no significant differences in Papp values between the different types of NPs at the same concentration. All NPs showed a decreasing trend over time where Papp values were the highest values (∼4 × 10⁻⁷ cm sec-1) at T1 followed by a sharp drop at T2 (∼ 3 × 10⁻⁷cm sec−1) and maintained a steady slow decline slightly higher than NC over time points: T3 (∼2.5 − 3 × 10⁻⁷cm sec−1), T4 (∼ 2.5 − 3 × 10⁻⁷ cm sec−1), T5 (∼ 1.7 − 2.5 × 10⁻⁷ cm sec−1) until final T24 (∼1.5-2 × 10⁻⁷ cm sec-1).
Transport mechanisms
NPs internalization by Calu-3 cells was confirmed by flow cytometry and was found to be almost 100 times higher than the untreated cells (). All NPs showed energy-dependent transport, as evidenced by the significant inhibition of transport at 4 °C. However, quantifying NPs uptake to uncover which NPs were better internalized was not feasible (due to the unequal NR dye loading capacities).
Figure 2. NPs internalization and the effects of different inhibitors (inhibitor mechanisms detailed in Materials section) on the internalization of (A) PG-2, (B) PG + 2, (C) PL-2, (D) PL + 2, (E) PG-5, (F) PG + 5, (G) PG-8, (H) PG + 8; where Inh1: Dynasore, Inh2: Genistein, Inh3: Cytochalasin D, Inh4: Nocodazole, Inh5: EIPA, Inh6: Methyl-β-cyclodextrin, Inh7: Chlorpromazine (• Dunnett test comparison to NC, •• p < 0.01, • • • p < 0.001, • • • • p < 0.0001) (Mean ± SD, n = 3).

For size 200 nm NPs
In NP uptake of PG-2 was statistically (p < 0.0001) significantly inhibited by Dynasore/Inh1 (∼40%), Genistein/Inh2 (∼40%), Nocodazole/Inh4 (∼50%), and Methyl-β-cyclodextrin/Inh6 (∼40%). While NP uptake of PG + 2 was statistically (p < 0.001) significantly inhibited by ∼50% with Dynasore/Inh1, Genistein/Inh2, Cytochalasin-D/Inh3, and Nocodazole/Inh4, slight reduction but not statistically significant with EIPA/Inh5 and Methyl-β-cyclodextrin/Inh6.
In NP uptake of PL-2 was statistically significantly inhibited by ∼25-30% (p < 0.0001) with Dynasore/Inh1, Genistein/Inh2 (p < 0.001), and Chlorpromazine/Inh7 (p < 0.01), slight reduction but not statistically significant with Cytochalasin-D/Inh3 and Nocodazole/Inh4. NP uptake of PL + 2 was only statistically (p < 0.01) significantly inhibited by ∼20% with Dynasore/Inh1, Genistein/Inh2, and Cytochalasin-D/Inh3.
For size 500 nm NPs
In NP uptake of PG-5 was statistically significantly inhibited by ∼50% with Genistein/Inh2 (p < 0.0001), ∼20% with Nocodazole/Inh4 (p < 0.01), and ∼78% with Chlorpromazine/Inh7(p < 0.0001). While NP uptake of PG + 5 was statistically significantly inhibited by ∼30% with Genistein/Inh2 (p < 0.01), ∼20% with Nocodazole/Inh4 (p < 0.01), and ∼70% with Chlorpromazine/inh7(p < 0.0001).
For size 800 nm NPs
In NP uptake of PG-8 was statistically (p < 0.01) significantly inhibited by ∼25% with Chlorpromazine/Inh7. While NP uptake of PG + 8 was statistically significantly inhibited by ∼15% with Cytochalasin-D/Inh3 (p < 0.01) and ∼20% with Chlorpromazine/Inh7 (p < 0.001).
Visual confirmation
Visual confirmation of NPs internalization by CLM is shown in A (all negatively-charged NPs) and B (their positively-charged counterparts). Nuclei of Calu-3 cells were stained by DAPI (blue channel) whereas the cell membranes were stained by AF488 (green channel), and NP-NR shown in red channel. The three channels were merged in overlay images (the separate channels are shown in ). All types of NPs were internalized into the cell cytoplasm. NPs could be observed in the space between the nuclei and the outer cell membranes indicating internalization and successful cytoplasmic delivery. Internalization of different NPs was within one hour indicating their fast uptake as previously confirmed from the flow cytometry experiment.
Figure 3. Confocal microscopy images of Calu-3 cells where nuclei labeled by DAPI/Blue and cell membranes labeled by AF488/Green after incubation for 1 h with (0.5 mg/mL) NP-NRs/Red (A: all negatively-charged NPs and B: their positively-charged counterparts).

NP co-localization with lysosomes shown in A (all negatively-charged NPs) and B (their positively-charged counterparts). The lysosomes were counterstained by LT-26 (green channel), and NP-NR in red channel. The three channels were merged in overlay images to show signals from NPs superimposed/co-localised with lysosomes (giving an orange to golden-yellow color denoting colocalisation) and the relation to nucleus (the separate channels are shown in ).
Figure 4. Confocal microscopy images of Calu-3 cells where nuclei labeled by DAPI/Blue and lysosomes labeled by LT-26/Green after incubation for 1 h with (0.5 mg/mL) NP-NRs/Red (A: all negatively-charged NPs and B: their positively-charged counterparts).

Discussion
TEER and the apparent permeability coefficient (papp)
Calu-3 cells under ALI form tight polarized monolayers with strong resemblance to in vivo lung cells (single columnar epithelium with apical cilia, mucous secretion, and tight junctions) [Citation22]. They express functional properties such as transferrin transporter, metabolizing enzymes, and CFTR genes. They also show good IVIVC correlation for predicting in vivo lung drug absorption [Citation23]. Calu-3 tight monolayers have consistent TEER values, which makes them a powerful in vitro model to study the in vivo lung barrier [Citation23].
Papp of [14C]-mannitol was used to measure the integrity of the epithelial barrier in Calu-3 polarized monolayers grown under ALI after exposure to eight different types of NPs at different concentrations and time intervals. Radiolabelled [14C]-mannitol, a small (182 Da) hydrophilic molecule, was used as a paracellular marker as reported in many studies to study the paracellular transport across polarized monolayers [Citation13]. The outcomes from this experiment can be noted as the following:.
Firstly, there were no significant differences between the different types of NPs, sizes, charges, or chemistries under the tested concentrations and time intervals. This indicates that the Calu-3 polarized monolayers had a strong and well-preserved integrity and can filter a wide range of NPs with variable underlying physiochemical properties. This is similar to the natural barrier with TJs, which can act as a defence barrier against various inhaled particles, dust, bacteria, and viruses [Citation19].
Secondly, the Papp of [14C]-mannitol was within the acceptable range of paracellular or passive absorption rates across Calu-3 monolayers, which is 1-4 × 10⁻⁷ cm sec−1 [Citation13]. This range has been reported for other types of polarized monolayers for different epithelial cells, NCI-H441 [Citation24], hAELVi cells [Citation25], MucilAir [Citation23], 16HBE14o- [Citation26], and non-lung epithelia such as Caco-2 [Citation27], MDCK [Citation23] and many other cell lines [Citation28].
Thirdly, Papp of [14C]-mannitol showed a concentration-dependent increase with the highest concentration (2 mg/mL) having the greatest Papp values. This indicates that the barrier integrity was negatively influenced at high concentrations, but the paracellular Papp values were still within the acceptable range [Citation29], indicating no adverse effects on TJs and no cellular toxicity. While these experimental concentrations are much higher than what would be achieved in a therapeutic setting due to the large surface area of the lungs, which dilutes the dose [Citation30]. This suggests that the lung barrier would be less harmfully impacted at exposure at low doses of these NPs. However, the highest concentration of NPs (2 mg/mL) did not cause cytotoxicity thus no impairment of barrier integrity, however this was not expected at such high dose. This was due to the following reasons: tightly packed monolayers with well-developed TJs, the dose dilution per surface area, the mucous expression which reduces the mobility of molecules across the epithelium, mucus has high mucin content and of a high viscosity (mesh pores 100 nm up to few micrometers in diameter) which can entrap various sizes of NPs, and at high concentrations, NPs agglomerate and become larger which are filtered out by the mucus, leaving only smaller NPs to penetrate deeper into the tissue. These findings suggest that Calu-3 cells under ALI are a robust model for studying the effects of NPs on the lung barrier. Similar findings were reported [Citation31,Citation32]. While the PG NPs have acted similarly denoting their well tolerability and safety interactions with the epithelial barrier.
Fourthly, the decreasing trend of Papp of [14C]-mannitol over time was reported from T1 with a subsequent slow decline over time until T24. This decrease was due to the barrier developing more restrictive properties over time (the cells developed some cellular machinery to restrict the TJs). The barrier showed a very slow decline with slight changes to the permeability during the interval of 2-5 h. This suggests that this interval is a more suitable time to measure the Papp for drug-loaded NPs. Similar findings were reported [Citation19,Citation29]. These studies showed that TJ proteins, including ZO-1, increased over time, which can restrict the paracellular flow of solutes and molecules [Citation29].
4.2. Transport mechanisms
The study used pharmacological endocytosis inhibitors to investigate the internalization process and was limited for one-hour exposure [Citation33] (preventing the activation of alternative internalization pathways [Citation34,Citation35]). The toxicity of the inhibitors was excluded as the viability was maintained above 80% and the concentrations used were the least toxic as previously reported [Citation36].
The release of NR dye in the medium with subsequent passive cellular diffusion was excluded. The NR dye is reported to be released from NPs in media containing serum proteins, but the release rate is slow [Citation37], and requiring more than 3 h to reach 25% cellular uptake [Citation3]. This study used SFM to reduce the release of NR, and the NP-NRs were used freshly prepared to minimize degradation.
The possibility of NP-NRs being attached to the cell membranes or being free was excluded by washing the monolayers three times with ice-cold PBS (cold inhibits the active uptake [Citation12]) containing 5% trypan blue (cell impermeable, quenches the fluorescence from free NPs or loosely attached [Citation20]), trypsinization (the cell membranes were gently eroded detaching loosely attached NPs [Citation38]), and centrifugation (enough to collect the cells only leaving unbound NPs to be decanted) [Citation3]. Flow cytometry enabled differentiation between cells and debris or unbound particles within a sample with a gating strategy [Citation39]. Hence, the fluorescent signals measured were solely originated from intracellular internalized NP-NRs. The low MFI recorded at 4 °C can be attributed to passive NR diffusion into the cells from the NPs attached to the cell membrane. The amount of passive uptake varied depending on the NP type where all PG NPs were higher than PL NPs and with larger sized PG NPs that might indicate more attachment to the cell membrane with PG NPs.
All different types of NPs internalization were active/energy dependent processes. A summary of the results is shown in . This was similar to what was reported for different polymeric and non-polymeric NPs due to their large size and MW that limits their passive diffusion [Citation40].
Table 2. Summary of the endocytosis transport inhibitors results (overview of all NPs and the different inhibitors used, inhibitor mechanisms detailed in materials section) (-non-significant, ++p < 0.01, +++p < 0.001, ++++p < 0.0001).
For size 200 nm NPs
The internalization of PG-2 NPs was dependent on GTPase-dynamin, tyrosine kinase-caveolin, microtubules, cholesterol rafts, and macropinocytosis. It was not dependent on actin polymerization, Na+/H + ionic channels of micropinocytosis, and clathrin. The uptake was mostly by caveolin and macropinocytosis. While PG + 2 NPs was dependent on GTPase-dynamin, tyrosine kinase-caveolin, actin polymerization, microtubules, and cholesterol rafts. It was not dependent on Na+/H + ionic channels of micropinocytosis, cholesterol depletion, and clathrin. The uptake was mostly by caveolin endocytosis. The internalization of PL-2 NPs was dependent on GTPase-dynamin, tyrosine kinase-caveolin, and clathrin pits assembly. It was not dependent on actin polymerization, microtubules, and Na+/H + ionic channels of micropinocytosis. It showed more inhibition under caveolin and clathrin, so its uptake mostly caveolin and clathrin endocytosis. While PL + 2 NPs was dependent on GTPase-dynamin, tyrosine kinase-caveolin, and actin polymerization. The uptake was mostly facilitated by caveolin endocytosis.
For size 500 and 800 nm NPs
The internalization of PG-5 and PG + 5 NPs was dependent on clathrin, caveolin, microtubules, and macropinocytosis. They were mostly facilitated by clathrin and caveolin endocytosis. The internalization of PG-8 was dependent on clathrin while PG + 8 was dependent on clathrin and actin polymerization. Their uptake was facilitated by clathrin endocytosis. All NPs showed some passive uptake at 4 °C.
When evaluating how the physicochemical properties influenced the endocytosis, some conclusions can be made as the following.
Size effect: The eight different types of NPs were not inhibited by Na+/H+ exchange marcopinocyctosis (Inh5) denoting their uptake is ionic-exchange independent. All small NPs (̴̴ 200 nm) were inhibited by GTPase-dynamin (Inh1) while larger NPs were inhibited by Clathrin pits assembly (Inh7). Moreover, smaller NPs showed multiple inhibition by different factors (Inh1, Inh3, Inh4, Inh5, Inh6) compared to the larger sized NPs that might indicate less internalization for larger sized NPs. This support previous studies that indicated larger sized NPs have lower internalization compared to smaller NPs [Citation41].
Charge effect: Negative NPs were not inhibited by Actin polymerization (Inh3) while positive counterparts were seen with PG + 2, PL + 2, and PG + 8. While negative PL-2 was inhibited by Clathrin pits assembly (Inh7) and PG-2 was inhibited by Cholesterol depletion-Caveolin (Inh6) and not their positive counterparts (PL + 2, PG + 2).
Chemistry effect: PL-2 NPs were inhibited by Clathrin pits assembly (Inh7) but not PG-2. Furthermore, PG-2 and PG + 2 both were inhibited by Microtubules arrangement (Inh4) but not PL-2 and PL + 2. Lastly, PG-2 was the only NPs inhibited by Cholesterol depletion-Caveolin (Inh6) acting as a unique NP.
To the best of our knowledge, the current study represents a novel evaluation of both PL and PG NPs internalization in Calu-3 cell lines. There were many studies supported the NPs physicochemical properties and the cell type play a major role in the internalization mechanism [Citation40] where NPs of size 150-200 nm are internalized by either caveolin or clathrin endocytosis for the small NPs of 200 nm; PG-2, PG + 2, PL-2, and PL + 2. However, the larger sizes NPs (PG-5, PG + 5, PG-8, and PG + 8) were internalization via clathrin and caveolin that are commonly reported for smaller NPs ∼ 200 nm. This could be due to the dispersity of NPs where smaller particles were more internalized than the larger NPs [Citation42]. This highlights the importance of evaluating NPs uptake mechanism to facilitate cell targeting and improve drug delivery purposes.
Visual confirmation by CLSM
The NPs were trafficked intracellularly and showed co-localization with the endolysosomes confirming their vesicular transport. This confirmed the results obtained earlier where active endocytosis was confirmed as the main mechanism of the NPs internalization using endocytosis inhibitors. For PL NPs, there are many studies confirmed the current study findings where PL NPs were internalized via endocytosis pathways in a variety of cell lines [Citation43]. However, the current study for PG NPs presented novel findings where PG NPs acted in a similar way to PL NPs confirming their suitability for drug delivery.
Conclusion
Understanding the NPs cellular interaction provides immense abilities to tune the NP physicochemical characters to enhance nanomedicines. This study investigated the effects of physicochemical properties of NPs on the integrity of the epithelial barrier in Calu-3 cells grown under ALI. The results suggest that the polarized Calu-3 cells under ALI are a robust model for studying the effects of NPs on the lung barrier where the barrier maintained its integrity under a variety of physicochemical properties of NPs (with respect to the study limitations).
The study also investigated the mechanisms by which different physicochemical NPs were internalized by the cells. However, all NPs showed endocytosis-dependent mechanisms, but different NPs showed different pathways of uptake depended on physicochemical properties, most importantly its size, charge, and chemistry. In addition, NPs internalization was visually confirmed by CLSM, however, quantification of internalization would have been beneficial here to confirm the physicochemical effect of NPs on their uptake.
The study provided new insights into the effects of NPs on the lung barrier and the mechanisms by which they are internalized. This information could be used to develop different NPs that have less harmful impact on lung barrier and more effective for the delivery of drugs and targeting therapeutic agents to the lungs.
Supplemental Material
Download MS Word (4.8 MB)Disclosure statement
No potential conflict of interest was reported by the author(s).
Additional information
Funding
References
- Anderson CF, Grimmett ME, Domalewski CJ, et al. Inhalable nanotherapeutics to improve treatment efficacy for common lung diseases. Wiley Interdiscip Rev Nanomed Nanobiotechnol. 2020;12(1):e1586. doi: 10.1002/wnan.1586.
- Osman NM, Sexton DW, Saleem IY. Toxicological assessment of nanoparticle interactions with the pulmonary system. Nanotoxicology. 2020;14(1):21–58. doi: 10.1080/17435390.2019.1661043.
- Snipstad S, Westrøm S, Mørch Y, et al. Contact-mediated intracellular delivery of hydrophobic drugs from polymeric nanoparticles. Cancer Nanotechnol. 2014;5(1):8. doi: 10.1186/s12645-014-0008-4.
- Osman N, Kaneko K, Carini V, et al. Carriers for the targeted delivery of aerosolized macromolecules for pulmonary pathologies. Expert Opin Drug Deliv. 2018;15(8):821–834. doi: 10.1080/17425247.2018.1502267.
- Essa D, Kondiah PPD, Choonara YE, et al. The design of poly(lactide-co-glycolide) nanocarriers for medical applications. Front Bioeng Biotechnol. 2020;8:48. (doi: 10.3389/fbioe.2020.00048.
- Swider E, Koshkina O, Tel J, et al. Customizing poly(lactic-co-glycolic acid) particles for biomedical applications. Acta Biomater. 2018;73:38–51. doi: 10.1016/j.actbio.2018.04.006.
- Mohamed A, Kunda NK, Ross K, et al. Polymeric nanoparticles for the delivery of miRNA to treat chronic obstructive pulmonary disease (COPD). Eur J Pharm Biopharm. 2019;136:1–8. doi: 10.1016/j.ejpb.2019.01.002.
- Mohamed A, Pekoz AY, Ross K, et al. Pulmonary delivery of nanocomposite microparticles (NCMPs) incorporating miR-146a for treatment of COPD. Int J Pharm. 2019;569:118524. doi: 10.1016/j.ijpharm.2019.118524.
- Rodrigues TC, Oliveira MLS, Soares-Schanoski A, et al. Mucosal immunization with PspA (pneumococcal surface protein a)-adsorbed nanoparticles targeting the lungs for protection against pneumococcal infection. PLoS One. 2018;13(1):e0191692. doi: 10.1371/journal.pone.0191692.
- Chakraborty A, Das A, Raha S, et al. Size-dependent apoptotic activity of gold nanoparticles on osteosarcoma cells correlated with SERS signal. J Photochem Photobiol B. 2020;203:111778. doi: 10.1016/j.jphotobiol.2020.111778.
- Srijampa S, Buddhisa S, Ngernpimai S, et al. Influence of gold nanoparticles with different surface charges on localization and monocyte behavior. Bioconjug Chem. 2020;31(4):1133–1143. doi: 10.1021/acs.bioconjchem.9b00847.
- Manzanares D, Ceña V. Endocytosis: the nanoparticle and submicron nanocompounds gateway into the cell. Pharmaceutics. 2020;12(4):371. doi: 10.3390/pharmaceutics12040371.
- Sakagami M. In vitro, ex vivo and in vivo methods of lung absorption for inhaled drugs. Adv Drug Deliv Rev. 2020;161-162:63–74. doi: 10.1016/j.addr.2020.07.025.
- Otani T, Furuse M. Tight junction structure and function revisited. Trends Cell Biol. 2020;30(12):1014–1817. doi: 10.1016/j.tcb.2020.10.001.
- Kunda NK, Alfagih IM, Dennison SR, et al. Bovine serum albumin adsorbed PGA-co-PDL nanocarriers for vaccine delivery via dry powder inhalation. Pharm Res. 2015;32(4):1341–1353. doi: 10.1007/s11095-014-1538-5.
- Alfagih I, Kunda N, Alanazi F, et al. Pulmonary delivery of proteins using nanocomposite microcarriers. J Pharm Sci. 2015;104(12):4386–4398. doi: 10.1002/jps.24681.
- Tawfeek H, Khidr S, Samy E, et al. Poly(glycerol adipate-co-ω-Pentadecalactone) Spray-Dried microparticles as sustained release carriers for pulmonary delivery. Pharm Res. 2011;28(9):2086–2097. doi: 10.1007/s11095-011-0433-6.
- Mejia J, Valembois V, Piret J-P, et al. Are stirring and sonication pre-dispersion methods equivalent for in vitro toxicology evaluation of SiC and TiC? J Nanopart Res. 2012;14(4):1–18. doi: 10.1007/s11051-012-0815-7.
- Ehrhardt C, Fiegel J, Fuchs S, et al. Drug absorption by the respiratory mucosa: cell culture models and particulate drug carriers. J Aerosol Med. 2002;15(2):131–139. doi: 10.1089/089426802320282257.
- Selby LI, Cortez-Jugo CM, Such GK, et al. Nanoescapology: progress toward understanding the endosomal escape of polymeric nanoparticles. WIREs Nanomed Nanobiotechnol. 2017;9(5):e1452. doi: 10.1002/wnan.1452.
- Dos Santos T, Varela J, Lynch I, et al. Effects of transport inhibitors on the cellular uptake of carboxylated polystyrene nanoparticles in different cell lines. PLoS One. 2011;6(9):e24438. doi: 10.1371/journal.pone.0024438.
- Stentebjerg-Andersen A, Notlevsen IV, Brodin B, et al. Calu-3 cells grown under AIC and LCC conditions: implications for dipeptide uptake and transepithelial transport of substances. Eur J Pharm Biopharm. 2011;78(1):19–26. doi: 10.1016/j.ejpb.2010.12.030.
- Furubayashi T, Inoue D, Nishiyama N, et al. Comparison of various cell lines and three-Dimensional mucociliary tissue model systems to estimate drug permeability using an in vitro transport study to predict nasal drug absorption in rats. Pharmaceutics. 2020;12(1):79. doi: 10.3390/pharmaceutics12010079.
- Salomon JJ, Muchitsch VE, Gausterer JC, et al. The cell line NCl-H441 is a useful in vitro model for transport studies of human distal lung epithelial barrier. Mol Pharm. 2014;11(3):995–1006. doi: 10.1021/mp4006535.
- Kuehn A, Kletting S, de Souza Carvalho-Wodarz C, et al. Human alveolar epithelial cells expressing tight junctions to model the air-blood barrier. 2016;33(3):251–260.
- Weiser N, Molenda N, Urbanova K, et al. Paracellular permeability of bronchial epithelium is controlled by CFTR. Cell Physiol Biochem. 2011;28(2):289–296. doi: 10.1159/000331742.
- Cárdenas PA, Kratz JM, Hernández A, et al. In vitro intestinal permeability studies, pharmacokinetics and tissue distribution of 6-methylcoumarin after oral and intraperitoneal administration in wistar rats. Braz J Pharm Sci. 2017;53(1):1–9. doi: 10.1590/s2175-97902017000116081.
- Moss DM, Liptrott NJ, Curley P, et al. Rilpivirine inhibits drug transporters ABCB1, SLC22A1, and SLC22A2 in vitro. Antimicrob Agents Chemother. 2013;57(11):5612–5618. doi: 10.1128/AAC.01421-13.
- Bol L, Galas J-C, Hillaireau H, et al. A microdevice for parallelized pulmonary permeability studies. Biomed Microdevices. 2014;16(2):277–285. doi: 10.1007/s10544-013-9831-3.
- Bessa MJ, Brandão F, Rosário F, et al. Assessing the in vitro toxicity of airborne (nano) particles to the human respiratory system: from basic to advanced models. J Toxicol Environ Health B Crit Rev. 2023;26(2):67–96. doi: 10.1080/10937404.2023.2166638.
- Graves RA, Ledet GA, Glotser EY, et al. Formulation and evaluation of biodegradable nanoparticles for the oral delivery of fenretinide. Eur J Pharm Sci. 2015;76:1–9. doi: 10.1016/j.ejps.2015.04.024.
- Mura S, Hillaireau H, Nicolas J, et al. Biodegradable nanoparticles meet the bronchial airway barrier: how surface properties affect their interaction with mucus and epithelial cells. Biomacromolecules. 2011;12(11):4136–4143. doi: 10.1021/bm201226x.
- Dausend J, Musyanovych A, Dass M, et al. Uptake mechanism of oppositely charged fluorescent nanoparticles in HeLa cells. Macromol Biosci. 2008;8(12):1135–1143. doi: 10.1002/mabi.200800123.
- Francia V, Montizaan D, Salvati A. Interactions at the cell membrane and pathways of internalization of nano-sized materials for nanomedicine. Beilstein J Nanotechnol. 2020;11(1):338–353. doi: 10.3762/bjnano.11.25.
- Zhao J, Stenzel MH. Entry of nanoparticles into cells: the importance of nanoparticle properties. Polym Chem. 2018;9(3):259–272. doi: 10.1039/C7PY01603D.
- Foroozandeh P, Aziz AA. Insight into cellular uptake and intracellular trafficking of nanoparticles. Nanoscale Res Lett. 2018;13(1):339. doi: 10.1186/s11671-018-2728-6.
- Raudszus B, Mulac D, Langer K. A new preparation strategy for surface modified PLA nanoparticles to enhance uptake by endothelial cells. Int J Pharm. 2018;536(1):211–221. doi: 10.1016/j.ijpharm.2017.11.047.
- Kurashina Y, Imashiro C, Hirano M, et al. Enzyme-free release of adhered cells from standard culture dishes using intermittent ultrasonic traveling waves. Commun Biol. 2019;2(1):393. doi: 10.1038/s42003-019-0638-5.
- Shin H, Kwak M, Lee TG, et al. Quantifying the level of nanoparticle uptake in mammalian cells using flow cytometry. Nanoscale. 2020;12(29):15743–15751. doi: 10.1039/d0nr01627f.
- Durán V, Yasar H, Becker J, et al. Preferential uptake of chitosan-coated PLGA nanoparticles by primary human antigen presenting cells. Nanomedicine. 2019;21:102073. doi: 10.1016/j.nano.2019.102073.
- Mazumdar S, Chitkara D, Mittal A. Exploration and insights into the cellular internalization and intracellular fate of amphiphilic polymeric nanocarriers. Acta Pharm Sin B. 2021;11(4):903–924. doi: 10.1016/j.apsb.2021.02.019.
- Sahin A, Esendagli G, Yerlikaya F, et al. A small variation in average particle size of PLGA nanoparticles prepared by nanoprecipitation leads to considerable change in nanoparticles’ characteristics and efficacy of intracellular delivery. Artif Cells Nanomed Biotechnol. 2017;45(8):1657–1664. doi: 10.1080/21691401.2016.1276924.
- Uzhytchak M, Smolková B, Lunova M, et al. Lysosomal nanotoxicity: impact of nanomedicines on lysosomal function. Adv Drug Deliv Rev. 2023;197:114828. doi: 10.1016/j.addr.2023.114828.