
 ?Mathematical formulae have been encoded as MathML and are displayed in this HTML version using MathJax in order to improve their display. Uncheck the box to turn MathJax off. This feature requires Javascript. Click on a formula to zoom.
ABSTRACT
To evaluate the soil quality of alpine farmland and elucidate the key factors influencing productivity levels under the current agricultural paradigm, we conducted an extensive collection of soil samples. In total, 234 soil samples (0–20 cm) were collected from Menyuan County, the heartland of the southern slope of the Qilian Mountains. These samples represented four predominant soil types, including cold calcic soil, luvic chernozem, calcareous meadow soil, and calcareous gray cinnamon soil. Moreover, by employing principal component analysis, we established a minimum data set (MDS) that encapsulated the essential parameters for the comprehensive evaluation of the soil quality of farmland in the study area. Upon evaluating the soil quality index, the rankings were as follows: luvic chernozem (0.63) > calcareous gray cinnamon soil (0.58) > calcareous meadow soil (0.58) > cold calcic soil (0.55). Overall, the results highlighted that the significant impact of soil total nitrogen (TN), available potassium (AK), and soil water content (SWC) on soil quality within the study area. Therefore, in the context of land management practices, careful attention should be paid to the management of soil TN, AK content, and SWC to avoid the degradation of cultivated land into abandoned fields.
Introduction
Soil quality is defined as ‘the ability of a specific type of soil to maintain plant and animal productivity, maintain or improve water and air quality, and support human health and habitat within a natural or managed ecosystem’ (Karlen et al. Citation1997). Soil quality depends on the interaction between land utilization, ecosystem type, geographical location, soil type, and diverse characteristics within the soil (Liu et al. Citation2006). Farmland soil serves as the foundation for sustainable agricultural practices (Mulumba and Lal Citation2008). The growth and development of crops are closely related to soil quality (Choudhary et al. Citation2021). Currently, there is a growing emphasis on food security and improvements in living standards. Achieving sustainable agricultural production requires a thorough understanding of soil, soil quality, and fertility. Soil quality serves as a sensitive and dynamic indicator for gauging the state of soil, its responsiveness to management, and its resilience to natural or human-induced pressures (Yu et al. Citation2018). The primary focus of soil management is to mitigate the effects of soil conditions on productivity (Jat et al. Citation2021). Assessments of this nature are believed to offer insights into how soils respond to diverse management practices (Bünemann et al. Citation2018). To a certain extent, soil quality can mirror the biological, chemical, and physical characteristics, processes, and interactions occurring within the soil (Nyamasoka-Magonziwa et al. Citation2020). Therefore, evaluation of soil quality in agricultural fields is important for documenting soil conditions and adapting to industrial structures.
During the process of soil quality evaluation, the physical, chemical, and biological characteristics of the soil that can affect soil function and are sensitive to soil environmental changes are commonly utilized as evaluation indicators (Takoutsing et al. Citation2016). Meticulous selection of parameters for soil quality evaluation is of utmost importance. An inadequate selection of evaluation indices can contribute to meaningless results (Nortcliff Citation2002), and certain correlations generally exist among numerous selected indicators, which can lead to data redundancy. Therefore, the development of a minimum data set (MDS) has become pivotal in conducting soil quality evaluations. Among the various approaches proposed in the past few decades to quantitatively determine the MDS for soil quality (Barrios et al. Citation2006; Panico et al. Citation2020), principal component analysis (PCA) stands as the most widely employed method (Velasquez et al. Citation2005). PCA can reduce the number of soil property indicators to a certain extent and address the issue of data redundancy (Wang et al. Citation2003). Vasu et al. (Citation2016) explored the characteristic values of attributes, such as soil bulk density (BD), porosity, and color, and comprehensively evaluated various soil quality in the northwest coastal zone of India through the establishment of an MDS. De Paul Obade and Lal (Citation2014) selected soil pH, BD, and porosity, using PCA to evaluate soil quality in five distinct farmlands in Ohio, U.S.A.. Li et al. (Citation2019) employed PCA to evaluate soil quality in wheat fields across multiple regions in China and identified the factors limiting wheat productivity based on an MDS. Currently, soil quality research has predominantly focused on different land utilization and management practices, soil types, and various models of natural vegetation restoration (Li et al. Citation2017; Panico et al. Citation2020), with limited studies on soil quality in alpine farmlands. Alpine farmland represents a vital cultivated land resource that can be characterized by its high terrain and cold climate. It is only suitable for crop growth in valleys with relatively flat topography and favorable hydrothermal conditions. Alpine farmlands play a crucial role in maintaining ecological security and social stability in ecologically fragile areas. The soil in alpine farmlands is affected by both natural environmental factors and human activities. Conversely, it can also be modulated to foster healthy and sustainable development by managing human interference (Fang et al. Citation2018). Therefore, the conduction of soil quality investigations and the establishment of a framework for soil management evaluation in alpine farmland hold immense significance for regional sustainable development.
Distinct soil types exhibit diverse physical and chemical properties, which is primarily evident in the fact that soil texture affects the accumulation and decomposition of soil nutrients within a local context, thereby exerting direct or indirect impacts on soil fertility (Juice et al. Citation2022), as well as consequently altering soil quality. Therefore, this study focused on farmland soil situated at altitudes ranging from 2400 to 3200 m in Menyuan County, located on the southern slope of the Qilian Mountains. By integrating soil physical, chemical, and biological characteristics and utilizing the PCA method, a minimum data set was is established by selecting soil quality indicators. This set was employed to assess the soil quality in the study area and identify the primary indicators influencing soil quality in farmlands within the research region. This study investigated whether soil nutrients constitute a limiting factor in this area, with the aim of providing a reference for the scientific and sustainable utilization of soil in the Qinghai-Tibet Plateau region.
Materials and methods
Overview of the study area
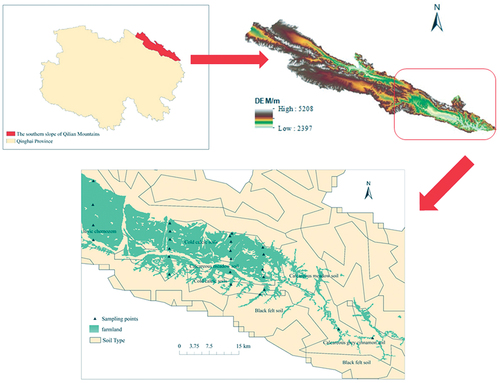
The Qilian Mountains across the Gansu and Qinghai provinces in China, serve as a crucial ecological security barrier within the arid region of Northwest China (Wang et al. Citation2017). In this study, the term ‘southern slope of the Qilian Mountains’ specifically refers to the Qinghai area of China situated within the Qilian Mountains (Qiu et al. Citation2022). This area exhibits a complex topography, with prolonged annual sunshine hours ranging from approximately 2200 to 2900 h. The annual temperature fluctuates between −37.1°C and 30.5°C with an average annual temperature of a mere −5.9°C (Qiu et al. Citation2022). The annual precipitation is concentrated from June to August, which accounts for an average annual precipitation of 300–400 mm. Notably, there are distinct horizontal and vertical gradients in the temperature and precipitation. The region is characterized as a typical alpine region that experiences both lengthy frigid winters and brief cool summers. The gentle slope areas, such as the Menyuan Basin, harbor a large number of farmland ecosystems, making Menyuan County a unique agricultural stronghold within Qinghai Province. The geographical coordinates of the study area involve 98°08′13″–102°38′16″ E and 37°03′17″–39°05′56″ N, encompassing a total area of 2.4 × 10⁴ km2 with a cultivated land area of approximately 600 km2. The growing season for plants spans 100–150 d without an absolute frost – free period. The crop growth period aligns with the precipitation season, providing favorable conditions for the cultivation of barley, oats, and rapeseed. The soil in the study area is weakly alkaline, primarily consisting of cold calcic soil, chernozem, calcareous meadow soil, calcareous gray cinnamon soil, and other soil types commonly identified in cultivated lands within Menyuan County.
Experimental design and soil sampling
Based on the 2015 land use status map (1:1 million), soil type map, and DEM digital elevation model of Menyuan County (land use and soil type data were obtained from https://www.resdc.cn, and DEM data were sourced from https://www.gscloud.cn) and based on crop planting information provided by the local agricultural department, a field investigation of farmland within the region was conducted in August 2021. No-rainfall days were selected within an elevation range of 2400–3200 m, Focusing on four main soil types: cold calcareous, limey gray-brown, leached black calcareous, and limey meadow. Soil tillage practices in the study area are stable, with predominant crops such as rapeseed, barley, and oats, making them a crucial source of commercial oilseeds in Qinghai Province and a key area for Tibetan barley seed production, often referred to as the ‘homeland of northern rapeseed’ in China. The farmland follows a traditional crop rotation system, primarily wheat-barley and barley-rapeseed. The plowing depth is approximately 20 cm, and the fertilizer application rate is 24 kg ha−3. Crop maturity spans April to September, with a fallow period from October to March of the following year. To mitigate the effects of specific crops, representative sampling plots were selected for soil collection at a depth of 0–20 cm, including at least three different crops (barley, wheat, oats, and rapeseed).
During on-site sampling, basic information such as the geographical location and elevation of each sampling point was recorded (). A total of 26 sampling plots were established, with three random 1 m × 1 m sampling points in each plot. Soil samples were collected using a soil auger with a 5 cm diameter, yielding a total of 78 soil samples. After sampling, a portion of the soil was brought back to the laboratory in self-sealing bags, air-dried, and subjected to removal of large rocks, undecomposed plant roots, and stems. Some samples were used to determine soil mechanical composition, while others were sieved to measure nutrient content, such as soil organic carbon (SOC), total nitrogen (TN), available phosphorus (AP), and available potassium (AK). Additionally, at each sampling point, an intact soil sample was collected using a soil ring cutter, and its fresh weight was measured. The sealed samples were then taken back to determine the bulk density and moisture content.
Figure 1. Overview map of the study area.
Analysis of soil physical and chemical properties
The soil water content (SWC) was quantified utilizing the oven-drying method at 105°C until a constant weight was achieved. Soil bulk density was determined using the ring knife method. This involved utilizing a 100 cm3 ring knife to extract a soil sample from the soil profile. After weighing, the mass of the ring knife was subtracted to derive the soil mass. The volume of the ring knife represents the soil volume, allowing for the calculation of soil bulk density. The soil mechanical composition analysis was conducted using a Mastersizer 2000 laser particle size analyzer manufactured by Malvern, UK, With a measurement range of 0.2 to 2000 μm. Adhering to the international soil particle size classification method, the soil was categorized into sand particles (0.02–2 mm), silt particles (0.002–0.02 mm), and clay particles (<0.002 mm). The specific measurement process involved taking 0.35 g of soil, adding 30% H2O2, low-temperature boiling to eliminate organic matter, adding dilute hydrochloric acid to remove carbonate, and then allowing it to stand for 12 h before the measurement. Each sample was measured three times, and the soil particle size and cumulative percentage content corresponded to particle volume fractions of 5%, 16%, 25%, 50%, 75%, 84%, and 95%, respectively (Mei et al. Citation2014). The soil conductivity was assessed using a conductivity meter (DDS–307). SOC and soil TN contents were analyzed using an elemental analyzer (Costech ECS4010/4024, U.S.A.). The soil pH was measured using a pH meter (pHs–3C). Soil nitrogen (N), phosphorus (P), and potassium (K) contents were determined following the standards of Bremner and Keeney.
Soil quality assessmen
In this study, a comprehensive assessment of soil quality was conducted using 15 indicators that had a significant impact on soil quality. The collected data were tested using the KMO measure. According to the correlation rules of the test, the correlation between the KMO test variables ranges from 0 to 1. As the KMO statistic approaches 1, the correlations between variables strengthen, partial correlations diminish, and the efficacy of factor analysis improves. In the actual analysis, the effect is optimal when the KMO statistic is greater than 0.7. In this study, the value of the KMO statistic was 0.738, making it suitable for the factor analysis. The aim was to reduce the dimensionality of the full data set and establish a comprehensive soil quality index. PCA was employed to group indicators with eigenvalues ≥ 1, and the comprehensive load was calculated to establish the MDS (Abdel–Fattah et al. Citation2021). The calculation formula employed in this process is as follows:
where Nik denotes the cumulative factor load of index i in all k principal components; Uik denotes a single factor load of index i; and λk denotes the eigenvalue of the kth principal component.
The linear scores for the soil parameters were calculated using a linear function. Based on the positive and negative impacts of the evaluation indices on the soil quality within the plow layer, membership functions were constructed to establish the relationship between the indices and soil quality. Subsequently, the membership values of the indices included in MDS were calculated (Chen et al. Citation2019).
S-type membership function is
The inverse S-type membership function is
Parabolic membership function is
where x represents the measured value of the evaluation index; a and b respectively represent the lower and upper limits of the critical value of the index, which are the minimum and maximum values measured; a1 and a2 respectively represent the lower and upper limits of the critical value of the index, which are the minimum and maximum values measured; and b1 and b2 respectively represent the lower and upper limits of the optimal value. Following the approach outlined by Chen et al. (Citation2019), the minimum and maximum measured values were adopted in this study.
The linear score of each index and weight factors were weighted and summed to calculate the soil quality index (SQI). The formula used is as follows:
where Ni and Wi represent the linear score and weight coefficient corresponding to the i th evaluation index, respectively; and n represents the total number of soil indices in the data set.
Data processing
The data analysis in this study involved the utilization of IBM SPSS 26 software (IBM, U.S.A.) to assess normality, perform PCA, and examine data correlations. The normality of the data distribution was assessed using the Shapiro – Wilk test. To compare differences among various data groups, one-way ANOVA and the Duncan test were employed. PCA considered all the parameters. For data visualization, charts were generated using Origin 2023 software (OriginLab, U.S.A.).
Results
Soil physical and chemical properties
Soil physical properties
The results presented in demonstrated that the mean SWC of the different soil types on the southern slope of the Qilian Mountains was in the order of luvic chernozem (24.14%) > calcareous gray cinnamon soil (23.89%) > cold calcic soil (22.08%) > calcareous meadow soil (18.65%). Specifically, the SWC of luvic chernozem and calcareous gray cinnamon soil were respectively significantly higher than that of calcareous meadow soil by 29.44% and 28.1%, whereas the SWC content of cold calcic soil did not show a significant difference. Regarding BD, calcareous meadow soil had a significantly higher value (1.05 g cm−3) compared to calcareous gray cinnamon soil (0.92 g cm−3) and luvic chernozem (0.95 g cm−3) by 14.13% and 10.53%, respectively, but did not differ significantly from cold calcic soil (1.01 g cm−3). The mean soil pH values were observed in the following order: calcareous meadow soil (8.09) > calcareous gray cinnamon soil (8.01) > luvic chernozem (8) > cold calcic soil (7.88). No significant differences in soil pH were observed between the different soil types. In terms of electrical conductivity (EC), luvic chernozem exhibited a significantly higher value (222.75 μS cm−1) compared to calcareous gray cinnamon soil (129.85 μS cm−1). However, there were no significant differences in EC between luvic chernozem and calcareous meadow soil (184.53 μS cm−1), as well as cold calcic soil (153 μS cm−1).
Table 1. Differences in soil physical properties across different soil types.
Analysis of soil particle size among different soil types revealed that the particle distribution followed the order of silt particles > sand particles > clay particles. Among the soil types, luvic chernozem exhibited the highest content of clay particles (5.29%) and silt particles (75.26%). Specifically, the clay particle content in luvic chernozem was significantly higher than that in calcareous meadow soil (3.27%). However, there was no significant difference in clay particle content between the cold calcic soil (4.5%) and calcareous gray cinnamon soil (4.47%). The silt particle content in luvic chernozem was significantly higher than that in calcareous meadow soil (54.04%) and calcareous gray cinnamon soil (61.01%), whereas no significant difference was observed between luvic chernozem and cold calcic soil. Furthermore, the silt particle content in cold calcic soil was significantly higher than that in the calcareous meadow soil. The calcareous meadow soil exhibited the highest sand particle content (42.69%), which was significantly higher than that of cold calcic soil (29.19%) and luvic chernozem (19.45%). No significant difference in sand particle content was observed between the calcareous gray cinnamon soil (34.52%) and calcareous meadow soil. Notably, the content of sand particles in the calcareous gray cinnamon soil was significantly higher than that in the luvic chernozem soil.
Soil chemical properties
indicates that luvic chernozem exhibited the highest soil TN content (6.75 g kg−1), which was significantly higher compared to cold calcic soil (5.82 g kg−1) and calcareous meadow soil (5.18 g kg−1), representing increases of 15.98% and 30.31%, respectively. No significant difference was observed in the TN content between luvic chernozem and calcareous gray cinnamon soil, although the TN content of calcareous gray cinnamon soil was 21.62% higher than that of calcareous meadow soil. Regarding total carbon (TC) content, luvic chernozem displayed a significantly higher value (42.72 g kg−1) compared to cold calcic soil (35.38 g kg−1), calcareous meadow soil (29.81 g kg−1), and calcareous gray cinnamon soil (35.45 g kg−1), representing increases of 20.72%, 43.31%, and 20.51%, respectively. The mean values of total phosphorus (TP) content in different soil types were ranked as follows: calcareous gray cinnamon soil (2.57 g kg−1) > cold calcic soil (2.55 g kg−1) > luvic chernozem (2.42 g kg−1) > calcareous meadow soil (2.25 g kg−1). No significant differences were observed in TP content among the four soil types. The content of total potassium (TK) in calcareous gray cinnamon soil (22.79 g kg−1) was significantly higher than that in luvic chernozem (19.89 g kg−1) and calcareous meadow soil (21.37 g kg−1), representing 14.58% and 6.64% higher than those in luvic chernozem (19.89 g kg−1) and calcareous meadow soil (21.37 g kg−1), respectively. No significant difference was identified in the TK content between calcareous gray cinnamon soil and cold calcic soil. Furthermore, the TK content in cold calcic soil and calcareous meadow soil was significantly higher than that in luvic chernozem, representing increases of 10.96% and 7.4%, respectively. The SOC content in luvic chernozem (38.33 g kg−1) was significantly higher than that in cold calcic soil (28.54 g kg−1), calcareous meadow soil (20.7 g kg−1), and calcareous gray cinnamon soil (29.4 g kg−1), representing increases of 34.3%, 85.17%, and 30.37%, respectively. Additionally, the SOC content of the cold calcic soil and calcareous gray cinnamon soil was significantly higher than that of the calcareous meadow soil, representing increases of 37.87% and 42.03%, respectively. The content of alkaline – hydrolyzable nitrogen (AN) in luvic chernozem (226 mg kg−1) was significantly higher than that in cold calcic soil (171.19 mg kg−1), calcareous meadow soil (134.83 mg kg−1), and calcareous gray cinnamon soil (167.9 mg kg−1), representing increases of 32.02%, 67.62%, and 34.6%, respectively. No significant differences were observed in AP and AK contents among the different soil types. The average AP content followed the order of luvic chernozem (46.93 mg kg−1) > calcareous gray cinnamon soil (32.22 mg kg−1) > cold calcic soil (32.2 mg kg−1) > calcareous meadow soil (31.83 mg kg−1). Similarly, the average AK content displayed the following sequence: calcareous meadow soil (143.67 mg kg−1) > cold calcic soil (139.26 mg kg−1) > luvic chernozem (130.17 mg kg−1) > calcareous gray cinnamon soil (122.8 mg kg−1).
Table 2. Differences in soil chemical properties across different soil types.
Establishment of MDS based on PCA
To identify the key indicators for evaluating soil quality, PCA and correlation analysis were conducted on the soil physical and chemical properties. As presented in , four principal components (PC1, PC2, PC3, and PC4) with eigenvalues > 1 accounted for 81.17% of the total variance in the farmland cold calcic soil on the southern slope of the Qilian Mountains. The greater the load value of the index factor, the greater the weight of the principal component, and the greater the impact on the soil. In the first principal component, the soil indices with significant loadings were pH, TN, TC, SOC, and AN. The second principal component included SWC, BD, clay particles, silt particles, and sand particles. The third principal component comprised EC, TP, AP, and AK, whereas the fourth principal component consisted solely of TK. Based on the selection principle of the Norm value and correlation, indices with the highest norm values within a 10% difference were selected (Gou et al. Citation2023). In the first principal component, the order of the norm values was TN > AN > TC > SOC > pH. The soil indices with norm values less than 10% were TN, TC, and AN. Considering the significant correlation between TN, TC, and AN (p < 0.01), TN was selected for inclusion in MDS. Similarly, within the second principal component, the soil indices with Norm values less than 10% difference were sand particles, silt particles, SWC, and clay particles. Sand particles were significantly correlated with silt particles, SWC, and clay particles (p < 0.01), leading to their inclusion in the MDS. The TP from the third principal component was included in the MDS. Finally, TK from the fourth principal component was included in the MDS.
Table 3. PCA results of soil quality indices for cold calcic soil.
Based on the results presented in , the three principal components (PC1, PC2, and PC3) with eigenvalues > 1 accounted for 94.45% of the total variance in the farmland luvic chernozem on the southern slope of the Qilian Mountains. Through PCA, the soil indices associated with the first principal component were BD, clay particles, silt particles, sand particles, TN, TK, AN, AP, and AK. The second principal component encompassed pH, EC, TC, TP, and SOC, whereas the third principal component included SWC. Based on the Norm value and the principle of correlation selection, the indicators that were ultimately included in the MDS were clay particles, TN, AN, AK, TP, and SWC.
Table 4. PCA results of soil quality indices in luvic chernozem soils.
Based on the findings presented in , three principal components (PC1, PC2, and PC3) with eigenvalues > 1 accounted for 84.23% of the total variance in the calcareous meadow soil on the southern slope of the Qilian Mountains. The PCA revealed that the soil indices associated with the first principal component were BD, pH, clay particles, silt particles, sand particles, TN, TC, TP, SOC, AN, AP, and AK. The second principal component encompassed EC and TK, whereas the third principal component included SWC. Utilizing the Norm value and the principle of correlation selection, the indicators that were ultimately included in the MDS were TC, EC, and SWC.
Table 5. PCA results of soil quality indices for calcareous meadow soil.
From , the two principal components (PC1 and PC2) with eigenvalues > 1 accounted for 74.85% of the total variance in the calcareous gray cinnamon soil on the southern slope of the Qilian Mountains. Through PCA, the soil indices in the first principal component included SWC, pH, clay particles, silt particles, sand particles, TP, TK, AN, and AP, and the soil indices in the second principal component included BD, EC, TN, TC, SOC, and AK. According to the selection principle of norm values and correlations, the indicators that were eventually included in the MDS were pH, BD, and AK.
Table 6. PCA results of soil quality indices for calcareous gray cinnamon soil.
Soil quality assessment
Soil quality assessment based on MDS
Following the standardization of all evaluation indices, PCA was conducted to obtain the weight of each index based on the proportion of the common factor variance to the total common factor variance of all indices (). A membership function was employed to determine the membership degree of each index. The index weights for the MDS of cold calcic soil were as follows: TK (0.355) > TP (0.255) > sand particles (0.224) > TN (0.166). The index weights for luvic chernozem were as follows: TN (0.195) > clay particles (0.193) > AP (0.188) > AK (0.173) > AN (0.148) > SWC (0.103). The index weights for the calcareous meadow soil were SWC (0.357) > EC (0.324) > TC (0.319), and for the calcareous gray cinnamon soil, they were BD (0.338) > AK (0.331) > pH (0.33). In the study area, TN, TC, TP, TK, AN, AP, AK, SOC, and soil quality exhibited positive correlations represented by an S-type function. Conversely, higher EC values adversely affected crop growth, exhibiting a negative correlation with soil quality, characterized by a defined inverse S – type function. Soil SWC, BD, pH, clay particles, silt particles, and sand particles demonstrated appropriate critical ranges during the soil quality evaluation process, defined by the above indices as parabolic functions. Combined with the weight values and membership degrees of each index, the soil quality index range for cold calcic soil, calculated based on the entire data set and the MDS, was 0.38–0.79 and 0.35–0.85, respectively, with an average value of 0.55. For luvic chernozem, the soil quality index values for the entire data set and the MDS were 0.45–0.84 and 0.4–0.97, respectively, with average values of 0.66 and 0.63. The soil quality index values for calcareous meadow soil, based on the entire data set and the MDS, ranged from 0.43 to 0.89 and 0.45 to 0.75, respectively, with average values of 0.6 and 0.58. The soil quality index values for calcareous gray cinnamon soil, considering the entire data set and the MDS, ranged respectively from 0.41 to 0.92 and 0.35 to 0.98 with an average value of 0.59. Hence, the soil quality index of the MDS for different soil types on the southern slope of the Qilian Mountains was in the following order: luvic chernozem > calcareous gray cinnamon soil > calcareous meadow soil > cold calcic soil. Soil quality was categorized into grades I – VI, corresponding to index values > 0.7, (0.6, 0.7], (0.5–0.6], (0.4–0.5], (0.3–0.4], and ≤ 0.3, respectively. The luvic chernozem was assigned in grade II, representing the ‘upper middle’ level, while the soil quality grades of calcareous gray cinnamon soil, calcareous meadow soil, and cold calcic soil were grade III, indicating the ‘medium’ level.
Table 7. Common factor variance and index weight of total data set (TDS).
Table 8. Common factor variance and index weight of MDS.
Accuracy verification of MDS evaluation
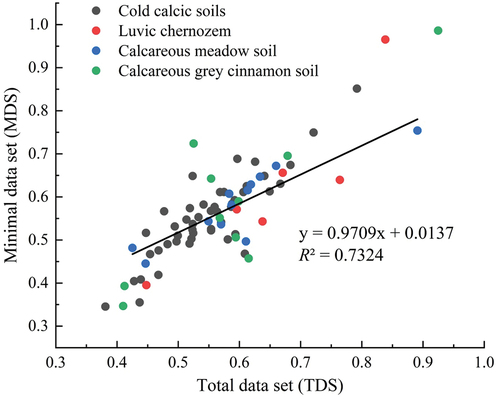
The construction of the MDS plays a crucial role in ensuring the accuracy of the soil quality evaluation. Excessive simplification of the indicators would result in a decline in the accuracy of such evaluations. Hence, it became necessary to compare and analyze the difference between the soil quality index calculated using the complete set of indicators (TDS) and the soil quality index derived from the MDS calculation. Regression analysis was employed to examine the soil quality index values of both data sets, and the accuracy of the soil quality index values calculated using the MDS was assessed in comparison to those obtained from the entire data set. The corresponding results are depicted in . The fitting effect of TDS and MDS exhibited a significant positive correlation with an R2 value of 0.7324, providing evidence of the high accuracy of the MDS employed in this study. Consequently, the soil quality index developed based on the MDS effectively evaluated the quality of various soil types within the study area.
Figure 2. Correlation analysis of soil quality indices between MDS and TDS.
Discussions
Selection of soil quality evaluation indices for MDS
Soil quality evaluation primarily relies on the assessment and measurement of soil physical, chemical, and biological characteristics on temporal or spatial scales (Roy et al. Citation2022). This evaluation process is affected by various factors such as soil properties, land use practices, management methods, and microclimate conditions (Lori et al. Citation2022). Although the full data set of soil indicators can typically provide a comprehensive and accurate assessment of soil quality, it can be time-consuming and labor-intensive. Therefore, researchers often utilize the MDS to simplify soil evaluation indicators. Therefore, screening of soil indicators has become particularly crucial in establishing a soil quality evaluation system (Mazzon et al. Citation2021). Currently, in both domestic and international soil quality evaluation index systems based on MDS, there is a relatively higher selection rate of physical and chemical indicators compared to biological indicators (Mazzon et al. Citation2021). The selected soil physical and chemical indicators included soil BD, pH, TN, organic carbon, and AP (Nosrati Citation2013; Mukhopadhyay et al. Citation2016). In terms of farmland soil quality indicators, researchers have emphasized that soil BD, clay content, and pH value are nearly necessary indicators in soil quality evaluation for studying the soil quality evaluation indicators of sloping farmlands with a usage frequency of 90%. The frequency of TN usage was 70%, whereas silt, sand, organic matter, and porosity were employed at the second frequency of 60%. AP was selected with the third frequency of 50% (Jin et al. Citation2018). Furthermore, the selection of available soil nutrients can provide direct insights into the nutrient supply during the soil quality evaluation process (Ghosh et al. Citation2020). Therefore, this study selected 15 soil properties, including soil BD, TN, AP, soil moisture, pH, and EC, as evaluation indices for TDS. These indices encompass physical parameters closely associated with soil pore structure and permeability, chemical parameters directly related to soil fertility, and soil alkalinity and salinity indices selected based on differences in soil types in Northwest China. Based on the application of PCA in conjunction with correlation analysis and the norm value approach, the SQI was calculated through the MDS to evaluate the soil quality of the four soil types in Menyuan County on the southern slope of the Qilian Mountains. The accuracy of the MDS was verified. By considering the load of each index on all principal components, the relevant information regarding the contribution of the index to other principal components was retained (Li et al. Citation2019), enabling the selection of key indicators for the assessment of soil quality. The soil quality index exhibited consistent trends between the full data set and MDS, indicating that the latter can effectively replace the former for evaluating farmland soil quality on the southern slope of the Qilian Mountains.
In this study, a total of 15 primary indicators were carefully selected. For cold calcic soil, the MDS included TK, TP, sand particles, and TN as indicators. For luvic chernozem, the MDS consisted of TN, clay particles, AP, AK, AN, and SWC as indicators, whereas for calcareous meadow soil, SWC, EC, and TC was used as indicators. Moreover, for calcareous gray cinnamon soil, the MDS comprised BD, AK, and pH as indicators. Through the screening process, the filtration rates for the four different soil types, including cold calcic soil, luvic chernozem, calcareous meadow soil, and calcareous gray cinnamon soil, reached 73.33%, 60%, 80%, and 80%, respectively, which is consistent with previous studies (Gou et al. Citation2023). This screening process significantly simplifies the evaluation indicators. It is noteworthy that soil TN, AK content, and SWC were selected twice as part of the MDS for all four soil types, indicating their significant impact on the soil quality in the region. Therefore, in the management of cultivated land, particular attention should be paid to the effective management of TN, available potassium, and water content to prevent the degradation of cultivated land into abandoned land (Gou et al. Citation2023).
Effects of different soil types on indicators of soil quality
In farmland ecosystems, soil properties, climate, and farming methods play crucial roles in affecting soil properties (Vasu et al. Citation2016). In this study, Menyuan County exhibited the presence of four distinct soil types in farmlands with consistent climate and farming practices. From the MDS indicators of these soil types, it was evident that soil nutrient-related indicators were selected for the MDS based on the types of cold calcic soil and luvic chernozem soil. This was attributed to the soil-forming conditions of these soil types, which are related to the nutrient dynamics. The lower soil of the cold calcic soil and luvic chernozem served as a calcic layer, and the luvic chernozem exhibited a more fertile black humus layer. The accumulation of soil organic matter often exceeds its decomposition, particularly thriving under vegetation in temperate semi-humid and semi-arid regions with high potential fertility (Artemyeva et al. Citation2021). In cold calcareous soils within semi-arid climates, the dry soil surface is characterized by sand accumulation, making soil nutrient levels a key factor affecting soil quality. Conversely, the MDS indicators selected for calcareous meadow soil and calcareous gray cinnamon soil were more associated with the physical properties of the soil itself, such as pH, EC, and BD. This arose from the fact that a significant portion of the soil in the study area exhibited weak alkalinity, as was typical for the northwest region of China. Meadow soil, a semi-hydrated soil type, often develops in areas influenced by groundwater, though the natural vegetation covering the cultivated meadow soil has been disturbed. This can lead to the loosening of the upper humus and grass root layers. Consequently, the plow layer experienced enhanced aeration, resulting in accelerated nutrient decomposition and making the plow layer susceptible to soil salinization. The principal soil formation processes of calcareous lime brown soil involve humus accumulation, weak viscidity, and moderate leaching, resulting in a loose and permeable soil. Therefore, pH, BD, and other related physical indicators have emerged as pivotal indicators of soil quality owing to the inherent characteristics of soil.
Evaluation of soil quality in alpine farmland
The alpine farmland ecosystem, influenced by both the natural environment and human activities, is highly sensitive to global climate change. Moreover, its unique geographical position plays a critical role in ensuring food security, ecological stability, and social equilibrium in ecologically fragile regions (Qiu et al. Citation2022). Soil quality assessment is fundamental for the sustainable utilization of alpine farmlands. In this study, based on MDS, the calculated average soil quality index of the four soil types in Menyuan County on the southern slope of the Qilian Mountains was 0.59. The calculated soil quality of agricultural land soil quality in both the northern and southern regions of the Qinghai-Tibet Plateau surpasses the reported value of 0.48 by Gou et al. (Citation2023). This disparity can be attributed to the broader scope of the northern and southern regions of the Qinghai – Tibet Plateau compared with the specific selection of Menyuan County on the southern slope of the Qilian Mountains in this study. The latter exhibited a relatively rich collection of soil quality information from sampling sites, including the barren southern region of the northern Qinghai – Tibet Plateau (Zhao et al. Citation2019). In contrast, the samples in this study were derived from the southern slope of the Qilian Mountains, situated on the northeastern margin of the Qinghai – Tibet Plateau, which can be regarded as abundant farmland resources. Menyuan County, renowned as the ‘hometown of northern small rape’ in China, serves as a representative for assessing the soil quality status of the southern slope of the Qilian Mountains. This further underscores variations in the selection of evaluation index systems across different study areas (Luján Soto et al. Citation2021). According to the MDS indices for the four distinct soil types, it was evident that soil nutrient levels significantly influenced soil quality in the study area. Geochemical evaluations (1:250,000) of land quality conducted by Liu et al. (Citation2022) in Menyuan County illustrated that, overall, soil nutrients are abundant or relatively rich with the exception of phosphorus which demonstrates moderate content. The other nutrients were present in high concentrations. Thus, future research endeavors should encompass an analysis of the interaction between the base conditions of alpine farmland soil and human factors including phosphate fertilizer application and cultivation management, to elucidate the mechanisms of the changes in soil quality within alpine farmland systems.
Conclusion
This study comprehensively assessed soil quality in highland agricultural fields with varying soil types based on a minimum data set (MDS). The MDS values for the cold calcareous soil, leached black calcareous soil, limey meadow soil, and limey gray-brown soil were determined to be 0.55, 0.63, 0.58, and 0.58, respectively. In descending order, the soil quality ranking was leached black calcareous soil > limey gray-brown soil > limey meadow soil > cold calcareous soil. Leached black calcareous soil attained a level II classification, indicating a ‘moderately high’ level. Whereas limey gray-brown, limey meadow, and cold calcareous soils were classified as level III, representing a ‘moderate’ level. The MDS evaluation results exhibited a highly significant positive correlation with those derived from the Total Data Set (TDS) (R2 = 0.7324), confirming the rationality of constructing the soil quality MDS index. Overall, soil nutrients such as nitrogen, phosphorus, and potassium emerged as the most representative MDS indicators in the study area. This underscores the importance of soil nutrient management in land management practices, emphasizing appropriate fertilization strategies to minimize soil nutrient loss. The findings of this study results offer valuable insights for guiding sustainable development and management of land in the Qilian Mountain region.
Disclosure statement
No potential conflict of interest was reported by the author(s).
Additional information
Funding
References
- Abdel–Fattah MK, Mohamed ES, Wagdi EM, Shahin SA, Aldosari AA, Lasaponara R, Alnaimy MA. 2021. Quantitative evaluation of soil quality using principal component analysis: the case study of El–Fayoum depression Egypt. Sustainability. 13(4):1824. doi: 10.3390/su13041824.
- Artemyeva Z, Danchenko N, Kolyagin Y, Kirillova N, Kogut B. 2021. Chemical structure of soil organic matter and its role in aggregate formation in haplic chernozem under the contrasting land use variants. Catena. 204:105403. doi: 10.1016/j.catena.2021.105403.
- Barrios E, Delve RJ, Bekunda M, Mowo J, Agunda J, Ramisch J, Trejo MT, Thomas RJ. 2006. Indicators of soil quality: a south–south development of a methodological guide for linking local and technical knowledge. Geoderma. 135:248–259. doi: 10.1016/j.geoderma.2005.12.007.
- Bünemann EK, Bongiorno G, Bai Z, Creamer RE, De Deyn G, de Goede R, Fleskens L, Geissen V, Kuyper TW, Mäder P, et al. 2018. Soil quality – A critical review. Soil Biol Biochem. 120:105–125. doi: 10.1016/j.soilbio.2018.01.030.
- Chen ZF, Shi DM, Jin HF, Lou YB, He W, Xia JR. 2019. Soil quality evaluation of slope cultivated land based on soil management evaluation framework in Yunnan province. TCSAE. 35(3):256–267.
- Choudhary M, Meena VS, Panday SC, Mondal T, Yadav RP, Mishra PK, Bisht JK, Pattanayak A. 2021. Long–term effects of organic manure and inorganic fertilization on biological soil quality indicators of soybean–wheat rotation in the Indian mid–Himalaya. Appl Soil Ecol. 157:103754. doi: 10.1016/j.apsoil.2020.103754.
- De Paul Obade V, Lal R. 2014. Soil quality evaluation under different land management practices. Environ Earth Sci. 72(11):4531–4549. doi: 10.1007/s12665-014-3353-z.
- Fang J, Yu G, Liu L, Hu S, Chapin FS. 2018. Climate change, human impacts, and carbon sequestration in China. Proc Natl Acad Sci USA. 115(16):4015–4020. doi: 10.1073/pnas.1700304115.
- Ghosh A, Singh AB, Kumar RV, Manna MC, Bhattacharyya R, Rahman MM, Sharma P, Rajput PS, Misra S. 2020. Soil enzymes and microbial elemental stoichiometry as bio–indicators of soil quality in diverse cropping systems and nutrient management practices of Indian vertisols. Appl Soil Ecol. 145:103304. doi: 10.1016/j.apsoil.2019.06.007.
- Gou GH, Fan J, Wang Q, Zhou MX, Yang XT. 2023. Soil quality evaluation of different land use patterns on the southern and northern Qinghai-Tibet plateau based on minimal data set. Ying Yong Sheng Tai Xue Bao. 34(5):1360–1366. doi: 10.13287/j.1001–9332.202305.020.
- Jat RA, Reddy KK, Choudhary RR, Rawal S, Thumber B, Misal N, Zala PV, Mathukia RK. 2021. Effect of conservation agriculture practices on soil quality, productivity, and profitability of peanut‐based system of Saurashtra, India. Agron J. 113(2):2102–2117. doi: 10.1002/agj2.20534.
- Jin HF, Shi DM, Chen ZF, Liu YJ, Lou YB, Yang X. 2018. Evaluation index of topsoil quality of red sloping farmland based on clustering and PCA analysis. TCSAE. 34(7):155–164.
- Juice SM, Schaberg PG, Kosiba AM, Waite CE, Hawley GJ, Wang D, Perdrial JN, Adair EC 2022. Soil type modifies the impacts of warming and snow exclusion on leachate carbon and nutrient losses. Biogeochemistry. 160(2):199–217. doi: 10.1007/s10533–022–00949–1.
- Karlen DL, Mausbach MJ, Doran JW, Cline RG, Harris RF, Schuman GE. 1997. Soil quality: a concept, definition, and framework for evaluation (A guest editorial). Soil Sci Soc Am J. 61(1):4–10. doi: 10.2136/sssaj1997.03615995006100010001x.
- Li Q, Jia Z, Liu T, Feng L, He L. 2017. Effects of different plantation types on soil properties after vegetation restoration in an alpine sandy land on the Tibetan Plateau, China. J Arid Land. 9(2):200–209. doi: 10.1007/s40333–017–0006–6.
- Li P, Shi K, Wang Y, Kong D, Liu T, Jiao J, Liu M, Li H, Hu F. 2019. Soil quality assessment of wheat–maize cropping system with different productivities in China: establishing a minimum data set. Soil Tillage Res. 190:31–40. doi: 10.1016/j.still.2019.02.019.
- Liu ZF, Fu BJ, Liu GH, Zhu YG. 2006. Soil quality and soil quality indicators and their evaluation. Chinese J Ecol. 58(3):901–913.
- Liu QY, Ma Y, Cheng L. 2022. Geochemical evaluation of soil quality in Menyuan County, Qinghai Province. Geology And Exploration. 58(3):609–618.
- Lori M, Armengot L, Schneider M, Schneidewind U, Bodenhausen N, Mäder P, Krause H.M. 2022. Organic management enhances soil quality and drives microbial community diversity in cocoa production systems. Sci Total Environ. 834:155223. doi: 10.1016/j.scitotenv.2022.155223.
- Luján Soto R, Martínez–Mena M, Cuéllar Padilla M, De Vente J. 2021. Restoring soil quality of woody agroecosystems in Mediterranean drylands through regenerative agriculture. Agr Ecosyst Environ. 306:107191. doi: 10.1016/j.agee.2020.107191.
- Mazzon M, Cavani L, Ciavatta C, Campanelli G, Burgio G, Marzadori C. 2021. Conventional versus organic management: application of simple and complex indexes to assess soil quality. Agr Ecosyst Environ. 322:107673. doi: 10.1016/j.agee.2021.107673.
- Mei S, Nan S, Yunxiang H. 2014. Multifractal characteristics of particle size distribution in red soil with different fertilization over a long period of time. Zhongguo Nong Ye Ke Xue. 47(11):2173–2181.
- Mukhopadhyay S, Masto RE, Yadav A, George J, Ram LC, Shukla SP. 2016. Soil quality index for evaluation of reclaimed coal mine spoil. Sci Total Environ. 542:540–550. doi: 10.1016/j.scitotenv.2015.10.035.
- Mulumba LN, Lal R. 2008. Mulching effects on selected soil physical properties. Soil Tillage Res. 98(1):106–111. doi: 10.1016/j.still.2007.10.011.
- Nortcliff S. 2002. Standardisation of soil quality attributes. Agr Ecosyst Environ. 88(2):161–168. doi: 10.1016/S0167–8809(01)00253–5.
- Nosrati K. 2013. Assessing soil quality indicator under different land use and soil erosion using multivariate statistical techniques. Environ Monit Assess. 185(4):2895–2907. doi: 10.1007/s10661–012–2758–y.
- Nyamasoka-Magonziwa B, Vanek SJ, Ojiem JO, Fonte SJ. 2020. A soil tool kit to evaluate soil properties and monitor soil health changes in smallholder farming contexts. Geoderma. 376:212–225. doi: 10.1016/j.geoderma.2020.114539.
- Panico SC, Esposito F, Memoli V, Vitale L, Polimeno F, Magliulo V, Maisto G, De Marco A. 2020. Variations of agricultural soil quality during the growth stages of sorghum and sunflower. Appl Soil Ecol. 152:103569. doi: 10.1016/j.apsoil.2020.103569.
- Qiu XX, Cao GC, Zhang Z, Zhao ML, He QX, Cheng MY, Gao SY. 2022. Vertical distribution characteristics of soil organic carbon and total nitrogen density in alpine farmland and their relationship with altitude. Chin J Soil Sci. 53(3):623–630.
- Roy D, Datta A, Jat HS, Choudhary M, Sharma PC, Singh PK, Jat ML. 2022. Impact of long term conservation agriculture on soil quality under cereal based systems of North West India. Geoderma. 405:115391. doi: 10.1016/j.geoderma.2021.115391.
- Takoutsing B, Weber J, Aynekulu E, Rodríguez Martín JA, Shepherd K, Sila A, Tchoundjeu Z, Diby L. 2016. Assessment of soil health indicators for sustainable production of maize in smallholder farming systems in the highlands of Cameroon. Geoderma. 276:64–73. doi: 10.1016/j.geoderma.2016.04.027.
- Vasu D, Singh SK, Ray SK, Duraisami VP, Tiwary P, Chandran P, Nimkar AM, Anantwar SG. 2016. Soil quality index (SQI) as a tool to evaluate crop productivity in semi–arid Deccan plateau, India. Geoderma. 282:70–79. doi: 10.1016/j.geoderma.2016.07.010.
- Velasquez E, Lavelle P, Barrios E, Joffre R, Reversat F. 2005. Evaluating soil quality in tropical agroecosystems of Colombia using NIRS. Soil Biol Biochem. 37(5):889–898. doi: 10.1016/j.soilbio.2004.09.009.
- Wang Z, Chang AC, Wu L, Crowley D. 2003. Assessing the soil quality of long–term reclaimed wastewater–irrigated cropland. Geoderma. 114(3–4):261–278. doi: 10.1016/S0016–7061(03)00044–2.
- Wang T, Gao F, Wang B, Wang PL, Wang QH, Song HL, Yin CL. 2017. Current problems and suggestions of ecological protection and restoration in qilian mountains. J Glaciol Geocryol. 39(2):229–234.
- Yu P, Liu S, Zhang L, Li Q, Zhou D. 2018. V selecting the minimum data set and quantitative soil quality indexing of alkaline soils under different land uses in northeastern China. Sci Total Environ. 616:564–571. doi: 10.1016/j.scitotenv.2017.10.301.
- Zhao WL, Luo TX, Zhang L. 2019. Relative effects of climate change and grazing on vegetation indices of typical alpine desert grasslands in Tibet. Sheng Tai Xue Bao. 39(22):8494–8503.