
ABSTRACT
To mitigate the ravages of COVID-19, governments across the world imposed limitations on human movement from early 2020 onwards. Such limitations were framed as aiming to achieve a balance between saving lives and livelihoods. One way to test the impact on livelihoods is to look at socio-economic metrics, and their spatial patterns over time. We draw on data from the UJ-HSRC national COVID-19 Democracy Survey, a nationally representative sample (n = 38 785), collected from April 2020 to July 2021. Changes in socio-economic and psycho-social conditions experienced by the adult population in South Africa are assessed. Whereas infection rates during this peak period of the pandemic reached about 5% of the population, with provincial variation between 2% and 7%, the experience of hunger and/or fear affected more than one-third. Feelings of fear were dominant in those areas where livelihoods were most affected by the pandemic. In terms of economic distress, results in successive survey rounds indicated decreases in the large metropolitan areas, but increases in other parts of the country. We claim that heavy-handed government-mandated prohibitions could have been mitigated by nuanced, differential mitigatory regulations that factored in the diverse socio-economic conditions in a country such as South Africa.
Introduction
The continuing impact and aftermath of the Coronavirus pandemic (COVID-19) is being experienced globally, with significant geographic patterns of relative financial distress emerging. We argue that the extent of infections, illness and fatalities is overshadowed by long-term social and economic consequences across the urban-rural spectrum.
From the start of the pandemic, official rhetoric, in South Africa and elsewhere, indicated the need to balance the threat to both ‘lives and livelihoods’. By August 2021, 6,9% of the population had been reported as infected, while GDP had declined by 7% and unemployment had increased by 2,5% during 2020 (Statistics South Africa Citation2021). The National Income Dynamics-Coronavirus Rapid Mobile Survey (NIDS-CRAM, Citation2020) study showed that by April 2020, almost all the settlements in Gauteng, for example, experienced a marked decline in employment. Back in 2020, President Ramaphosa’s government was advised that a lockdown was the only effective method of preventing ‘an exponential and uncontrolled increase in the infection rate’, and followed suit, announcing a nationwide stay-at-home order. Unsurprisingly, it was soon realized that in spite of an ‘unprecedented scale of emergency relief measures’ (including unemployment insurance pay-outs in the form of the COVID-19 Social Relief of Distress Grant and the Unemployment Insurance Fund-Temporary Employer/Employee Relief Scheme to about 2,5 million workers even within 2020), ‘people have to go back to work, and businesses have to begin to earn revenue’ (South Africa, Citation2020). A few weeks into the lockdown there was already international awareness of widespread social and psychological distress related to losing jobs, domestic abuse and social isolation, among others (Abrahams et al., Citation2020; fee.org, Citation2022; Kim et al., Citation2021; Naidoo et al., Citation2020; Padmanabhanunni & Pretorius, Citation2021). In the South African case, the associated increase in the incidence of hunger dictated the urgency of a re-opening of the economy (Hamann et al., Citation2020). However, the recovery of socio-economic conditions was at best partial, and, to our point, geographically uneven. Turok and Visagie (Citation2021) have reported on the unequal impact of COVID-19 on peoples’ livelihoods and well-being across different types of urban areas in South Africa. They also highlighted how women, especially those living in informal housing arrangements, were less likely than residents of formal townships or suburbs to have benefited from the UIF-TERS and SRD. Hart et al. (Citation2022) used the HSRC/UJ data to show the impact of the pandemic and shutdown on prevailing spatial inequalities in levels of food security, with Hunt et al. (Citation2021) showing a link between household hunger and mental health.
Our study also builds on other research that has characterized COVID-19-related sentiments spatially, considering local factors like socio-economic risk and feelings of depression. Studies such as the NIDS-CRAM (2020), NRF/DPME (Presidency of South Africa, Citation2021b), and the HSRC/UJ survey (Runciman et al., Citation2022) have each assessed the impacts of COVID-19 across various socioeconomic groups in the country. Similarly, using granular data from the Community Survey of 2016, Shifa et al. (Citation2021) identified a strong negative relationship between the level of wealth and vulnerability to COVID-19 infection. Their analyses revealed heterogeneity in levels of vulnerability between wealth quintiles at the municipal level. Multiple papers have used the NIDS data to assess a range of socio-economic impacts (Daniels & Casale, Citation2022), including employment levels, mental health, food security, and education. Such studies include the juxtaposing of panel data with macroeconomic and other policy interventions to elucidate impact at household and individual level. For instance, it appears that among the South African population, younger cohorts (when compared to older groups) were better placed to access work subsequent to the lockdown if they had been employed before the pandemic (Espi-Sanchis et al., Citation2022). Children were the most widely impacted concerning access to food and education, contingent on the discontinuation of the provision of meals at schools during the lockdown (Shepherd & Mohohlwane, Citation2022), and most vulnerable in this respect were adolescent girls, and learners without access to online or digital resources (Duby et al., Citation2022).
This paper comprises four sections. Firstly, we trace the spatial trajectory and extent of infections across the country, noting that regional variation in experience is to be expected (drawing on cases from the Global North where a similar phenomenon was already documented in the early stages of the pandemic). Secondly, we set out the survey methodology and the challenges of online research in a developing country under lockdown circumstances. Thirdly, we discuss the differential extent and distribution of social and economic distress that emerge from the results of the survey, concerning spatial disparities in levels of poverty and demographics. We conclude with observations about metrics of relevance for assessing the unintended consequences of public health measures that have been utilized to counter the spread of the virus.
Trajectory of the epidemiological impact
The first COVID-19 case identified in South Africa was a male resident returning from a trip to Italy to his home in KwaZulu-Natal in March 2020 (NICD, Citation2020), and the first outbreak occurred in the Western Cape, a favoured destination of European tourists. A total of 322 624 international tourists arrived through Cape Town International Airport from January to March 2020 (StatsSA, Citation2020b; Wesgro, Citation2020), simultaneous with increasing rates of infection in Germany, the UK, France, the Netherlands and Italy, five of the top seven countries of origin of tourists to Cape Town (Cape Town Travel, Citation2018).
By August 2021, a total of 2 722 202 cases of COVID-19 had been confirmed in South Africa, 80 469 of which had been fatal. As in other countries, demographic comparisons with mortality rates in previous years revealed significant under-reporting (SAMRC, Citation2021). These official statistics signalled infection rates of 4,6% of the population, with provincial variations ranging from 2% in Limpopo, one of the poorest provinces, to 6,9% in the relatively wealthy Western Cape (South Africa, Citation2021a). This distribution contrasted strongly with the persistent differential access to health facilities (Carmalt & Faubion, Citation2010) between poor and wealthy localities. There were peaks of 13 200 new daily cases in July 2020, 22 000 in December 2020 and 22 900 in July 2021 (NICD, Citation2021).
In light of the initial breakout in March 2020, the president’s strident policy response was the ‘Level 5’ lockdown (SA had five levels of lockdown, with 5 being the strictest, each level permitting different restrictions and safety measures), imposed from 26 March until 30 April 2020. This included the prohibition of non-essential movement and public gatherings. Only ‘essential’ trips to work or to purchase food were permitted, subject to the wearing of masks, social distancing and the use of hand sanitizers in public spaces. The gradient of the graphic ‘curve’ depicting numbers of infections was temporarily impeded and ‘flattened’, as encouraged by government rhetoric, to ease pressure on the public health system. However, the lockdown came at a cost to the national economy, including levels of employment. The imperative of ‘protecting livelihoods’ pressurized the President to gradually ease restrictions whenever infection rates appeared to ebb, which saw the nation move from levels 5 to 2 during subsequent months in 2020, down to Level 1 by January 2021, again raised to Level 2 in May 2021 (South Africa, Citation2021c). In June 2021 ‘Level 4’ was reimposed in mitigation of the ‘Third Wave’ of infections (South Africa, Citation2021d).
Notably, the second wave of infections was significantly higher in the three provinces (Gauteng, KwaZulu-Natal, and the Western Cape) with the wealthiest and most densely populated metropolitan areas. The third wave of infections was markedly higher in Gauteng at its peak in July 2021, than in the other eight provinces ().
Figure 1. Covid-19 infections by province, April 2020 to August 2021
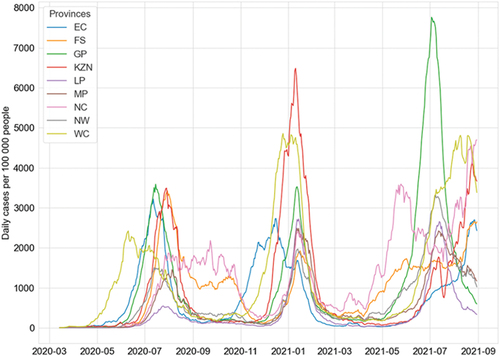
Source: Extrapolated from Marivate (Citation2021)
Prefacing our analysis of self-reported socioeconomic conditions and public sentiment during the pandemic, vis-à-vis variations in demography, economic activity and urban population density, we draw on the insights of researchers in the UK and the U.S.A. In England, using three dimensions of vulnerability (health, jobs, families), Davenport et al. (Citation2020) demonstrated an unequal geographical impact of the pandemic. Localities such as the Isle of Wight and Torbay were significantly more vulnerable than elsewhere in terms of health (owing to elderly demographics) and job losses (owing to a local reliance on the tourism and hospitality industries). Similarly vulnerable along dimensions of health and jobs were the West Midlands and Yorkshire, with disproportionate concentrations of older persons and a dependence on manufacturing. In the United States, Wheaton and Thompson (Citation2020) identified population density and income as key indicators of the spread of the virus, and Andersen et al. (Citation2021) determined that areas of especially high infection risk were in prisons, meatpacking plants, and nursing homes. COVID-19 cases were most prevalent in urban areas and areas with higher percentages of black individuals, non-English speakers and persons working in production, transportation, and material moving occupations. The locations, timing and severity of lockdowns implied varied socioeconomic effects.
Both these cases show the likelihood of the pandemic and lockdowns to have geographically varied effects. The US cases highlight the value of looking at conditions over time, while the UK study shows that even when the same policies were enacted simultaneously, the effect on communities varied. Our analysis of South Africa combines these two insights.
Methodology
Notwithstanding the continual production of provincial-level maps (South Africa, Citation2021a) of the epidemiological dimensions of the pandemic, similar endeavours showing other forms of distress – socioeconomic and psychological – are largely missing from the national discussion, an exception being the work of the Gauteng City Region Observatory (De Kadt et al., Citation2020). To address this gap, we used data gathered by the UJ-HSRC COVID Democracy Survey. A detailed methodological discussion of this survey is presented by Runciman et al. (Citation2022). It comprised four rounds between April 2020 and July 2021, and yielded 38,785 responses sufficiently complete for analysis. The distribution of responses from pooled data for the first three rounds of the surveys is depicted in .
Figure 2. Distribution of unweighted survey responses, showing concentrations in the cape town metro, Gauteng and eThekwini metro.
The survey instrument included about 30 questions, assembled from items used in other surveys – censuses, household finance surveys, epidemiological surveys, demographic and health surveys for commensurability and concurrent validation. The number of items fluctuated across the four rounds owing to some changed emphases during the course of the pandemic. The focus was on the knowledge, perceptions, and experience of ordinary citizens, including compliance with lockdown measures (e.g. mask wearing and personal movement), support for leadership and state interventions (e.g. support for the president, support for school closures and attitudes to limitations to personal freedoms), and lockdown experiences (e.g. emotions experienced, and levels of concern about impact on personal finances). Twenty biographical and geographical identifiers were included for analytical disaggregation.
The instrument was placed on an online platform, accessed via a smartphone messaging application, and using a reverse billing (or ‘datafree’) model, so that users of the Moya Messenger app incurred no cost in accessing the questions or submitting responses. The number of active users of the app increased from 1,7 million to 6,1 million during the course of the survey (Runciman et al., Citation2022). Respondents were given the choice of answering questions in English, isiZulu, Afrikaans, Sesotho, Setswana or isiXhosa. In addition, the app-based survey was augmented by an online link to a purely web-based survey, advertised on social media (primarily Facebook) using their targeted advertising function, whereby certain age and race demographics can be targeted. This combination of platforms facilitated the collection of a repeated (non-panel) non-probability sample of 38,785 completed responses using river sampling (Lehdonvirta et al., Citation2021, Runciman et al., Citation2022, 8).
As an alternative to face-to-face interviews, online survey instruments are advantageous in their independence from in-person enumerators. Respondents can answer at their own pace and in privacy, factors that appear to increase the measure of personal information respondents reveal about themselves (Moon, Citation2000). Moreover, online surveys can be presented in the languages preferred by respondents and can be programmed with skip patterns that avoid irrelevant questions. Despite claims that online surveys generally offer better data quality and sample representation (Andrews et al., Citation2003), and that they are cheaper and quicker than traditional methods (Regmi et al., Citation2016), online surveys also tend to elicit responses from younger and wealthier respondents – more specifically, those with smartphones, internet connections, possibly more likely to be aware of the pandemic, and a willingness to share their data online.
From across the nine provinces, there was a higher concentration of responses from the eight metropolitan areas, particularly those located in the provinces of Gauteng (Johannesburg, Tshwane, and Ekurhuleni metros), KwaZulu-Natal (eThekwini metro) and the Western Cape (Cape Town metro) than from rural areas. shows that whereas 25,8% of the national population lives in Gauteng, more than two-fifths (41,9%) of the survey responses originated in Gauteng. There were fewer responses from the other provinces with metropolitan municipalities, namely the Eastern Cape (which includes Nelson Mandela Bay and Buffalo City metros) and the Free State (which includes Mangaung metro). The other four provinces (Limpopo, Mpumalanga, Northern Cape, North West), yielded even fewer responses, reflective of the distribution of subscribers to the #datafree app.
Table 1. Distribution of population and of survey responses.
The uneven spread (as revealed in ) of the responses meant that the data would not be provincially representative, unless weighted. In this paper, we depict unweighted responses at the municipal level to indicate sentiments such as having ‘difficulty covering my expenses’, for the purpose of showing indicative trends and high-level comparisons. Thus, no statistical significance should be attached thereto. However, the is, generally, not a very large difference between the unweighted and weighted data (Runciman Citation2020), possibly supported by the outcomes of the targeted advertising campaign. Trading representation for transparency instead, we report unweighted findings only.
Different survey methods tend to present different medium-specific biases. Online surveys are wont to include biases related to age, levels of education, socio-economic status, and general attitudes towards technology. Levels of survey experience, personal technical proficiencies, and internet reach among the target population are also likely to play a role. Furthermore, the national smartphone reach was estimated at 82% in 2018 (ICASA, Citation2020), but with perhaps only three-fifths of those going online (Silver & Johnson, Citation2018). Additionally, there is a skew in smartphone usage between those in the 18 to 29-years age category (63%) and their 50+ year-old counterparts (27%), and between those with at least a secondary education (75%) and those who have not completed high school (34%). Moreover, the phenomenon of ‘interest bias’, where self-enrolled respondents are more likely to be (strongly positively or negatively) opined vis-a-vis the survey topic are ostensibly more likely to participate than those disinterested in the survey matter or outcome, all other factors being equal (Kennedy et al., Citation2016), is a notable caveat, too.
Data analysis was done in Microsoft Excel, SPSS and Python, while QGIS was utilized to build visualizations.
Results
While the two matters – often depicted as lives and livelihoods – defy direct comparison, the data suggest the possibility that the pandemic-lockdown nexus resulted in greater socio-economic and psychological distress than the epidemiological impact. We present evidence from responses to the survey questions about individual experiences of hunger, fear and concern about covering household expenses. One stark measure of personal distress is hunger, represented by responses to the question ‘thinking about the last week, have you gone to bed feeling hungry?’ reveals that in Round 1 of our survey, 31% of respondents reported going to bed hungry at least once in ‘the past week’. An ostensible base figure for personal hunger is supplied by StatsSA’s food insecurity reporting, according to which 21,3% of South African households had inadequate or severely inadequate access to food in 2017 (StatsSA, Citation2019). More than 60% of these households were resident in urban areas. Thus, in excess of half a million (611 000) households with children aged five years or younger had experienced hunger, indicative of precarious levels of food security even before the pandemic.
Table 2. Percentage experience of different forms of socio-economic stress.
Notably, an online convenience sample survey conducted by StatsSA (Citation2020c) during the second month of the lockdown (April to May 2020) found that the experience of hunger increased from only 4,3% to 7,0%. The StatsSA report admits that these numbers are lower than those in their previous surveys and are attributable to the sample bias towards respondents with access to the internet. Higher levels were measured by the UJ-HSRC survey during subsequent months of the lockdown: from July to September 2020 (Round 2), the proportion that experienced hunger rose to 35%. In Round 3, over the 2020/21 New Year period, during a nationwide low ebb of infections when lockdown restrictions had been eased, there was a marginal decline, to 33% of respondents. By June-July 2021, the proportion had increased again to 37%. This metric communicates real anxiety over personal well-being, and in some cases, survival. Using the same dataset, Hart et al. (Citation2022) concluded that the pandemic highlighted the inequalities in the South African food system, especially the inability of the state to facilitate rapid and inclusive emergency food relief.
The distribution of incidence of hunger is depicted in using unweighted pooled data from all rounds of the survey. The variance among provinces was small, from 31% to 37%, indicative of the widespread occurrence of the phenomenon but, permitting a head-to-head comparison, the direct impact of hunger exceeded the reported incidence of COVID-19 infection. Hunger was highest in KwaZulu-Natal (37,2%), followed by the Western Cape (34,5%), and then Gauteng (34,2%), provinces in which the major metropoles are located, with North West at 34,1%. Levels of hunger in the other five provinces, mainly rural and economically less secure, were reported as slightly lower, with the lowest occurring in the Eastern Cape (30,9%), the country’s poorest province. It is possible that the incidence of hunger in these provinces was less of a shock than in the economic hubs of the country.
Figure 3. Provincial distribution of (a) hunger and (b) fear, using unweighted data (R1,2,3).
Nevertheless, from a policy perspective, the UJ-HSRC survey determined that most respondents consistently held the view that President Ramaphosa was doing a ‘very good job’ or a ‘good job’ in handling the pandemic. The President made regular evening appearances on national television to motivate and explain the decisions of the government, persuading most South Africans that the stringent lockdown measures were being imposed in the best interests of the country.
Along with hunger, self-reported fear was also assessed as a measure of distress. depicts the extent of the spread of being fearful. Although the reported experiences of fear (along with other negative emotions) do not follow the same pattern as hunger, they are still highest in the economic hubs: KwaZulu-Natal (42,7%), Western Cape (40,2%) and Gauteng (38,8%), and patently higher than the least fearful province (Free State, at 30,9%). In terms of the temporal changes of these emotions during the study period, a greater proportion of respondents indicated being fearful (44%) at the start of the pandemic and lockdown, a figure which gradually waned over time, ultimately decreasing to 31% in June 2020. A further indicator determined in the survey was self-reported experience of stress. This was the highest, by a considerable margin, in the Western Cape (57,3%), Eastern Cape (52,3%) and Gauteng (49,5%). Stress was reported by 45% or less in each of the other six provinces.
However, again, the impact of fear and stress was far wider than the (official) 4,6% incidence of COVID-19 infection by that date. These data suggest that South Africans were, at the onset of the pandemic, genuinely distraught about what a global pandemic and a national lockdown entailed. On the one hand, this included fears of getting infected or dying, or seeing a loved one suffering (and being unable to help), and on the other, financial ruin. The data suggest that, over time, the shock may have worn off, and that people adjusted to or reconsidered the potential dangers.
Next, studying changes in levels of employment presents a complex picture, but a picture direr than reported elsewhere. We note, among other controversies, the disconnect between the National Income Dynamics Study – Coronavirus Rapid Mobile Survey (NIDS-CRAM) results showing a 1 percentage point decline in employment between the first and fourth quarters of 2020, and those of the SA Quarterly Labour Force Survey, showing 9%, with NIDS-CRAM admitting measurement errors (Bassier et al., Citation2021). Meanwhile, while cautious not to encroach on NIDS-CRAM’s field of economic analysis, the UJ-HSRC survey itself nevertheless suffered challenges of its own. Owing to evolving needs, the UJ-HSRC’s methodology adjusted over time, with the instrument’s questions regarding employment phrased differently over successive rounds, necessitating caution with comparisons over successive rounds. reveals that in Round 1, 3% of respondents reported either being laid off (permanently or temporarily) or receiving only a portion of their salary, while another 5% said that at the time of the survey, they were forced to take leave. It should also be noted that 35% of respondents reported being unemployed before the lockdown (according to Stats SA data, 23,3% of the working-age population was unemployed in March 2020). In Round 2, responding to a modified question (see phrasing in ), 16% now reported losing their jobs during the lockdown (and that they had been unable to find work since then), with another 11% saying that they were in the same job, but under new conditions. The implications of the last clause will be revisited. The survey did not ask a question similar to ‘have you been laid off’ in Rounds 3 and 4. However, in Round 4 (June-July 2021), an alarming 46% of respondents were unemployed. This finding was corroborated by the Quarterly Labour Force Survey (StatsSA, Citation2021), where 34,3% of the labour force were unemployed, and an additional 14,6% of those in the working ages were regarded as ‘discouraged job seekers’, and excluded from the labour force.
Finally, the measure that throws the above three dimensions into relief is what we might call ‘relative financial distress’. In all four rounds of the survey, respondents were asked to what extent they agreed with the following statement: ‘due to my financial situation, I have difficulty covering my expenses’. Thus, the aim was to understand not whether South Africans were employed, but whether they felt they were able to make ends meet at the household level. We note that in each round of the survey, the proportion of respondents in financial trouble increased (from 78% to 81% to 84% to 86%). The StatsSA (Citation2020c) study found that losses of income were the main cause of increased personal and family hunger, with 25,8% of respondents reporting a decrease in their income during the first two waves of the pandemic. In addition, during this period, approximately 75% of the respondents reported that they had reduced their spending on food, with 51% reporting using their personal or family savings to close the gap. This last measure implies a clear increase in financial pressures. Companies under financial pressure to offset the loss of income during the lockdowns (and in many cases close to insolvency) might have shifted some of the pressure to ordinary workers – perhaps via longer shifts, increased hours, an increase in automatic deductions, or reduced wages (possibly with shorter hours). Given the marked increase in household precarity and unemployment, it is not unreasonable to conclude that workers had little choice but to accept whatever new conditions their employers presented to preserve their jobs. Other analytical approaches confirm the associations between socioeconomic variables and the experience of financial distress. A binary logistic regression (), with the variable relating to responses to ‘due to my financial situation, I have difficulty making ends meet’ (transformed from a Likert scale to a dichotomous ‘yes’/”no” format), returns a highly significant (>0.001) Chi-square value, when using just the dummy variables of race, gender, age, accommodation type and educational status.
Table 3. Binary logistic regression of financial distress with background variablesa.
Analysing the temporal responses to ‘have difficulty covering my expenses’ () from the 20 municipalities from which the largest number of responses were received, reveals that the experience of financial distress was not uniform across the country.
Figure 4. Comparing changes in ‘have difficulty covering my expenses’ in 20 largest loci of respondents.
The general increase was evident, with 14 out of 20 municipalities presenting overall increases in the measure, three staying almost unchanged, and only three decreasing in levels of financial distress in the first three rounds of data collection. Moreover, the decreases are seen in the large metropolitan areas: Johannesburg, Cape Town, Mogale City (a satellite city west of Johannesburg), and Tshwane presenting a ‘level’ profile. Other metros, such as Ekurhuleni, eThekwini and Nelson Mandela Bay present slightly upward trends – increases in financial distress. However, the trend is that, among less urbanized loci throughout the country, there is a sharp increase in financial distress. Thus, while there appeared to be a slight measure of recovery in the economic hubs of Johannesburg and Cape Town, the financial woes of those everywhere else in the country steadily increased. The same analysis, but lumping together all metropolitan areas, on one hand, and the non-metropolitan municipalities, on the other, confirms this finding (staying almost constant at 78% indicating several financial distress over the three rounds in the 8 metros, versus 79% (Round 1), 81% (Round 2), and 86% (Round 3) for non-metros).
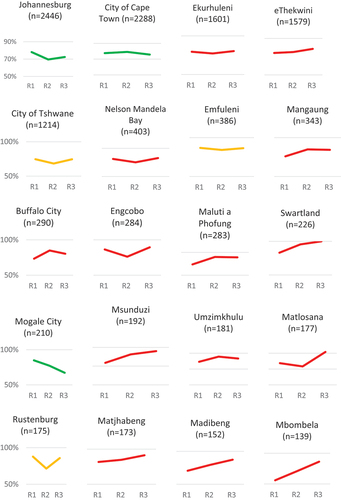
A spatial depiction of financial distress (as approximated by responses of having ‘difficulty covering my expenses’) is presented in , an illustrative snapshot of the unweighted results for the 20 municipalities from which the largest numbers of absolute responses were received. These are suggestive of better reliability and levels of representativity than other parts of the country. In all of the 20, more than 60% of responses indicated having experienced financial difficulty, signalling the widespread economic devastation resulting from the lockdown’s impact on household livelihoods. The proportion of respondents that suffered this form of social distress was less than the national average (85%) in 8 of the 20 (largest) municipalities. Five of these comprised large and densely populated cities situated in or near the country’s economic core, namely Johannesburg, Tshwane, Ekurhuleni, Mogale City, and Rustenburg. This trend is also corroborated by GCRO research (De Kadt et al., Citation2020). Cape Town and Nelson Mandela Bay experienced financial distress of between 70–81%, while a much poorer municipality situated in a ‘deep rural’ region of the Eastern Cape, Engcobo, was better off, and experienced financial distress of 60–70% ().
Figure 5. Proportions that experienced difficulty in covering their expenses, in the 20 municipalities from which the most survey responses (unweighted) were received.
Disaggregated by geotype, the material pressures of making ends meet and of going to bed hungry were commensurably high across metros, towns and rural areas. Despite this, the emotions of stress and fear were higher in towns and metropolitan areas than in rural contexts. Perversely, the relative poverty of the rural margins of the country appears to some extent to have cushioned residents from the shocks experienced in urban areas, where poverty is less pervasive.
Amongst municipalities not in the largest 20 (by respondents), from which fewer responses were received and which are therefore not depicted in , having ‘difficulty covering my expenses’ was the experience of high proportions in two municipalities situated near the major metropoles, namely Midvaal in Gauteng and Bergrivier near Cape Town. Other municipalities most adversely affected included Rustenburg, Ratlou and Greater Taung in North West, Lephalale in Limpopo, Bitou in the Western Cape and Mbizana in the Eastern Cape. Most noticeable were the large number of municipalities in KwaZulu-Natal which reported high levels of distress. Amongst the latter were Umvoti, Ubuhlebezwe, Nqutu, Abaqulusi, Impembe, Umuziwabantu, Dundee, Ulundi and KwaDukuza, in each of which, more than 90% of respondents had experienced financial stress.
Discussion
Not only was socio-economic distress differentially experienced, as evidenced by the divergent pattern among local municipalities, but gradual ‘recovery’ appeared to be proceeding faster in several of the major urban centres, while generally stalling in small town and rural municipalities.
summarizes the comparative provincial impact of COVID-19 epidemiologically and psycho-socially with demographics. Proportionately, by the end of August 2021, the Western Cape had recorded the highest level of confirmed COVID-19 cases (6,92%) and COVID-19-related mortalities (0,26%), but it was Limpopo where the highest proportion (88,6%) had difficulty in covering their expenses, and KwaZulu-Natal where people were most likely to have experienced fear (42,7%) and/or hunger (37,2%). Nonetheless, the disjuncture between the reported incidence of pandemic-related disease and the more economic deprivation-related occurrence of mental health issues was not clear-cut. Despite age-related vulnerability, the wealthier Western Cape is likely to have been cushioned by a much lower-than-average rate of unemployment.
Table 4. Provincial variations - demography, employment, Covid-19, social distress.
Conversely, respondents living in KwaZulu-Natal, with below average rates of reported COVID-19 infection and mortality, and proportionately the lowest (8,1%) in respect of people aged over 60, had above average probability of having had difficulty in covering their expenses (86,3%). For Gauteng, with a population density (834,9 persons km−2) seven times higher than that in KwaZulu-Natal, and by far the largest concentration of economic activity, its status as the economic capital of the sub-continent served both to mitigate the impact and to increase the vulnerability of small businesses dependent on workers travelling to and being at their places of employment rather than working at home. As the primary destination of labour migrants, Gauteng has the second lowest proportion of persons aged over 60 years, making it less vulnerable, demographically speaking. The Eastern Cape had the highest rate of mortality by some margin, amongst confirmed COVID-19 cases, but with relatively lower reported experience of fear and/or hunger. This may be attributable to the ongoing economic marginalization of the province as signalled by the highest unemployment rate (47,1%). As in other poor provinces, the population is likely to have low expectations of the services of the provincial health department facilities. Under-reporting of COVID-19 deaths is prevalent, and access to health care is limited (as asserted by Carmalt and Faubion (Citation2010)). The Eastern Cape in particular was reported to be financially strained to the extent of requesting assistance from the World Health Organization, with more than half of its specialist and medical officer posts vacant (City Press, Citation2021; News24, Citation2021).
As elsewhere, COVID-19 infections tended to be higher in the most densely populated localities, especially where a high proportion of the population was elderly or where local economies were strong and income levels were high. However, the levels of reported hunger, fear and difficulty in covering expenses were higher than COVID-19 infections by a factor of seven or more, and not significantly different between provinces. By such analysis, the social distress impact outweighed the epidemiological impact of COVID-19, signalling the need for reassessment of the appropriateness of a nationwide lockdown as the only policy option to mitigate the spread of infections. The imperative to balance the respective risks both to lives and livelihoods will persist as a policy conundrum until the pandemic is overcome.
The primary implication for policy is to invite the participation of social scientists as early as possible after the onset of any future pandemic or other disaster, to supplement the insights and expertise of the relevant medical, climatological, or other technical specialists. Initially, and perhaps understandably, epidemiological interventions were afforded prominence during the COVID-19 pandemic, owing to the huge global panic about the ease of spread and lethal impact of the virus. The social, economic, and psychological impact of government interventions with respect to minimizing population mobility and interaction was afforded secondary attention as lockdown measures were enforced. Subsequent public clamour about the effects on their livelihoods, the education of their children, and their mental health would have been better anticipated and dealt with, had social science been allowed to contribute from the start. Heavy-handed prohibitions could have been mitigated by nuanced, differential mitigatory regulations that factored in the diverse socio-economic conditions prevalent in a country such as South Africa.
Conclusion
The ongoing debates about the costs and benefits of the public health measures introduced to mitigate the spread of the virus are as significant as they are consequential. Moreover, the challenge of finding appropriate interventions (now and in the future) to a multi-pronged social and epidemiological onslaught is in the national interest. As in other countries, these debates straddle several scientific, but also sociological and political domains. At the same time, the metrics used to guide official discourses are evolving, as better measures to approximate social conditions are developed and debated. Thereby, it is noteworthy that having ‘difficulty covering my expenses’ represents an improvement on other candidate metrics communicating socio-economic distress, stripping away a modicum of the mystification that such figures – principally measures of employment and emotional wellbeing – may bring, often owing to definitional obfuscation (in the case of employment) and confounding factors (in the case of emotional distress). Here, we saw how a simpler, more direct question, appears to have laid bare household fears about covering their basic expenses without compromising scholars’ ability to model the phenomenon.
The socioeconomic distress of South Africans increased during the lockdown, to an extent not captured by statistics before. For instance, levels of distress, approximated by hunger, were highest in provinces with the largest metropolitan areas: KwaZulu-Natal (37,2%), followed by the Western Cape (34,5%), and then Gauteng (34,2%). Notably, levels of hunger in the other non-metropolitan and mainly rural and economically less secure municipalities varied considerably, and were lower in several cases. This may be because the incidence of hunger per se in these provinces was less of a shock to the pandemic than in the economic hubs of the country.
Self-reported fearfulness, another approach to measuring distress, was also highest in the provinces with the largest metropoles, namely KwaZulu-Natal (42,7%), the Western Cape (40,2%) and Gauteng (38,8%%), and significantly higher than was the case in the Free State, where fearfulness was least reported (30,9%). In essence, feelings of fear were dominant in those areas where livelihoods were most affected by the pandemic, presumably caused by uncertainties related to job and income losses reported by larger numbers of respondents in the economic hubs of the country. In terms of the temporal changes of these emotions during the study period, a greater proportion of respondents indicated being fearful (44%) at the start of the pandemic and lockdown, than by June 2020, when the number declined to 31%. This may be a result of the shock factor of the pandemic having decreased and people having adjusted, normalized, and in some cases become complacent about the threat of the pandemic during this period.
In terms of assessing distress levels using ‘I have difficulty covering my expenses’, results from spatiotemporal analysis indicated a trend wherein 14 out of 20 municipalities from which the responses were received, reported increases in the levels of financial distress. Another three of these reported no changes during the survey period, while three reported decreasing levels of financial distress in the first three rounds of data collection. Interestingly, the decreases were in or adjacent to large metropolitan areas: Johannesburg, Mogale City and Cape Town.
Finally, some limitations should be noted in interpreting the results. The number of questionnaire items fluctuated across the four rounds of the survey owing to some changed emphases during the course of the pandemic. Additionally, the uneven spread of the responses meant that the data were not provincially (or municipally) representative. The results can thus only be used to depict trends and high-level comparisons at a spatial level. As such, despite the reassuringly high number of respondents, no statistical significance should be tied to the data at the provincial or sub-provincial level. As explored above, other limitations attending online surveys (Runciman et al., Citation2022) cannot be ruled out, such as lack of access by potential respondents with no devices such as cellphones or tablets, the possibility of self-selection bias, interest bias, disengagement by the respondents, and difficulties in assessing the sentiments behind the responses. However, we take courage from the fact that the results could be significant in providing insight into changing distress levels in the country, which remains valid for the vital work of planning for distress relief. The findings from this study should alert governments to the importance of developing targeted policies to better prepare for health emergencies. Instead of implementing strict, one-size-fits-all prohibitions across the board, the results advocate for more nuanced regulations that account for the diverse socioeconomic circumstances found in countries like South Africa. Lockdowns elicit different responses and have a differential impact on residents of poor informal settlements, either urban or rural, in comparison with those living in urban townships and middle-class suburbs. Our primary policy recommendation is that mitigation efforts tailored to the specific economic and social conditions in diverse communities around the country are essential.
Acknowledgments
The survey data reported in this paper were collected using the Moya Messenger #datafree platform.
Disclosure statement
No potential conflict of interest was reported by the author(s).
References
- Abrahams, Z., Boisits, S., Schneider, M., Prince, M., & Lund, C. (2020). Domestic violence, food insecurity and mental health of pregnant women in the COVID-19 lockdown in cape town, South Africa. Research Square. https://doi.org/10.21203/rs.3.rs-102205/v1
- Andersen, L. M., Harden, S. R., Sugg, M. M., Runkle, J. D., & Lundquist, T. E. (2021). Analyzing the spatial determinants of local COVID-19 transmission in the United States. Science of the Total Environment, 754, 142396. https://doi.org/10.1016/j.scitotenv.2020.142396
- Andrews, D., Nonnecke, B., & Preece, J. (2003). Electronic survey methodology: A case study in reaching hard-to-involve Internet users. International Journal of Human-Computer Interaction, 16(2), 185–210. https://doi.org/10.1207/S15327590IJHC1602_04
- Bassier, I., Budlender, J., & Kerr, A. (2021). https://www.dailymaverick.co.za/article/2021-02-25-why-the-employment-numbers-differ-so-vastly-in-the-quarterly-labour-force-survey-and-nids-cram/
- Cape Town Travel. (2018). https://www.capetown.travel/wp-content/uploads/2018/10/Annual-Report-20172018.pdf
- Carmalt, J. C., & Faubion, T. (2010). Normative approaches to critical health geography. Progress in Human Geography, 34(3), 292–308. https://doi.org/10.1177/0309132509343783
- City Press. (2021). https://www.news24.com/citypress/news/ec-department-of-health-faces-collapse-20210710
- Daniels, R. C., & Casale, D. (2022). The impact of COVID-19 in South Africa during the first year of the crisis: Evidence from the NIDS-CRAM survey. Development Southern Africa, 39(5), 605–622. https://doi.org/10.1080/0376835X.2022.2116408
- Davenport, A., Farquharson, C., Rasul, I., Sibieta, L., & Stoye, G. (2020). The geography of the COVID-19 crisis in England. The Institute for Fiscal Studies. Nuffield Foundation, 1–32.
- De Kadt, J., Gotz, G., Hamann, C., Maree, G., & Parker, A. (2020, March). Mapping vulnerability to COVID-19 in Gauteng. GCRO Map of the Month, Gauteng City-Region Observatory, 2020, 1–9. https://hdl.handle.net/10539/29283
- Duby, Z., Jonas, K., Bunce, B., Bergh, K., Maruping, K., Fowler, C., Reddy, T., Govindasamy, D., & Matthews, C. (2022). Navigating education in the context of COVID-19 lockdowns and school closures: challenges and resilience among adolescent girls and young women in South Africa. Frontiers in Education, Sec Special Educational Needs, 7. https://doi.org/10.3389/feduc.2022.856610
- Espi-Sanchis, G., Leibbrandt, M., & Ranchhod, V. (2022). Age, employment and labour force participation outcomes in COVID-era South Africa. Development Southern Africa, 39(5), 664–688. https://doi.org/10.1080/0376835X.2022.2051439
- Fee.org. (2022). https://fee.org/articles/new-harvard-data-accidentally-reveal-how-lockdowns-crushed-the-working-class-while-leaving-elites-unscathed/?utm_source=pocket_mylist&fbclid=IwAR2qcLOibhU2KRBXMq24T5VM-CLx637x9y6njwuJfvuVw3Swi6tdNof1td4
- Hamann, R., Surmeier, A., Delichte, J., & Drimie, S. (2020). Local networks can help people in distress: South Africa’s COVID-19 response needs them. The Conversation, 14(5), 2020.
- Hart, T. G. B., Davids, Y. D., Rule, S., Tirivanhu, P., & Mtyingizane, S. (2022). The COVID-19 pandemic reveals an unprecedented rise in hunger: The South African government was ill-prepared to meet the challenge. Scientific African, 16, e01169. https://doi.org/10.1016/j.sciaf.2022.e01169
- Hunt, X., Breet, E., Stein, D. J., & Tomlinson, M. (2021). The COVID-19 pandemic, Hunger and depressed mood among South Africans. NIDS-CRAM survey wave 5 working paper 6.
- ICASA. (2020). The state of the ICT sector report in South Africa. https://www.icasa.org.za/uploads/files/State-of-the-ICT-Sector-Report-March-2020.pdf
- Kennedy, C., Mercer, A., Keeter, S., Hatley, N., McGeeney, K., & Gimenez, A. (2016). Evaluating online nonprobability surveys. Pew Research Center. https://www.pewresearch.org/methods/2016/05/02/evaluating-online-nonprobability-surveys/.
- Kim, H. H., Jung, J. H., & Castle, N. G. (2021). Social isolation and psychological distress during the COVID-19 pandemic: a cross-national analysis. The Gerontologist, 61(1), 103–113.–. https://doi.org/10.1093/geront/gnaa168
- Lehdonvirta, V., Oksanen, A., Räsänen, P., & Blank, G. (2021). Social media, web and panel surveys: Using non-probability samples in social and policy research. Policy & Internet, 13(1), 134–155. https://doi.org/10.1002/poi3.238
- Marivate, V. (2021). Data science for social good. GitHub Repository. https://dsfsi.github.io/
- Moon, Y. (2000). Intimate exchanges: Using computers to elicit self-disclosure from consumers. Journal of Consumer Research, 26(4), 323–339. https://doi.org/10.1086/209566
- Naidoo, I., Mabaso, M., Moshabela, M., Sewpaul, R., & Reddy, S. P. (2020). South African health professionals’ state of wellbeing during the emergence of COVID-19. South African Medical Journal, 110(10), 956. https://doi.org/10.7196/SAMJ.2020.v110i10.15250
- National Income Dynamics Survey Wave 5 (NIDS-CRAM). (2020). Retrieved November 13, 2022, from http://www.nids.uct.ac.za/nids-data/data-access
- National Institute for Communicable Diseases (NICD). (2020, March). https://www.nicd.ac.za/first-case-of-COVID-19-coronavirus-reported-in-sa/ 5th
- National Institute for Communicable Diseases (NICD). (2021). Retrieved July 14, 2021, from www.nicd.ac.za
- News24.com. (2021). https://www.news24.com/news24/southafrica/news/COVID-19-who-roped-in-to-assist-as-eastern-capes-death-toll-spikes-20210811
- Padmanabhanunni, A., & Pretorius, T. (2021). The loneliness–life satisfaction relationship: The parallel and serial mediating role of hopelessness, depression and ego-resilience among young adults in South Africa during COVID-19. International Journal of Environmental Research and Public Health, 18(7), 3613. https://doi.org/10.3390/ijerph18073613
- Regmi, P. R., Waithaka, E., Paudyal, A., Simkhada, P., & van Teijlingen, E. (2016). Guide to the design and application of online questionnaire surveys. Nepal Journal of Epidemiology, 6(4), 640–644. https://doi.org/10.3126/nje.v6i4.17258
- Runciman, C., Rule, S., Bekker, M. J., Roberts, B., Orkin, M., Bohler-Muller, N., Bohler-Muller, N., & Alexander, K. (2022). Providing evidence and “Voice” during the COVID-19 pandemic using online rapid response surveys: Lessons from the UJ/HSRC COVID-19 democracy survey. South African Review of Sociology, 53(3/4), 188–208. https://doi.org/10.1080/21528586.2022.2032315
- SA Medical Research Council (SAMRC). (2021). https://www.samrc.ac.za/reports/report-weekly-deaths-south-africa
- Shepherd, D., & Mohohlwane, N. (2022). A generational catastrophe: COVID-19 and children’s access to education and food in South Africa. Development Southern Africa, 39(5), 762–780. https://doi.org/10.1080/0376835X.2021.2017855
- Shifa, M., David, A., & Leibbrandt, M. (2021). Spatial inequality through the prism of a pandemic: COVID-19 in South Africa. Scientific African, 13. https://doi.org/10.1016/j.sciaf.2021.e00949
- Silver, L., & Johnson, C. (2018). Majorities in sub-Saharan Africa own mobile phones, but smartphone adoption is modest. https://www.pewresearch.org/global/2018/10/09/majorities-in-sub-saharan-africa-own-mobile-phones-but-smartphone-adoption-is-modest/
- South Africa. (2020). Blog by Khusela Diko, spokesperson of President Ramaphosa. https://www.gov.za/blog/delicate-balancing-act-save-lives-and-protect-livelihoods
- South Africa. (2021a). https://sacoronavirus.co.za/COVID-19-daily-cases/
- South Africa. (2021b). https://www.gov.za/COVID-19/about/about-alert-system
- South Africa. (2021c). https://www.gov.za/speeches/adjusted-alert-level-2-lockdown-numbers-–-30-may-2021-30-may-2021-0000
- South Africa. (2021d). https://www.gov.za/COVID-19/about/disaster-management-act-regulations-alert-level-4-during-coronavirus-COVID-19-lockdown
- Statistics South Africa. (2019). Towards measuring the extent of food security in South Africa: An examination of hunger and food adequacy.
- Statistics South Africa. (2020a). http://www.statssa.gov.za/publications/Report-03-51-02/Report-03-51-022020.pdf
- Statistics South Africa. (2020b). Mid-year population estimates 2020 P0302. Pretoria: Statistics South Africa. https://www.statssa.gov.za/?p=13453#:~:text=South%20Africa’s%20mid%20year%20population,released%20by%20Statistics%20South%20Africa.
- Statistics South Africa. (2020c). Results from wave 2 survey on the impact of the COVID-19 pandemic on employment and income in South Africa.
- Statistics South Africa. (2021). Quarterly labour force survey P0211. Pretoria: Statistics South Africa. https://www.statssa.gov.za/publications/P0211/P02111stQuarter2021.pdf
- Turok, I., & Visagie, J. (2021). COVID-19 amplifies urban inequalities. South African Journal of Science, 117(3/4), 1–4. https://doi.org/10.17159/sajs.2021/8939
- Wesgro. (2020). https://wesgro.co.za/uploads/files/Western-Cape-Tourism-Performance-2020.pdf
- Wheaton, W. C., & Thompson, A. K. (2020). The Geography of COVID-19 growth in the US: Counties and metropolitan areas. https://mitcre.mit.edu/wp-content/uploads/2020/04/Geography-of-COVID19-Growth-Wheaton.pdf