
Abstract
The Human Impact Land Use Layer (HILL) dataset was developed with visual interpretation of high-resolution satellite imagery. 26,388 2 × 2 km photo plots from the Canadian National Forest Inventory program were examined for any visible evidence of human impact within and outside of the photo plot boundary. The interpreter provided a detailed description of all human impacts and a measure of the total area of all the impacts in the plot. Human impact classes were developed from the interpreter’s plot descriptions. 45.7% of the photo plots have evidence of human impact within, or close to, the plot boundary. The HILL dataset could be used as a validation layer for human impact map products produced using Geographic Information System processes.
RÉSUMÉ
L'ensemble de données Human Impact Land Use Layer (HILL) a été développé avec l‘interprétation visuelle d‘images satellitaires à haute résolution. 26 388 parcelles photographiques de 2 × 2 km provenant du programme d‘inventaire forestier national du Service canadien des forêts ont été examinés pour déceler toute preuve visible d‘impact humain à l‘intérieur et à l‘extérieur des limites de la parcelle photographique. L'interprète a fourni une description détaillée de tous les impacts humains et une mesure de la superficie totale de tous les impacts de la placette. Les classes d‘impact humain ont été élaborées à partir des descriptions de parcelles de l‘interprète. 45,7% des parcelles photographiques ont des preuves d‘impact humain à l‘intérieur ou à proximité des limites de la parcelle. L'ensemble de données HILL pourrait être utilisé comme couche de validation pour les produits cartographiques d‘impact humain générés au moyen de systèmes d‘information géographique.
Introduction
The Human Impact Land Use Layer (HILL) is the result of visual interpretation for the evidence of human activity/impact, using ESRI’s World Imagery Atlas high resolution satellite and aerial photograph imagery, within, and near, Canada’s National Forest Inventory photo plots. The definition of human impact and land use varies from one organization to another. The United Nation’s Food and Agricultural Organization (FAO) defines human impact as “the total of arrangements, activities, and inputs that people undertake in a certain land cover type” (FAO Citation1997, Citation1999). Natural Resources Canada refers to human impact as “the purpose the land serves, for example, recreation, wildlife habitat, or agriculture” (Natural Resources Canada Citation2022). Land Use is the “operations, carried out by humans, with the intention to obtain products and/or benefits through using land resources” (Coffey Citation2013). For this dataset the FAO definition of Primary Forest: “naturally regenerated forests of native tree species, where there are no clearly visible indications of human activities and ecological processes are not significantly disturbed” helped guide the interpreter on the presence or absence of human impacts (Food and Agricultural Organization of the United Nations (FAO) Citation2020a).
Using the ESRI World Imagery Atlas satellite imagery, 26,388 National Forest Inventory (NFI) photo plots (PP) were inspected by an interpreter for human impacts within and near the plot. Each plot was examined for the presence or absence or human impact. No other Geographic Information System (GIS) or image data were used during the interpretation process. The HILL dataset provides a description and total area of all human impacts within, and near, a NFI PP.
The objective of the HILL dataset is to provide a visually vetted dataset that can be used to estimate the magnitude of human impacts on the Canadian landscape. It has been designed to allow for statistical analysis and provide descriptive reports on the type and location of human impacts across various Canadian ecosystems. The HILL dataset can also be used for independent validation of products such as: the Global Terrestrial Human Footprint (Sanderson et al. Citation2002; Venter et al. Citation2016), the Global Human Modification map (Theobald et al. Citation2020), Canada’s Human Footprint (Hirsh-Pearson et al. Citation2021), the Boreal Ecosystem Anthropogenic Disturbance (Environment and Climate Change Canada Citation2012), Canada’s National Deforestation Monitoring System (Dyk Citation2015), Seeing Red, BC's Last Primary Forests (Conservation North Citation2022), Intact Forest Landscapes (Potapov et al. Citation2017; Global Forest Watch (GFW) Citation2021) or for prioritizing ecological restoration of converted lands (Currie et al. Citation2023). These products all have datasets, which are global, national or even regional in extent but contain inaccuracies or missing data that can have implication for conclusions on the location and size of intact areas or the degree of human impact (Poley et al. Citation2022). The HILL dataset can assist in locating areas that contain these inaccuracies or missing data so that better estimates can be derived from these products.
The HILL dataset can also have inaccuracies due the interpreter’s experience, image quality, resolution, complexity of the land cover, season of the image capture, minimum mapping units and attribute definitions (Magnussen and Russo Citation2012). The National Forest Inventory photo and ground plot datasets will be used as ground truth to assess the HILL dataset for accuracy of detecting human impacts. This analysis will be presented in an upcoming publication.
This paper discusses; the data used to produce the HILL dataset, the interpretation methodology, and issues encountered during the interpretation process. Results will be presented that show the extent of human impacts in Canada’s 15 ecozones. This is followed by a brief discussion of the objective of the HILL dataset and its potential use in other research related to human impacts on the Canadian landscape.
Data
Two datasets utilized in this project were the boundary files for the NFI PP and ESRI’s World Imagery dataset.
National Forest Inventory (NFI) data
Canada’s National Forest Inventory is a collaborative effort between the federal, provincial, and territorial governments of Canada. The NFI; compiles detailed information for each of Canada’s forested ecozones, collects data to a common standard for photo and ground plots across Canada, maintains a national database, and leads data analysis and reporting. Reports from the NFI datasets are used to support research activities and to generate national and international reports.
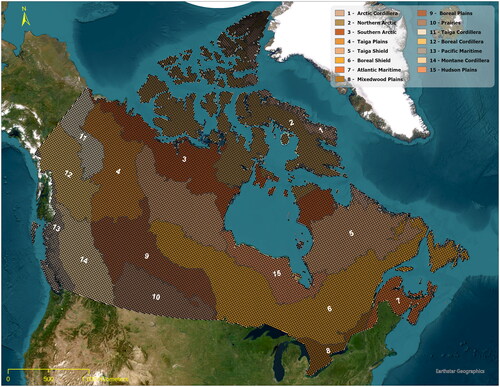
The NFI PP consists of 2 km × 2 km plots spaced on a grid 20 km apart across all of Canada. The total number of photo plots is 26,388. The spatial extent of these plots is shown in . The NFI PPs represent a 1% sample of Canada’s land base. The NFI design ensures that each ecozone is adequately sampled for statistical reliability (Gillis et al. Citation2005). Further information on the sample design of the NFI can be found in the documents, “Canada’s National Forest Inventory Business Process” (National Forest Inventory Citation2023) and in “Monitoring Canada’s forests: The National Forest Inventory” (Gillis et al. Citation2005).
Figure 1. National Forest Inventory Photo Plots for Canada.
ESRI World Imagery
ESRI World Imagery provides one meter or better satellite and aerial imagery for Canada and the rest of the world. Data sources include, 15-meter TerraColor imagery at small and mid-scales, Maxar imagery at 0.3-meter resolution for select metropolitan areas and 0.6–1.2-meter resolution imagery in other areas, Provincial and Municipal governments have also contributed high-resolution aerial photography. This imagery ranges from 0.3-meter to 0.03-meter resolution (ESRI 2020). The imagery is available as a base map layer through the ESRI map server; https://services.arcgisonline.com/ArcGIS/rest/services/World_Imagery/MapServer
ESRI World Imagery Dates layer file was used to extract imagery for the interpretation data table. The ESRI World Imagery updates several times a year as newer imagery is added to the database. The World Imagery Dates can be added as a layer by linking to the map server: https://services.arcgisonline.com/ArcGIS/rest/services/World_Imagery/MapServer/0
Methodology
The HILL data set involved three phases of interpretation. The interpretation process began in June 2021 and was completed in August 2022. 315 days, 7.5 hours in duration, were required to load, interpret, and complete data entry for the 26,388 PPs. Each NFI PP was examined by the interpreter; first, to capture the presence or absence of human impact, next to attribute the impact and measure the combined area of all impacts within the PP, and then to search for and attribute human impact outside of the PP boundary. The time to complete the interpretation process varied by plot due to the complexity of the impact. The average time of interpretation and attribution for a PP was 5.4 minutes.
Workflow
Assess NFI PPs for human impact.
Presence of Human Impact within the PP ().
Capture the acquisition date, resolution, and name of the satellite.
Attribute impact in NFI PPs.
Description of the types of human impacts.
Measure the total area of the human impact within the plot.
Categorize Primary and Secondary impacts from Plot description.
Assess human impacts outside of NFI PPs.
Locate human impact outside of the PP boundary.
Measure distance and angle from nearest edge of NFI PP boundary to impact.
Description of human impact.
Table 1. Human impact land use layer data fields.
Using ESRI ArcGIS Pro V2.9, the NFI PP boundaries were displayed with ESRI World Imagery Dates and ESRI World Imagery in the background. The NFI PPs were examined starting with the most Northern PP and progressing southwards. The interpreter would select a PP from the attribute table and zoom to that PP. The scale of the zoomed PP ranged between 1:9,000 and 1:10,000 for the PPs. At these scales, human impacts, such as trails, roads, and buildings are identifiable.
The attribute table for the HILL dataset consists of 18 fields (). The values for OBJECTID, Shape, NFI_PLOT, PROV_TERR, BOREAL, ECOZONE, Shape_length and Shape_Area come from the NFI PP database. The remaining 10 fields require the attributes to be entered by the interpreter.
For each PP, the interpreter recorded the presence or absence of human impact, Image Source Date, Source Resolution, and Source Description (). A PP can contain two or more images from different satellites, and which were acquired at different dates. Where more than one image date was within the PP, the earliest date information containing a human impact was recorded. Where no human impact was detected within the PP, the Image Source Date, Source Resolution, and Source Description information for the PP was also recorded. This information will provide a baseline date should the PP be revisited in the future for any changes.
Once the initial phase of interpretation and attribution was complete, the PPs were revisited to attribute the Total Area and Plot Description fields. During the revisit of the PPs, the imagery is rescaled to a 1:2,000 or 1:1,000 scale so that the human impact detected could be better described. When more than 2 types of human impact are within a PP, the Plot Description describes the impacts in the order of dominance. The order of dominance is based on the impact’s area. For example, a forest harvest block could cover a larger area than a seismic line and so the forest harvest block would be the Primary (HI_1) impact and the seismic line would be the Secondary (HI_2) impact.
The Primary and Secondary impacts, or classes, are derived from the Plot Description and not from a predetermined classification system, such as the Boreal Ecosystem Anthropogenic Disturbance (Pasher et al. Citation2013). From the Plot Description, impacts were grouped into broad categories for ease of use in a Geographic Information System search or summary query. Impacts described as “cropland” or “pastureland” are grouped into the more general term “Agriculture,” whereas impacts like roads and trails, are not grouped. “Power” refers to electricity generated from hydroelectric dams but can also include electricity generated from other facilities such as solar and wind farms. “Power” also encompasses the infrastructure used to transport the electricity to the end user. Seismic lines (Dabros et al. Citation2018; Van Dongen et al. Citation2022), well pads and pipelines are grouped into “Oil/Gas”. shows the interpretated classes along with their plot description and interpreter notes. Image examples of the Plot Descriptions can be found on the National Forest Inventory website under Data Request (https://nfi.nfis.org/en/datarequest).
Table 2. Classes derived from interpreter plot descriptions.
Total Area is determined by the area within the plot affected by all human impacts. For example, forestry has subtypes of impact (harvest clear cuts, roads, landings, skid trails) that are unique but collectively can cover the whole plot. Other plots may have just one impact, like a seismic line, and so the boundary of the impact within the plot is measured. The HILL dataset is not a mapping product, so the area polygons were not retained. Digitization of the different impacts may be captured in a future version of the dataset.
During the first and second rounds of interpretation, it was noticed that there were human impacts outside of the boundaries of the NFI PPs. It was decided to add a second class (HI = 2) of human impact to the HILL dataset. This class is for human impacts that occur outside of the NFI PP boundaries but within a 10 km distance of the boundary. While not part of the current NFI photo plot sampling design, human impact outside of the PP could be of interest when estimating the extent of human impact on the Canadian landscape. Only plots that showed no human impacts within the plot, were examined for activity outside of the plot. Only the nearest human impact was measured for its distance (NEAR_DIST) and angle (NEAR_ANG) from the closest edge of the PP boundary. Only the Primary impact (HI_1) is recorded and a brief description provided.
Data issues
ESRI World Imagery Dates
The “Label” option for a layer was used to display the ESRI World Imagery Dates for the source imagery. The label reads the attributes: DATE (YYYYMMDD), RESOLUTION and SOURCE from the map layer. Shortly after starting to attribute the human Impact layer with the data information, the interpreter saw that the DATE (YYYYMMDD) did not correspond with the imagery presented (). In this example for PP #21096, the DATE (YYYYMMDD) = 20180308, but the SRC_DATE2 = 03-Aug-2018. This plot is located near Alert, NWT. The phenology and shadowing present in the image did match with the date of the image (March 8, 2018). At this time of year, the shadows would be long, and the surface snow covered. A check of the weather from Environment Canada’s historical weather records for the weather station at Alert showed that on 20180308 there was active snow fall. (https://climate.weather.gc.ca/historical_data/search_historic_data_stations_e.html). The image should have been cloud covered or have snow on the ground. The weather record for 03-Aug-2018 shows the weather was clear with no active precipitation. This corresponds to the image for the PP (). The label for the image data was updated to reflect the SRC_DATE2 date.
Figure 2. Example of ESRI World Imagery Date mismatch with ESRI World Imagery.
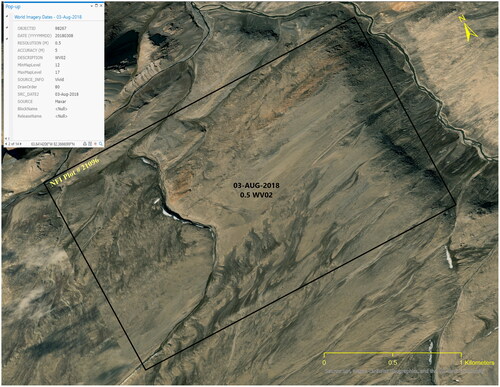
The date discrepancy between DATE(YYYYMMDD) and SRC_DATE2, occurs because the Day and Month values are sometimes reversed. This occurs most often for Day and Month with values ranging from 1 to 12. If the dates were extracted with a GIS query, using the DATE(YYYYMMDD) field, the resulting image date would be incorrect for some PPs. Interpreters will have to manually confirm the imagery corresponds to the expected phenology of the image’s date.
ESRI World Imagery
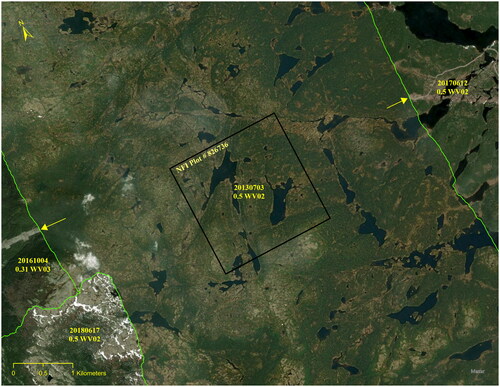
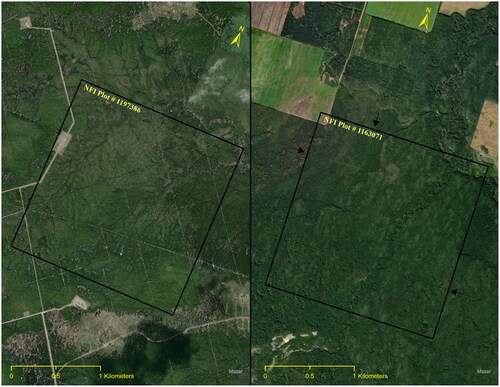
The ESRI World Imagery dataset is updated periodically depending on the resolution of the imagery (https://www.esri.com/about/newsroom/arcuser/a-world-of-imagery-available-through-arcgis-online/). For this project, 2 updates occurred between June 2021 and August 2022. The variability of the temporal acquisition meant that the recording of the Source Date of the imagery was important as changes in the landscape could occur based on the update of the imagery. shows where a PP (#826736) shows no human impact within the plot, but the updated imagery to the west (04-Oct-2016) and east (17-Jun-2017) of the plot show construction of a hydro corridor which may run through the plot. Until the image dataset is updated, this PP will be classed as having human impact outside of the plot but within 10 km (HI = 2).
Figure 3. Human Impact missed due to old imagery.
Total area
Using the area measure tool in ESRI ArcGIS Pro 2.9., the Total_Area of human impact was calculated. For impacts, such as forest harvest, the boundary is outlined, and the area calculated for both harvest events (). For seismic lines, the Alberta Government’s Provincial Woodland Caribou Range Plan was referenced (Alberta Government Citation2017). If all the seismic lines in a PP are less than 500 meters apart, the whole PP is considered impacted. In , the dense pattern of seismic lines would be interpreted that the whole of the PP is impacted, and the Total Area would be the size of the PP (400 hectares). In , the seismic lines are not within 500 meters of another seismic line and the Total Area would be measured by digitizing the length and width of the seismic line.
Figure 4. Area measurement of Human Impacts.
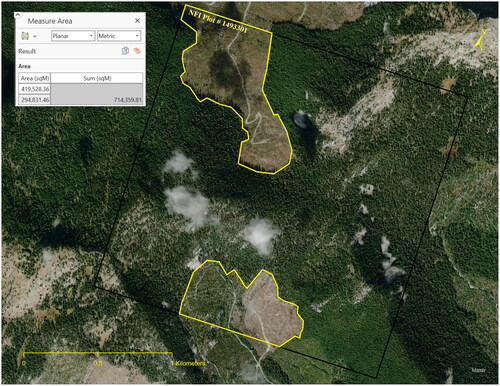
Figure 5. Seismic Lines: Left, Seismic line within 500 meters of each other, Right, Seismic lines greater than 500 m apart.
Results
NFI plot count by ecozone
The HILL dataset can be used to compile a summary of the percent of human impact on the Canadian landscape. shows the NFI plots with human impact within the plot boundary. shows the NFI plot count by ecozone. Of the 26,388 NFI PPs, 103 were obscured by cloud so no visual interpretation was possible, 7,968 had impacts within the plot, 4,101 had no impacts within the plot but did have a human impact within 10 km of the plot boundary, and 14,216 had no impacts within the plot or within 10 km of the plot boundary. 30.2% of all the NFI PPs have been impacted by human activity. 15.5% of the NFI PPs have no human impacts within the plots but do have human impacts within 10 km of the PP’s boundary. 53.9% of the plots have no human impacts within the plot, or within 10 km of the plot boundary.
Figure 6. Human Impacts within NFI Photo Plots.
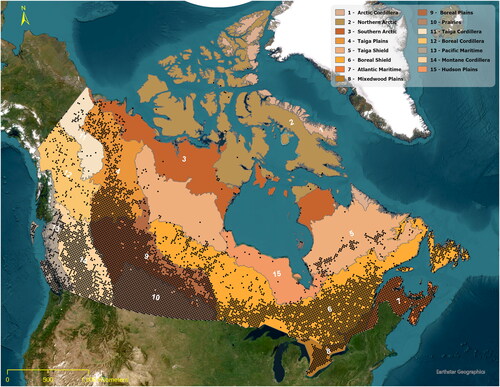
Table 3. NFI photo plot count by ecozone.
When analyzing , plots with “No Impact” and “Outside” should be combined as the “Outside” plots do not have any human impact within the plot. A correct summary of the percentage of PPs with no human impact would be “No Impact” plus “Outside” (53.9% + 15.5% = 69.4%). 69.4% of the NFI PPs have no evidence of human impact within the plot and 30.2% of the NFI PPs contain evidence of human impact within the plot.
The three ecozones with the most human impact within the NFI PP are the Prairies (99.6%), the Atlantic Maritime (95.8%), and the Boreal Plains (79.8%).
NFI plot area by ecozone
The HILL dataset can be used to compile a statistical summary of the area of human impact on the Canadian landscape. For each NFI plot, the total area of all human impacts within the plot are measured. In , the area of “no impact” is calculated by multiplying the count of NFI plots in (No Impact, Outside, Clouds) by 400 hectares. The area of “impact” is the sum of TOTAL_AREA of human impacts for all PPs. The total area of all the NFI plots is 10,555,200 hectares. 1,772,126 hectares, or 16.8% of the total area, is affected by human impact. The ecozones with the greatest area of impact area of impact are the Prairies, Atlantic Maritime, Mixedwood Plains, and the Boreal Plains. The ecozones with the least area of impact are the Arctic Cordillera, Northern Arctic, and the Southern Arctic.
Table 4. Total area of impact within NFI photo plots.
shows the both the Total Area of human impacts and their percentage of the total area covered by the impacts. The largest human impacts are Agriculture and Forestry. These impacts account for 82.6% of total area of human impacts in the HILL dataset. also shows which human impacts are dominant in each ecozone. The largest human impact in the Prairies and Mixedwood Plains is Agriculture. The Boreal Shield, Atlantic Maritime, Pacific Maritime, and Montane Cordillera are most impacted by Forestry. The Taiga Shield and Hudson Plains are dominated by Reservoir impacts. The Taiga Plains and the Taiga Cordillera are dominated by Oil/Gas impacts. While the southern ecozones show most impacts are resource extraction related, impacts in the northern ecozones (Arctic Cordillera, Northern Arctic and Southern Arctic are dominated by Settlement and transportation networks (Road, Trail).
Table 5. Area of human impact sorted by primary impact.
Distribution of human impact
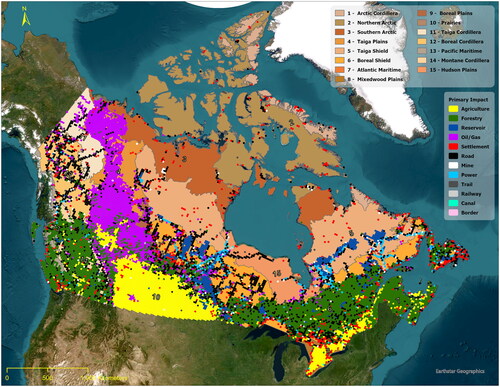
The HILL dataset can also be used to help describe the distribution of human impact on the Canadian landscape. The impact within a plot (human impact = 1) can provide a statistical estimate of the total area of human impact on the Canadian landscape. By including the impact outside of the PP (human impact = 2) with the impact within a PP, a map showing the distribution of impact can be produced (). When is compared with , ecozones like the Boreal Shield, Boreal Cordillera, Taiga Cordillera, and the Taiga Plains show more human impact than when only human impact within the PP is considered. shows the distribution of all human impacts based on the Primary impact for a PP.
Figure 7. Human Impacts within NFI Photo Plots and within 10 km of NFI Photo Plots.
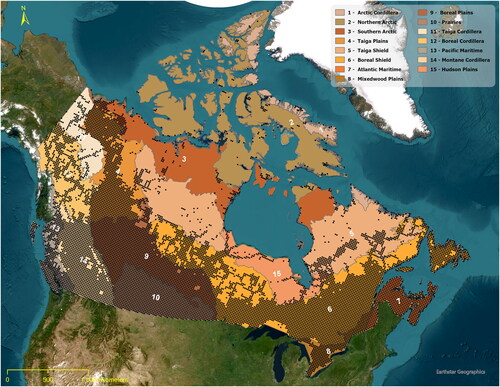
Figure 8. Human Impacts by Primary Classification. Includes impact within and outside of the Photo Plot Boundary.
shows the total count of PPs with no human impact, human impact within a PP and human impact outside of the PP boundary, in 1 kilometer, increments. The “No Impact” column includes PPs with no human impact within the PP and no human impacts within 10 km of the PP boundary. 53.9% of all the PPs had no human impact within the plot or within 10 km of the PPP boundary, 30.2% had human impact within the PP and a total of 15.9% had no human impact within the PP but did have human impact within 10 km of the PP boundary. The ecozone with the highest human impact is the Prairies with 99.6% of the PPs having human impact within the plot.
Table 6. Distance to human impact.
shows that 100% of the PPs in the Prairies and Atlantic Maritime ecozones contain or are within 10 km of a human impact. Other ecozones with more than 90% of the PPs with human impact within the PP, or within 10 km of a human impact, are the Boreal Plains and the Montane Cordillera. 8 of the 15 ecozones have more than 60% of the PPs with human impact within the PP or within 10 km of the PP boundary. 45.7% of NFI PPs have human impact within or within 10 km of their boundary. The most northern ecozones, the Arctic Cordillera, Northern Arctic, have the least amount of human impact with only 3.9% and 3.6% of the NFI PPs with human impact within the PP or within 10 km of the PP boundary.
Conclusion
26,388 National Forest Inventory (NFI) photo plots (PP) were visually interpreted for human impacts. Each plot was examined using the United Nations Food and Agriculture Organization (FAO) definition of Primary Forest: “naturally regenerated forests of native tree species, where there are no clearly visible indications of human activities and ecological processes are not significantly disturbed” (Food and Agricultural Organization of the United Nations (FAO) 2020). Classes of human impact were developed from the interpreter’s description of the human activities within the NFI PP. The study used only the NFI PP plot boundaries and the ESRI World Imagery Atlas, no other GIS or remotely sensed data was used in evaluating human impact.
NFI PPs are a 1% sample of Canada’s land base. Total area of all NFI PPs is 10,555, 200 hectares. NFI PPs with human impact inside of the plot boundary account for 30.2% of the 26,388 plots but only 16.8% of the NFI PPs Total Area. 45.7% NFI PPs are within 10 km of a human impact. The most impacted ecozones in Canada are the Prairies and Atlantic Maritime with 100% of the NFI PPs having human impacts within or within 10 km of the PP boundary. The least impacted ecozones are the Northern Arctic and Arctic Cordillera with 3.9% and 4.0% of the NFI PPs having human impacts within or within 10 km of the PP boundary.
The objective of the HILL dataset is to provide a visually vetted dataset that can be used to estimate the magnitude of human impacts on the Canadian landscape. It has been designed to allow for statistical analysis and provide descriptive reports on the type and location of human impacts across various Canadian ecosystems. The HILL dataset can also be used for independent validation of products such as: the Global Terrestrial Human Footprint (Sanderson et al. Citation2002; Venter et al. Citation2016), the Global Human Modification map (Theobald et al. Citation2020), Canada’s Human Footprint (Hirsh-Pearson et al. Citation2021), the Boreal Ecosystem Anthropogenic Disturbance (Environment and Climate Change Canada Citation2012), Canada’s National Deforestation Monitoring System (Dyk 2015), Seeing Red: BC's Last Primary Forests (Conservation North Citation2022), Intact Forest Landscapes (Potapov et al. Citation2017; Global Forest Watch (GFW) Citation2021) or prioritizing ecological restoration of converted lands (Currie et al. Citation2023). A future version of the HILL dataset is planned that will include polygon and point data for the human impact classes.
The HILL dataset is available, via a request form, from Canada’s National Forest Inventory. The data request form can be found under the tab “Data & Tools” on the NFI website (Canada’s National Forest Inventory).
Acknowledgements
The author would like to acknowledge the support of the following colleagues: Graham Stinson, Byron Smiley, Russell Thorsteinsson, Andrew Dyk, Paul Boudewyn, and Kangakola Omendja.
Disclosure statement
No potential conflict of interest was reported by the author(s).
Data availability statement
The HILL dataset can be obtained from the National Forest Inventory upon completion of a data request form. This form can be found under the tab “Data & Tools” @ https://nfi.nfis.org
Additional information
Funding
References
- Alberta Government. 2017. “Draft provincial woodland caribou range plan.” Available from: https://open.alberta.ca/dataset/932d6c22-a32a-4b4e-a3f5-cb2703c53280/resource/3fc3f63a-0924-44d0-b178-82da34db1f37/download/draft-caribourangeplanandappendices-dec2017.pdf
- Canada’s National Forest Inventory. “Canada’ National Forest Inventory, Monitoring the extent, stat, and sustainable development of Canada’s forest.” Available from: https://nfi.nfis.org/en/faq#sidebarCollapseBrochure.
- Canada’s National Forest Inventory. “National Forest Inventory photo plot data dictionary for first remeasurement.” Available from: https://nfi.nfis.org/resources/photoplot/Pp_data_dictionary_5.2.pdf
- Canada’s National Forest Inventory. “National Forest Inventory data request.” Available from: https://nfi.nfis.org/en/datarequest
- Coffey, R. 2013. “The difference between “land use” and land cover.” Available from: https://www.canr.msu.edu/news/the_difference_between_land_use_and_land_cover
- Conservation North. 2022. “Seeing red: BC's last primary forests.” Available from: https://conservationnorth.org/
- Currie, J., Merritt, W., Liang, C., Sothe, C., Beatty, C.R., Shackelford, N., Hirsh-Pearson, K., Gonsamo, A., and Snider, J. 2023. “Prioritizing ecological restoration of converted lands in Canada by spatially integrating organic carbon storage and biodiversity benefits.” Conservation Science and Practice, Vol. 5 (No. 6): 16pp. doi:10.1111/csp2.12924.
- Dabros, A., Pyper, M., and Castilla, G. 2018. “Seismic lines in the boreal and arctic ecosystems of North America: environmental impacts, challenges, and opportunities.” Environmental Reviews, Vol. 26(No. 2): pp. 214–229. doi:10.1139/er-2017-0080.
- Dyk, A., Leckie, D., Tinis, S., and Ortlepp, S. 2015. Canada’s National Deforestation Monitoring System: System Description. Victoria, British Columbia: Natural Resources Canada, Canadian Forest Service, Pacific Forestry Centre. Information report BC-X-439. 30 pp.
- Environment and Climate Change Canada. 2012. “Boreal ecosystem anthropogenic disturbance vector data for Canada based on 2008 to 2010 Landsat imagery.” Available from: https://open.canada.ca/data/en/dataset/afd0ce47-17c3-445c-b823-2f86409da2e0
- Food and Agricultural Organization of the United Nations (FAO). 1997. State of the world’s forests, Rome, Italy: FAO. 200 pp.
- Food and Agricultural Organization of the United Nations (FAO). 1999. State of the world’s forests, Rome, Italy: FAO. 154 pp.
- Food and Agricultural Organization of the United Nations (FAO). 2020a. Global forest resources assessment 2020: Main report. Rome: FAO. p. 34.
- Food and Agricultural Organization of the United Nations (FAO). 2020b. Global forest resources assessment 2020: Canada report. Rome: FAO. p. 19.
- Gillis, M.D., Omule, A.Y., and Brierley, T. 2005. “Monitoring Canada’s forests: The National Forest Inventory.” The Forestry Chronicle, Vol. 81(No. 2): pp. 214–221. doi:10.5558/tfc81214-2.
- Global Forest Watch (GFW), 2021. “Intact forest landscapes 2021.” Available from: https://data.globalforestwatch.org/documents/gfw::intact-forest-landscapes/about
- Hirsh-Pearson, K., Johnson, C.J., Schuster, R., Wheate, R.D., and Venter, O. 2021. “Canada’s human footprint reveals large intact areas juxtaposed against areas under immense anthropogenic pressure.” FACETS, Vol. 7: pp. 398–419. doi:10.1139/facets-2021-0063.
- National Forest Inventory. 2023. “Canada’s National Forest Inventory Business Process.” Available from: https://nfi.nfis.org/en/documentation
- Natural Resources Canada. 2022.“Land cover and land use.” Available from: https://www.nrcan.gc.ca/maps-tools-and-publications/satellite-imagery-and-air-photos/tutorial-fundamentals-remote-sensing/educational-resources-applications/land-cover-biomass-mapping/land-cover-land-use/9373
- Magnussen, S., and Russo, G. 2012. “Uncertainty in photo-interpreted forest inventory variables and effects on estimates of error in Canada’s National Forest Inventory.” The Forestry Chronicle, Vol. 88(No. 04): pp. 439–447. doi:10.5558/tfc2012-080.
- Pasher, J., Seed, E., and Duffe, J. 2013. “Development of a boreal ecosystem anthropogenic disturbance layers for Canada based on 2008 to 2010 Landsat imagery.” Canadian Journal of Remote Sensing, Vol. 39(No. 1): pp. 42–58. doi:10.5589/m13-007.
- Poley, L.G., Schuster, R., Smith, W., and Ray, J.C. 2022. “Identifying differences in roadless areas in Canada based on global, national and regional road datasets.” Conservation Science and Practice, Vol. 4(No. 4): pp. e12656. doi:10.1111/csp2.12656.
- Potapov, P., Hansen, M. C., Laestadius, L., Turubanova, S., Yaroshenko, A., Thies, C., Smith, W., et al. 2017. “The last frontiers of wilderness: Tracking loss of intact forest landscapes from 2000 to 2013.” Science Advances, Vol. 3: pp. e1600821.
- Sanderson, E.W., Jaiteh, M., Levy, M.A., Redford, K.H., Wannebo, A.V.V., and Woolmer, G. 2002. “The human footprint and the last of the wild: The human footprint is a global map of human influence on the land surface, which suggests that human beings are stewards of nature, whether we like it or not.” BioScience, Vol. 52 (No. 10): pp. 891–904. doi:10.1641/0006-3568(2002)052[0891:THFATL]2.0.CO;2.
- Theobald, D.M., Kennedy, C., Chen, B., Oakleaf, J., Baruch-Mordo, S., and Kiesecker, J. 2020. “Earth transformed: Detailed mapping of global human modification from 1990 to 2017.” Earth System Science Data, Vol. 12 (No. 3): pp. 1953–1972. doi:10.5194/essd-12-1953-2020.
- Van Dongen, A., Jones, C., Doucet, C., Floreani, T., Schoonmaker, A., Harvey, J., and Degenhardt, D. 2022. “Ground validation of seismic line forest regeneration assessments based on visual interpretation of satellite imagery.” Forests, Vol. 13 (No. 7): pp. 1022. doi:10.3390/f13071022.
- Venter, O., Sanderson, E.W., Magrach, A., Allan, J.R., Beher, J., Jones, K.R., Possingham, H.P., et al. 2016. “Global terrestrial Human Footprint maps for 1993 and 2009.” Scientific Data, Vol. 3 (No. 1): pp. 160067. doi:10.1038/sdata.2016.67.