
 ?Mathematical formulae have been encoded as MathML and are displayed in this HTML version using MathJax in order to improve their display. Uncheck the box to turn MathJax off. This feature requires Javascript. Click on a formula to zoom.
ABSTRACT
The use of grazing management strategies can influence canopy structure and the permanence of legumes. The objective of this work was to evaluate the determination of forage canopy heights as a grazing management strategy regarding herbage mass composition and tiller population dynamics in multispecies pastures comprising Megathyrsus maximus cv. Aruana and the legumes Macrotyloma axillare, Calopogonium mucunoides and Stylosanthes spp. Four treatments, defined by canopy heights of 15, 30, 45 and 60 cm, were evaluated in a randomised block design with four replications. The evaluations were performed under continuous stocking with sheep. Taller pastures (45 and 60 cm) contained greater (P < 0.05) total herbage mass of Aruana leaves and stems and also higher mass of legumes than smaller pastures (15 and 30 cm). The grass tiller population density was different between heights (P < 0.05) of 2.71, 2.02, 1.97 and 1.47 tillers/m2 for heights of 15, 30, 45 and 60 cm, respectively. The tiller appearance rate was highest in tall pastures (P < 0.05) and the lowest rate and stability index were found in 15 cm pastures. Aruana guineagrass and forage legumes can be managed in the height range of 30–60 cm under continuous stocking.
GRAPHICAL ABSTRACT
Introduction
Society’s demand for sustainable animal production is growing, and the use of mixed pastures containing grasses and legumes is a viable alternative to meet this demand. These arrangements have many benefits, such as adequate N input with reduced use of nitrogen fertilisers (Boddey et al. Citation2020), improvement in forage nutritional value (Braga et al. Citation2020; Gerdes et al. Citation2020), and in some situations, reduced greenhouse gas emissions (Sánchez-Navarro et al. Citation2020). The management of mixed pastures is challenging, since the cultivation of different species in the same area requires different management strategies (Duchini et al. Citation2018). Thus, it is necessary to define a grazing management that provides optimal conditions for growth and maintenance of grasses and legumes in mixed pastures.
Grazing management strategies based on the use of canopy height ranges as targets in grass-only pastures under continuous stocking generate consistent plant and animal responses, according to changes in forage canopy structure (Da Silva et al. Citation2013; Sbrissia et al. Citation2020; Terra et al. Citation2020). However, for pastures composed of grasses and legumes under continuous stocking, investigations are still scarce. Recent studies in tropical areas have evaluated Marandu palisadegrass (Brachiaria brizantha cv. Marandu) mixed with the legumes Arachis pintoi (Ferreira et al. Citation2022), Stylosanthes guianensis (Braga et al. Citation2020) and Calopogonium mucunoides (Alviarez et al. Citation2020; Depablos et al. Citation2021). Of these studies, only Braga et al. (Citation2020) used the continuous stocking method, despite the indication that grass-legume pastures maintained in continuous stocking are more stable in terms of forage height and mass, and present greater recovery of populations of legumes (Andrade Citation2009). This suggests the need for further experiments in pastures with continuous stocking.
To better define grazing management strategies aimed at greater pasture stability, it is also necessary to understand the dynamics of tiller renewal in the plant community, a continuous process that can be accelerated by plant defoliation and consequent improvement of light penetration at the base of the canopy (Sbrissia et al. Citation2010; Barbosa et al. Citation2021). In this context, pastures that manage to replace the dead tillers by the appearance of new tillers have a higher stability index (Bahmani et al. Citation2003) and lower chances of pasture degradation (Sbrissia et al. Citation2010).
Mixed pastures containing Aruana guineagrass and legumes are an alternative to the large areas of B. brizantha monocropping that is typical in Brazil (Jank et al. Citation2011). Gerdes et al. (Citation2020) evaluated Aruana guineagrass mixed with the legumes Calopo and Macrotyloma and observed their presence of 13.3 and 43.2% in the herbage mass, respectively, indicating that they may be alternatives for mixture with this grass. Macrotyloma and Calopo are plants with a twining growth habit and are well adapted to tropical soils. The use of Macrotyloma is indicated for mixed pastures in tropical areas due to its high nutritional value (Batista et al. Citation2018) and the presence of secondary compounds that can reduce the emission of enteric methane by animals (Lima et al. Citation2018). Calopo adapts well to tropical soils and presents benefits in intercropping in Marandu grass pastures (Alviarez et al. Citation2020; Depablos et al. Citation2021). In addition to these legumes, Stylosantes, which is shrubby, also presents good results in intercropping with Brachiaria grass, generating increased nutritional value and animal weight gain (Braga et al. Citation2020). These three legumes are propagated by seeds and have relevant seed production which can benefit their permanence in the pasture. However, there are no studies of this grass under continuous stocking with forage legumes, and these, when having a twining growth habit, can benefit from a lower frequency of defoliation compared to grasses (Mero and Uden Citation1997).
Our hypothesis was the existence of benefits in the mass and percentage of legumes and pasture stability in grazing management strategies where the frequency of defoliation is reduced, that is, in the highest maintained pastures in relation to that with smaller pasture heights. In this context, our objective was to evaluate the influence of grazing management strategies on herbage mass and its components, on tiller population demography and tillering dynamics of Aruana guineagrass mixed with forage legumes under continuous stocking.
Material and methods
The experiment was carried out at the Instituto de Zootecnia in the municipality of Nova Odessa, state of São Paulo, at the approximate geographic coordinates of 22° 42’ south latitude, 47° 18’ west longitude and 528 m altitude. According to the Köppen classification, the climate in the region is characterised Cwq, meaning humid mesothermal and subtropical, with dry winter, with average temperatures below 18°C in the coldest months and above 22°C in the hottest months. The average annual rainfall in the municipality is 1270 mm, with 30% falling from May to September. The climate data of the experimental period () were collected from the Agrometeorological and Hydrological Portal of the State of São Paulo. These data were used to calculate the water balance of the experimental period (), using the method for water balance proposed by Thornthwaite and Mather (Citation1955).
Figure 1. Monthly meteorological data from the experimental period (January 2021 to March 2022), at the Instituto de Zootecnia in Nova Odessa, state of São Paulo.

Figure 2. Monthly soil-water balance from March 2021 to March 2022, considering a soil water storage capacity of 50 mm.

The soil in the experimental area is classified as Ultisol, with medium clay/sandy texture. Soil samples taken in 2019 showed the following characteristics: pH = 5.4; organic matter = 44 g/dm3; P = 44 mg/dm3; K = 4.5 mmolc/dm³; Ca = 56 mmolc/dm³; Mg = 39 mmolc/dm³; Al = 0 mmolc/dm³; H + Al = 20 mmolc/dm³; cation exchange capacity = 11.95 cmolc/dm³; base saturation = 83%; S = 6 mg/dm³; B = 0.26 mg/dm³; Cu = 1.3 mg/dm³; Fe = 59 mg/dm³; Mn = 13.7 mg/dm³; and Zn = 4.1 mg/dm³. The fertilisation was performed according to the recommendation of Werner et al. (Citation1996).
Establishment of treatments
The experimental area was formed by multispecies pasture of Aruana guineagrass [Megathyrsus maximus (Syn. Panicum maximum) Jacq. cv. Aruana] and three forage legumes: Macrotyloma [Macrotyloma axillare E. Mey (Verdc)], Calopo (Calopogonium mucunoides Desv.) and Stylo cv. Campo Grande (Stylosanthes macrocephala + Stylosanthes capitata).
Sowing was carried out in a total experimental area of 8000 m2 divided into paddocks. Legumes were sown in rows in October 2019, using 18 kg/ha of a seed mixture composed of 6 kg Macrotyloma, 8 kg Calopo and 4 kg Stylo, fertilised with 7.9 kg P/ha of single superphosphate. Planted legumes form symbiosis for biological N fixation with soil-native bacteria, not requiring the application of inoculants. Aruana guineagrass was planted later, about 120 days after planting the legumes, by broadcasting in February 2020, using 20 kg/ha seeds, mixed with 3.5 kg P/ha using single superphosphate. In November 2020, forage plants were overseeded in the entire area, starting with Aruana guineagrass by broadcasting (3.5 kg of seeds/ha) and then with a mixture of 1.0 kg/ha of each legume together with 2.0 kg of P/ha using single superphosphate.
The treatments consisted of four pasture management strategies, defined by forage canopy heights (15, 30, 45 and 60 cm) maintained under variable continuous stocking rate with sheep. The design was completely randomised blocks with four replications, totalling 16 experimental units (paddocks) of approximately 500 m2 each. The evaluations were carried out from February 2021 to March 2022 and the results were grouped according to the periods defined by the intervals Autumn (March to June 2021), Winter (July to September 2021), Early Summer (December 2021 and January 2022) and Late Summer (February and March 2022), respectively. In the October and November 2021, there were no evaluations in the pastures, since they were allowed to grow to return to the target management height after the mowing carried out in September 2021.
Grazing by the animals to adapt the pastures to the target canopy height started in December 2020. In September 2021, the area was cleared by mowing due to the occurrence of three frosts in Winter 2021, which made the evaluations in October and November impossible. From April to October (part of Autumn and Winter), it was necessary to remove all animals from the experimental areas due to the small amount of forage present in the paddocks and heights below the pre-established management goals.
Thirty-two crossbreed female ewes with approximately 30 kg ± 3.4 average initial weight were used for grazing (two ewes per paddock). Another 16 ewes, with average weight of 40 kg ± 5.3, were kept in the additional area and used for variable stocking.
Management strategies, defined by the forage canopy height, were maintained by means of periodic evaluations with the aid of sward measuring stick (Barthram Citation1985) at 50 points distributed throughout the experimental unit, to calculate the average height of each paddock. In periods of greater forage growth (Early and Late Summer), measurements were performed twice a week; in the others, they occurred once a week. When the treatment heights reached a value of 10% above or 10% below the target value, animals were placed in or removed from the units according to the ‘put and take’ method (Mott and Lucas Citation1952). The average heights of the forage canopy, obtained by monitoring the experimental areas, are illustrated in . The average values for the Autumn, Winter, Early Summer and Late Summer for the target pasture heights of 15-30-45-60 cm were, respectively, 20-24-40-49 cm, 15-19-28-33 cm, 17-32-45-56 cm and 14-30-43-51 cm in the four periods ().
Figure 3. Canopy height means according to established treatments.

Assessments
Herbage mass and botanical and morphological composition
Total herbage mass (HM) and its components were determined monthly by taking three samples from each paddock at points representing the average canopy height, in an area of 0.25 m2 (0.5 × 0.5 m). The cuts were made close to the ground with the aid of a manual grass trimmer. The forage from each sampling was collected and weighed. A subsample was taken from each sample and dried in a forced-air oven at 65°C for 72 h to determine the herbage dry matter percentage, and the values obtained were used to calculate the kg DM/ha. The remaining material from the three collected samples was pooled and a subsample was separated to determine the botanical components of Aruana guineagrass, forage legume species and weeds. Then, the Aruana guineagrass and legumes parts/fractions were separated in their morphological components, respectively: leaves (leaf for grasses and leaflets + petioles for legumes), stems (stems + leaf sheaths for grasses and branches for legumes)and dead material. The content related to each component was put in a paper bag and the bags were placed in a forced-air oven for drying at 65°C until reaching constant weight. With the respective mass values of each component, the individual proportion of these in the total herbage mass was calculated.
Tiller population density
Tiller population density (TPD) evaluations were carried out in different locations inside each paddock in relation to tiller population dynamics to prevent periodic manipulation of these areas from interfering with the estimate of population density. To determine the TPD, both basal and aerial tillers were counted inside metal frames with area of 0.25 m2 allocated at two points per experimental unit, representing the average condition of canopy height at the time of sampling. Evaluations were carried out in all periods to determine the total tiller population density (tTPD), basal tiller population density (bTPD) and aerial tiller population density (aTPD), in number of tillers/m2.
Tiller population dynamics
Tiller population dynamics was assessed at three points per experimental unit, representing the average canopy height, delimited by polyvinyl chloride (PVC) rings with area of 0.05 m2 each, respectively. Samplings were carried out every 28 days, in the interval of each period considered. In the first count, all tillers inside the ring were marked with metallic threads of a given colour, characterising the initial generation (‘zero’ generation). At each new count, new tillers that emerged inside the rings were marked with threads of a different colour from the previous ones, and the live tillers relative to the previous samples were counted. Dead tillers from previous generations, here called dry tillers or tillers removed by grazing, had their threads removed and were counted. Thus, every 28 days, a new generation of tillers was identified by a different colour, designated as generation 0 (G0), generation 1 (G1) and so on until the last evaluation. From the counts carried out in each evaluated period, the tiller appearance rate (TAR), tiller survival rate (TSR) and tiller mortality rate (TMR) were determined, expressed in tillers/100 tillers in 30 days, and the tiller population stability index was also computed.
The TAR, TSR and TMR were calculated as follows (calculation inside each ring containing the sampling area in each assessment):
where a is the number of new tillers marked, b is the total number of live tillers in the previous marking, c is the number of days in the period, and d is the number of live tillers marked previously.
The tiller population stability index (SI) was calculated from survival and appearance rates, to provide a general measure of population stability between two successive assessments (Bahmani et al. Citation2003). The SI between two successive evaluations was given by:
where P1 is the tiller population in the current assessment, P0 is the tiller population in the previous assessment, and TAR and TSR are the average tiller appearance and survival rates, respectively.
Statistical analysis
Analysis of variance was performed using PROC MIXED of the SAS statistical package (Statistical Analysis System), version 9.1. When the variables did not fit to the normal curve (Shapiro–Wilk test, P > 0.05), data were transformed until fit was achieved. To choose the covariance matrix, the Akaike information criterion (Wolfinger Citation1993) was used. The effects of forage canopy height, sampling period and their interactions were considered fixed effects and the block effect was considered random. The probability level adopted for the analysis of variance was 5%. The averages of the treatments were estimated using the LSMEANS function and the comparison between them, when necessary, was performed by the probability of difference (PDIFF), using the Student’s t-test with significance of 5%.
Results
Herbage mass and botanical and morphological components
There was canopy height*period interaction for total herbage mass (), with the highest averages of total herbage mass (HM) being observed in pastures managed at the two greatest heights (45 and 60 cm) and the lowest in the shorter pastures (15 and 30 cm) in all evaluated periods except the Early Summer, in which the heights 30, 45 and 60 cm did not differ from each other (). For the 15 cm height, the greatest averages were found in the Autumn and Winter periods. For heights of 30 and 45 cm, larger values were observed in the Autumn, Winter and Early Summer periods, and for 60 cm, total herbage mass remained constant between periods and there was no difference between them (). There was an effect of canopy height and period for mass of Aruana guineagrass and its leaves (). The mass of guineagrass and leaves was greatest in the highest pastures, 45 and 60 cm, in the periods Autumn and Early Summer for mass of guineagrass, and Early Summer for mass of leaves. For stem mass, there was canopy height*period interaction, with the greatest masses observed in the highest pastures (45 and 60 cm) (). For the height of 60 cm, the mass of stems did not vary among the periods, while at the other heights, there were differences between the periods ().
Table 1. Total forage mass and its botanical and mophological components in Aruana guineagrass and forage legumes mixed pasture with grazing management at 15, 30, 45 and 60 cm canopy heights under continuous stocking in Autumn, Winter, Early Summer and Late Summer periods.
There was canopy height*period interaction for the mass of legumes, their leaves and stems. Legume mass was greater in higher pastures, except in Autumn, when there was no difference between canopy heights (). The highest mass of legume leaves of all treatments was found in Late Summer, except for 60 cm, which did not differ from Early Summer (). The highest mass of legume stems was verified in the Early and Late Summer for all treatments, with the highest values for pastures kept at 60 cm (). There was only a period effect for dead material mass, which was higher in Autumn and Winter for all pasture heights (). For weeds, there was no effect of treatments, with averages of 92.8 ± 48 kg DM/ha.
There was a canopy height*period interaction for the leaf/stem ratio of Aruana guineagrass and the leaf/stem ratio of legumes. The leaf/stem ratio varied between canopy heights in the Early and Late Summer, with greater values at 15 cm than the other canopy heights in these periods (). The leaf/stem ratio of legumes was greater in higher pastures in Early Summer and in lower pastures in Late Summer ().
Proportion of botanical and morphological components in herbage mass
For the proportions of Aruana guineagrass and its stems in total herbage mass, there was an effect of canopy height and periods (). The proportions of Aruana guineagrass and stems were greater for the tallest pastures (). There was a canopy height*period interaction for the proportion of leaves. In Early Summer, the biggest averages occurred at heights of 15, 45 and 60 cm, and in Late Summer, the largest proportion of leaves was recorded at the height of 15 cm ().
Table 2. Proportion of botanical and mophological components of Aruana guineagrass and forage legumes mixed pasture with grazing management at 15, 30, 45 and60 cm canopy heights under continuous stocking in Autumn, Winter, Early Summer and Late Summer periods.
There was canopy height*period interaction for proportions of legumes and their leaves in the total herbage mass (). For the proportion of stems, there was an effect of period (). For all heights, the greatest proportion of legume plants, their leaves and stems occurred in Late Summer (). The largest proportions of legumes and their leaves in the Early Summer period were found in pastures maintained at a height of 60 cm, and in Late Summer in pastures kept at 30 cm (). For dead material, there was an effect of canopy height and period: between periods, the highest proportion of dead material occurred in Winter, and among canopy heights, in pastures kept at 15 cm, differing from the other heights (). For the proportion of weeds, there was no effect of the evaluated variables, with a general average of 1.6 ± 0.782%.
Tiller population density
There was a significant effect of the canopy height*period interaction for total tiller population density (tTPD) (P = 0.0044), basal tiller population density (bTPD)(P = 0.0002) and aerial tiller population density (aTPD) (P = 0.0048) (). Among the evaluated canopy heights, pastures kept at 15 cm resulted in higher bTPD and tTPD in all periods. Similarly, greater bTPD values were also observed in pastures managed at a height of 30 cm in Autumn and Winter, and tTPD at heights of 30 and 45 cm in Autumn, respectively (). For aTPD, there were no differences among the heights in the Winter and Early Summer periods. In the other periods, there were differences between canopy heights; in Autumn, where 45 cm presented the highest value, followed by pastures kept at 15, 30 and 60 cm. In Late Summer, 45 and 60 cm presented the highest value, and 15 cm, the lowest, while 30 cm did not differ from the others ().
Figure 4. Population density of basal tillers (a), aerial tillers (b) and total tillers (c) (tillers/m2) of Aruana guineagrass and forage legumes mixed pasture with grazing management at 15, 30, 45 and 60 cm canopy heights under continuous stocking in Autumn, Winter, Early Summer and Late Summer periods. Different capital letters indicate significant differences between periods and lowercase letters between canopy heights according to Student's t-test (P < 0.05).

Tiller population dynamics
For tiller population dynamics, there was a significant effect of the canopy height * period interaction (P = 0.0268) for tiller appearance rate (TAR) (). For TAR, 15 cm high pastures did not differ between periods; at 30 cm, the greatest values were found in Winter and Late Summer, and this did not differ from the others; at 45 cm, in Late Summer there was a difference from the others canopy heights; and at 60 cm, the results in Late Summer and Autumn did not differ from the others. In Autumn, the highest value was observed for the two tallest canopy heights (60 and 45 cm), while at 45, 30 and 15 cm, the pastures did not differ from each other. In Winter, the highest TAR occurred in the 30 cm pastures and differed from the others. In Early Summer, there was no difference between the pasture heights, and in Late Summer, the greatest TAR was observed in pastures of 45 cm, and the lowest in the 15 cm pastures, while 30 and 60 cm pastures did not differ from the others (). Tiller survival (TSR) and tiller mortality rates (TMR) were influenced only by periods (P < 0.0001). In Early Summer, the highest TSR was recorded, and in Winter and Late Summer, the lowest values were observed (88 and 65 tillers/100 tillers 30 days, respectively). The highest TMR value was found in Autumn and Early Summer (both with 44 tillers/100 tillers 30 days) and the lowest values were observed in the Winter and Late Summer (34 and 32 tillers/100 tillers 30 days, respectively) ().
Figure 5. Tiller appearance rate (TAR), tiller mortality rate (TMR) and tiller survival rate (TSR) rates of Aruana guineagrass and forage legumes mixed pastures with grazing management at 15, 30, 45 and 60 cm canopy heights under continuous stocking in Autumn, Winter, Early Summer and Late Summer periods. Different capital letters indicate significant differences between periods and lowercase letters between canopy heights according to Student's t-test (P < 0.05).

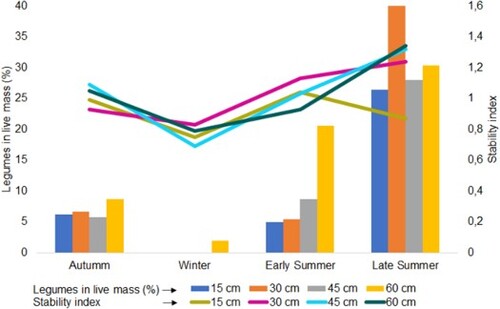
For the stability index (SI), there was an effect of the canopy height * period interaction, as shown in . Values of the stability index were not different from each other in the Autumn, when 45 cm differed from 30 cm, and Late Summer, when the 30, 45 and 60 cm tall pastures had greater SI compared to the previous period, differing from the 15 cm pasture, which showed a marked drop in the index, remaining below 1.0 ().
Figure 6. Stability index (SI) of Aruana guineagrass and forage legumes mixed pastures with grazing management at 15, 30, 45 and 60 cm canopy heights under continuous stocking in Autumn, Winter, Early Summer and Late Summer periods. Different capital letters indicate significant differences between periods and lowercase letters between canopy heights according to Student's t-test (P < 0.05).

Discussion
The canopy height averages were close to the goals proposed as treatments (). In the Autumn and Winter periods, pastures were below the pre-established target, mainly the greatest canopy heights (). During the 2021–2022 agricultural year, the meteorological variables and water balance were unfavourable for plant development, even during the rainy season, with infrequent and weak rainfall (), which generated a water deficit during most of the evaluation periods ().
Total herbage mass was greatest in higher pastures (45–60 cm) with the greatest herbage mass, leaf and stem mass, following a pattern similar to reports in the literature (Da Silva et al. Citation2013; Sbrissia et al. Citation2020; Terra et al. Citation2020), where taller canopy heights contain larger tillers, increasing the mass in relation to lower heights (Sbrissia et al. Citation2010). For the proportion of Aruana guineagrass and stems, we observed the same pattern of responses, with greater values in the highest pastures (), but the results for the proportion of leaves were different from the mass of leaves, because there was a lower proportion of leaves in higher pastures. That can be explained by the greater proportion of stems in these pastures (). Pastures with light interception (LI) above 95% under rotational stocking have higher mass and proportion of stems (Pedreira et al. Citation2017). For Aruana guineagrass under rotational stocking, 95% LI was reached with a canopy height of 30 cm (Campos et al. Citation2021), indicating that pastures kept at 45 and 60 cm in height had already exceeded this LI, which explains the greater mass () and proportion () of stems in higher pastures compared to lower ones.
The masses of legumes, their leaves and stems were greatest in pastures managed at taller heights (45 and 60 cm) compared to lower ones (15 and 30 cm) during periods of growth (Early and Late Summer) (), Possibly because climbing and twining legumes are not resistant to intense grazing, with high tissue removal (Andrade Citation2009), which occurred in pastures maintained at lower heights. In this sense, the greater mass of legumes in pastures managed at greater heights () may be related to the strategy used by legumes with twining growth habit of climbing to the upper parts of the canopy to achieve greater light interception (Alviarez et al. Citation2020), becoming more exposed to animal consumption with the increase in the stocking rate, and greater defoliation frequency at shorter compared to taller canopy heights.
There was a significant increase in the mass and proportion of legumes (leaves and stems) in Late Summer ( and ) in relation to the other periods. The greater presence of legumes at the end of the rainy season (Late Summer) ( and ) may have been caused by the phenology of the three evaluated species (Macrotyloma axillare, Calopogonium mucunoides and Stylosanthes spp.), which are propagated by seeds. In Autumn, pods open and seeds are deposited in the soil, while the plants cease growing and dead tissues fall to the soil, mainly leaves, where they remain throughout the dry period. Teodoro et al. (Citation2011) reported that the reproductive behaviour of the legumes Stylo and Calopo aims to guarantee their perenniality with the deposition of seeds before the dry period for germination in the following rainy period. This leaf fall and lack of growth is one of the reasons for the low mass of legumes in the dry period (Winter and Early Summer), as described in and .
The proportions of legumes in this study () are close to the values described by Gerdes et al. (Citation2020) for Aruana guineagrass pastures mixed with Macrotyloma or Calopo and within the recommended range for the presence of legumes in the herbage mass, between 20 and 40% (Spain and Pereira Citation1985), in the expected range of mixed systems. It is important to emphasise there was an increase in the mass and proportion of legumes throughout the experimental period ( and ), indicated that the combination of species and grazing management strategies are effective for use in pastoral systems. The low mass and proportion of weeds ( and ) show that the mixture of grass and legumes predominates in the pastures, also suggesting use potential in field.
In Autumn and Winter, when the respective rainfall values were only 39.5 and 17.9 mm (), the mass of dead material was greater (), causing an increase in plant tissue senescence, and hence a difference in dead material between the dry and wet periods. The highest proportion of dead material was found for the height of 15 cm (), in agreement with Flores et al. (Citation2008), who evaluated Xaraés palisadegrass and reported that pastures under continuous stocking at 15 cm had a higher proportion of dead material compared to those managed at 40 cm. Probably because shorter pastures have less living tissues (green leaves and stems), and the dead material takes time to detach from the plant and fall to the ground, thus increasing the proportion of dead material than in taller pastures with more living tissues. The greatest leaf/stem ratio of Aruana guineagrass occurred at a height of 15 cm () in the climate conditions most favourable to plant growth, Early and Late Summer ( and ). In general, in this study, we observed a low percentage of leaves in the total herbage mass (), leading to smaller leaf/stem ratio values. According to Euclides et al. (Citation2014), this is common in pastures under continuous stocking due to the greater possibility of leaves selection by animals in relation to rotational stocking. The legume leaf/stem ratio showed a strong interaction between canopy height and period, with high interchange ratios between taller (Autumn and Early Summer) and shorter pastures (Late Summer) ().
Higher bTPD and tTDP values were observed for pastures at lower canopy heights in all evaluation periods (), corroborating results of other researchers of a decrease in tiller population density in pastures managed at greater heights (Sbrissia et al. Citation2010; Terra et al. Citation2020; Barbosa et al. Citation2021). The variation of bTPD between pasture heights within each period () can be attributed to phenotypic plasticity of the forage plant towards changes in pasture management and climate conditions. The Early and Late Summer had climatic conditions to promote high tiller population density. However, in Early Summer this was not verified for tTPD and aTPD (), which may be related to the mowing carried out after Winter, which possibly altered the tiller population demography, causing the amount of remaining plant residue to reduce light incidence on the plants, delaying tillering.
In general, the average presence of aerial tillers increased with increasing height of the treatments (). Pereira et al. (Citation2014) also reported an increase in aerial tillers in pastures with low defoliation frequency. Thus, there was an association between canopy height and this variable (Sbrissia et al. Citation2010), possibly caused by the greater number of axillary buds per tiller in taller pastures. Regarding the periods, there was an increase in the number of aerial tillers for all treatments in Late Summer (), coinciding with the onset of the reproductive stage of the grass that was under grazing. Difante et al. (Citation2008) also reported in a study of B. brizantha cv. Marandu that the proportion range of aerial tillers was 34–56% in relation to the total tillers and they were small, had a shorter lifespan, and although they were highly present in the tiller population, their contribution to forage production as a whole was small.
According to Mitchell (Citation1953), changes in temperature and light regime influence the tillering dynamics of grasses, favouring an increase in TPD when plants are under ideal growth conditions. We observed alterations in tillering dynamics according to the evaluation periods, In Late Summer, pastures maintained at 15 cm had the lowest TAR (), a period in which there was a higher stocking rate in lower pastures, with greater removal of leaf tissues, reducing the photosynthetic rate of plants and their leaf area (). Importantly, in situations where forage plants are subjected to some level of stress, pasture tillering is reduced, decreasing forage production (Assuero and Tognetti Citation2010; Sbrissia et al. Citation2020), causing pasture degradation over time. There was no difference for TMR and TSR among the canopy heights evaluated, showing that the differences in the stability index were mainly derived from changes in TAR.
To ensure the stability of forage plants, continuous renewal of tillers is important. The stability index is the ratio of TAR to TSR (Bahmani et al. Citation2003), and values lower than 1 indicate lower TAR in relation to TSR, indicating pasture instability (Silva et al. Citation2020). In the present study mean SI values remained close to 1 during Autumn (). Values of TAR and TSR in this period remained intermediate and TMR was higher (), which probably resulted in SI values lower than 1 in Winter at all pasture heights. Pastures kept at 15 cm showed SI below 1.0 during the Autumn, Winter and Late Summer periods, with a significant drop in the latter period compared to Early Summer. During Early Summer, an increase in the SI was observed (), indicating that the tillering potential of Aruana guineagrass is effective when the light and rainfall become favourable again. Mowing probably influenced tiller renewal at the 60 cm height, which remained unstable during Early Summer (). In Late Summer, although pastures maintained at 15 cm had the highest tTPD (), TAR was lower (), and insufficient to compensate for the death of tillers, which could compromise the stability of pastures kept at 15 cm (), a condition that can negatively affect plant persistence and pasture productivity, as also reported by Sbrissia et al. (Citation2010) regarding Marandu palisadegrass pastures kept at 10 cm. For the reasons discussed above, also considering lower proportions of Aruana guineagrass leaves and legume mass and a higher proportion of dead material in 15 cm pastures, the grazing management strategy for pastures mixed with these species maintained at 15 cm should not be recommended.
Conclusion
The management strategies influenced herbage mass, tiller population density, tillering dynamics and the increase in the proportion of legumes throughout the experimental period. In Late Summer, de pastures kept at 30–60 cm had legume proportion within the ideal range for mixed pastures. Pastures kept at 15 cm height were less stable in tiller population and legume mass. Pastures of Aruana guineagrass and forage legumes can be managed in the height range of 30–60 cm under continuous stocking.
Acknowledgments
The authors are grateful for Instituto de Zootecnia and its staff for the operational support.
Data availability statement
The data that supports this study will be shared upon reasonable request to the corresponding author.
Disclosure statement
No potential conflict of interest was reported by the author(s).
Additional information
Funding
Notes on contributors
Ana Flávia Bastos Ongaro
Ms. Ana Flávia Bastos Ongaro has experience in the area of Animal Science, with emphasis on Forage, working mainly on the following topics: Morphological evaluations of forage species, Pastures in rotational and continuous stocking, Morphogenesis of plants, Mixed pastures of grasses and legumes and Grazing management. Acts as research and development analyst.
Janaina Azevedo Martuscello
Dr. Janaina Azevedo Martuscello is a professor at the Universidade Federal de São João Del Rei, in São João Del Rei, Minas Gerais State, Brazil and at Universidade Federal dos Vales do Jequitinhonha e Mucuri, Brazil. She is State Director of ABZ Minas, coordinates the Foraging Study Group (GEFOR) and social networks ‘Foraging and Pastures’. She has experience in the area of Animal Science, with emphasis on Forage Plant Breeding, Pasture Management and Fertilization and Forage Plant Ecophysiology.
Flavia Maria de Andrade Gimenes
Dr. Flávia Maria de Andrade Gimenes is a Professor and Scientific Researcher at the Instituto de Zootecnia in Nova Odessa, São Paulo, Brazil, where she coordinates and participates in projects related to Animal Production in Pastures Systems. She works in the area of Pastures and Animal Production, currently participating in projects focused on the grazing management with emphasis on grass-legume pastures.
Ana Carolina Lopes Batista
Ms. Ana Carolina Lopes Batista participated in scientific projects at the Instituto de Zootecnia, in the area of Animal Production with emphasis on Pastures, Animal Nutrition, Management, Animal Welfare and Sustainability. Acts as State Agricultural Inspector in Inspection in the Official Animal Health Defense.
Lucas Ferreira Penteado
Ms. Lucas Ferreira Penteado has experience in the area of Pastures and Forage, Grazing Management and Mixed Pastures. He is Specialist in Agribusiness and currently attending postgraduate studies at Faculdades Associadas de Uberaba (FAZU) and PhD at Instituto Agronômico de Campinas, São Paulo State, Brazil.
Linda Mônica Premazzi
Dr. Linda Mônica Premazzi is a Scientific Researcher at the Instituto de Zootecnia, where she coordinates and participates in projects in the area of Agronomy with emphasis on Forage Plants in the themes of Soil Fertility, Fertilization and Plant Nutrition and Grass-Legumes Pastures.
Waldssimiler Teixeira de Mattos
Dr. Waldssimiler Teixeira de Mattos is Director of Technological Innovation Center, Professor and Scientific Researcher at the Instituto de Zootecnia, where he coordinates and participates in projects related to the areas of Foraging and Pastures, Mineral Nutrition of Forage Plants, Botany and Morphology of Forage Plants and Management and Conservation of Genetic Resources of Forage Plants. Currently participating in projects focused on the Sustainability of Integrated Systems.
Marcelo Moretin Vieira
Marcelo Moretin Vieira is Graduating in Veterinary Medicine at the Centro Universitario de Jaguariúna (UNIFAJ). Scientific initiation project completed by FAPESP at Instituto de Zootecnia, with a research internship at the University of Florida, USA. The research activities accomplished were in the area of animal production with a focus on the use of pastures. Currently he is Quality Assurance intern at the Boehringer Ingelheim industry, focusing on the health and assurance of the world's livestock and companion animals.
Ricardo Lopes Dias da Costa
Dr Ricardo Lopes Dias da Costa is Professor and Researcher in the area of Animal Production at the Instituto de Zootecnia. He is currently developing research in the area of Sheep Feeding Efficiency and Sustainability in Sheep Production Systems.
Luciana Gerdes
Dr. Luciana Gerdes is a Scientific Researcher at the Instituto de Zootecnia. She has experience in the area of Forage and Pasture, working mainly on the topics Fertilization of pastures, grazing management with sheep and cattle, grass-legume pasture, and temperate grassland species. She is currently the Director of Pastures and Animal Feeding Center of the Instituto de Zootecnia.
References
- Alviarez LAD, Homem BGC, Couto PHD, Dubeux JCB, Bernardes TF, Casagrande DR, Lara MAS. 2020. Managing “Marandu” palisadegrass and calopo pastures based on light interception. Grass Forage Sci. 75:447–461. doi:10.1111/gfs.12501.
- Andrade Cd. 2009. Estratégias de Manejo do Pastejo para Pastos Consorciados nos Trópicos. In: Gonçalves RC, de Oliveira LC, editors. Embrapa Acre: Ciência e Tecnologia para o Desenvolvimento Sustentável do Sudoeste da Amazônia. Rio Branco, AC, Brazil: Embrapa Acre Publishing; p. 163–180. https://www.alice.cnptia.embrapa.br/bitstream/doc/661758/1/22906.pdf.
- Assuero SG, Tognetti JA. 2010. Tillering regulation by endogenous and environmental factors and its agricultural management. Am J Plant Sci Biotechnol. 4:35–48.
- Bahmani I, Thom ER, Matthew C, Hooper RJ, Lemaire G. 2003. Tiller dynamics of perennial ryegrass cultivars derived from different New Zealand ecotypes: effects of cultivar, season, nitrogen fertilizer, and irrigation. Aust J Agric Res. 54:803–817. doi:10.1071/AR02135.
- Barbosa PL, Silva VJ, Pedreira CGS, Sbrissia AF, Sollenberger LE. 2021. Herbage accumulation and tillering dynamics of ‘Zuri’guineagrass under rotational stocking. Crop Sci. 61:3787–3798. doi:10.1002/csc2.20536.
- Barthram GT. 1985. Experimental techniques: the HFRO sward stick. In: Hill farming research organization. Bienal report, p. 29–30.
- Batista K, Giacomini AA, Mattos WT, Gerdes L, Otsuk IP, Gimenes FMA. 2018. Bromatological characteristics of Macrotyloma axilare in functions combined supply of phosphorus and calcium. Biosci J. 34:1674–1682. doi:10.14393/BJ-v34n6a2018-39822.
- Boddey RM, Casagrande DR, Homem BG, Alves BJ. 2020. Forage legumes in grass pastures in tropical Brazil and likely impacts on greenhouse gas emissions: a review. Grass Forage Sci. 75:357–371. doi:10.1111/gfs.12498.
- Braga GJ, Ramos AKB, Carvalho MA, Fonseca CEL, Fernandes FD, Fernandes CD. 2020. Liveweight gain of beef cattle in Brachiaria brizantha pastures and mixtures with Stylosanthes guianensis in the Brazilian savannah. Grass Forage Sci. 75:206–215. doi:10.1111/gfs.12473.
- Campos FP, Sarmento P, Mattos WT, Gerdes L, Carnevalli RA, Lima CG. 2021. Management of Aries and Aruana Guinea grass cultivars under rotational stocking based on canopy light interception. J Agric Sci. 159:385–403. doi:10.1017/S0021859621000678.
- Da Silva SC, Gimenes FMA, Sarmento DOL, Sbrissia AF, Oliveira DE, Hernadez-Garay A, Pires AV. 2013. Grazing behaviour, herbage intake and animal performance of beef cattle heifers on marandu palisade grass subjected to intensities of continuous stocking management. J Agric Sci. 151:727–739. doi:10.1017/S0021859612000858.
- Depablos L, Homem BGC, Ferreira IM, Bernardes TF, Boddey RM, Lara MAS, Casagrande DR. 2021. Nitrogen cycling in tropical grass-legume pastures managed under canopy light interception. Nutr Cycling Agroecosyst. 121:51–67. doi:10.1007/s10705-021-10160-7.
- Difante GDS, Nascimento Júnior DD, Silva SCD, Euclides VPB, Zanine ADM, Adese B. 2008. Dinâmica do perfilhamento do capim-marandu cultivado em duas alturas e três intervalos de corte (Tillering dynamics of marandu palisadegrass submitted to two cutting heights and three cutting intervals). Rev Bras Zootec. 37:189–196. doi:10.1590/S1516-35982008000200003.
- Duchini PG, Guzatti GC, Echeverria JR, Américo LF, Sbrissia AF. 2018. Experimental evidence that the perennial grass persistence pathway is linked to plant growth strategy. PLoS One. 13:e0207360. doi:10.1371/journal.pone.0207360.
- Euclides VPB, Montagner DB, Barbosa RA, Nantes NN. 2014. Manejo do pastejo de cultivares de Brachiaria brizantha (Hochst) Stapf e de Panicum maximum Jacq (Pasture and grazing management of Brachiaria brizantha (Hochst) Stapf and Panicum maximum Jacq). Revista Ceres. 61:808–818. doi:10.1590/0034-737x201461000006.
- Ferreira IM, Homem BG, De Lima IBG, Dubeux Junior JCB, Bernardes TF, Danés MDAC, Casagrande DR. 2022. Twenty-five-centimeter pre-grazing canopy height in palisade grass and forage peanut. Scientia Agricola. 79:e20200090. doi:10.1590/1678-992X-2020-0090.
- Flores RS, Euclides VPB, Abrão MPC, Galbeiro S, Difante GDS, Barbosa RA. 2008. Desempenho animal, produção de forragem e características estruturais dos capins marandu e xaraés submetidos a intensidades de pastejo (Animal performance, forage yield and structural characteristics of palisadegrass cvs. Marandu and Xaraes submitted to grazing intensities.). Braz J Anim Sci. 37:1355–1365. doi:10.1590/S1516-35982008000800004.
- Gerdes L, Barbosa CMP, Giacomini AA, Mattos WTD, Gimenes FMDA, Batista K, Uzan BZ. 2020. Introduction of forage legume into Aruana Guineagrass pasture. Bol Ind Anim. 77:1–10. doi:10.17523/bia.2020.v77.e1472.
- Jank L, Valle CB, Resende RMS. 2011. Breeding tropical forages. Crop Breed Appl Biotechnol. 11:27–34. doi:10.1590/S1984-70332011000500005.
- Lima PMT, Moreira MD, Sakita MD, Natel AS, Mattos WT, Gimenes FMA, Gerdes L, Mcmanus C, Abdalla AL, Louvandini H. 2018. Nutritional evaluation of the legume Macrotyloma axillare by using in vitro and in vivo bioassays with sheep. J Anim Physiol Anim Nutr. 102:669–676. doi:10.1111/jpn.12810.
- Mero RN, Uden P. 1997. Promising tropical grasses and legumes as feed resources in central Tanzania. I. Effect of different cutting patterns on production and nutritive value of six grasses and six legumes. Trop Grassl. 31:549–555.
- Mitchell KJ. 1953. Influence of light and temperature on the growth of ryegrass (Lolium spp.) I. Pattern of vegetative development. Physiol Plant. 6:21–46. doi:10.1111/j.1399-3054.1953.tb08930.x.
- Mott GO, Lucas HL. 1952. The design, conduct and interpretation of grazing trials on cultivated and improved pastures. In: Wagner R.E., Myers W.M., Gaines S.H. and Lucas H.L. (eds.), Proceedings of the 6th international grassland congress. Pensylvania: State College, p. 1380–1395. Hershey, Pennsylvania, USA: Pennsylvania State College.
- Pedreira CGS, Braga GJ, Portela JN. 2017. Herbage accumulation, plant-part composition and nutritive value on grazed signal grass (Brachiaria decumbens) pastures in response to stubble height and rest period based on canopy light interception. Crop Pasture Sci. 68:62–73. doi:10.1071/CP16333.
- Pereira LET, Paiva AJ, Geremia EV, Da Silva SC. 2014. Components of herbage accumulation in elephant grass cv Napier subjected to strategies of intermittent stocking management. J Agric Sci. 152:954–966. doi:10.1017/S0021859613000695.
- Sánchez-Navarro V, Zornoza R, Faz Á, Fernández JA. 2020. A comparative greenhouse gas emissions study of legume and non-legume crops grown using organic and conventional fertilizers. Sci Hortic. 260:108902. doi:10.1016/j.scienta.2019.108902.
- Sbrissia AF, Da Silva SC, Sarmento DO, Molan LK, Andrade FM, Gonçalves AC, Lupinacci AV. 2010. Tillering dynamics in palisadegrass swards continuously stocked by cattle. Plant Ecol. 206:349–359. doi:10.1007/s11258-009-9647-7.
- Sbrissia AF, Schmitt D, Duchini PG, Da Silva SC. 2020. Unravelling the relationship between a seasonal environment and the dynamics of forage growth in grazed swards. J Agron Crop Sci. 206:630–639. doi:10.1111/jac.12402.
- Silva LS, Silva VJ, Yasuoka JI, Sollenberger LE, Pedreira CGS. 2020. Tillering dynamics of ‘Mulato II’brachiariagrass under continuous stocking. Crop Sci. 60:1105–1112. doi:10.1002/csc2.20008.
- Spain JM, Pereira JM. 1985. Sistemas de manejo flexible para evaluar germoplasma bajo pastoreo: Una propuesta. In: C Lascano, E Pizarro, editors. Evaluación de pasturas con animales: alternativas metodológicas. Cali, Colombia: International Center for Tropical Agriculture Publishing; p. 85–97.
- Teodoro RB, Oliveira FLD, Silva DMND, Fávero C, Quaresma MAL. 2011. Perennial herbaceous legumes used as permanent cover cropping in the Caatinga Mineira. Rev Ciênc Agron. 42:292–300. doi:10.1590/S1806-66902011000200006.
- Terra S, Gimenes FMA, Giacomini AA, Gerdes L, Manço MX, Mattos WTD, Batista K. 2020. Seasonal alteration in sward height of Marandu palisade grass (Brachiaria brizantha) pastures managed by continuous grazing interferes with forage production. Crop Pasture Sci. 71:285–293. doi:10.1071/CP19156.
- Thornthwaite CW, Mather JR. 1955. The water balance. Publications in climatology. New Jersey: Drexel Inst. of Technology, p. 104.
- Werner JC, Paulino VT, Cantarella H. 1996. Recomendação de adubação e calagem para forrageiras. Recomendação de adubação e calagem para o Estado de São Paulo. Campinas: IAC; p. 263–271.
- Wolfinger RD. 1993. Covariance structure section in general mixed models. Commun Stat Simul Comput. 22:1079–1106. doi:10.1080/03610919308813143.